Utilization of medical care has risen dramatically since Medicare began in 1965. In that year, health expenditures accounted for 5.7 percent of the nation’s output. By 2000, the health care sector comprised 13.2 percent of Gross Domestic Product (GDP). Medicare has helped to fuel this dramatic rise. In 1970, Medicare accounted for 11 percent of all health care expenditures in the United States; by 2000, its share stood at 17 percent. So health care spending has grown faster than the economy as a whole, and Medicare expenditures have grown faster than health care expenditures in general.
In the future, Medicare will consume an even greater share of the nation’s output because there will be (1) more beneficiaries as the baby boomers retire, (2) longer retirement periods as life expectancy increases, and (3) rising medical costs as medical expenditures grow faster than the economy. We can expect Medicare’s claims on our national resources to double between now and 2035.
What explains Medicare’s rapid growth? Many believe that part of the explanation is the extraordinary sums spent on patients nearing the end of life. But the real question is whether spending on these patients has risen relative to spending on the rest of the Medicare population.
The Cost of Dying.
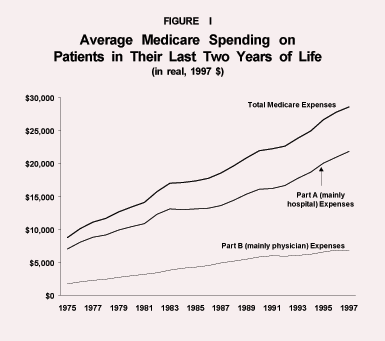
Dying is expensive. Medicare spending averaged $28,616 in the last two years of life among those who died in 1997 (or $14,308 per year). That is in addition to the amounts the patients and the patients’ families spent out of pocket. To put this in perspective, the average amount Medicare spent on enrollees who did not die (the survivors) in 1997 was $3,663. On an annual basis, patients who died consumed more than four times as much medical care, on average, than did those who survived. We chose to focus on individuals who are within two years of death because spending in the last two years of life rises substantially when compared to other years.
As indicated in Figure I, the costs incurred in the last two years of life have grown over time after adjusting for inflation. The annual real growth rate from 1975 to 1997 was 5.2 percent. The figure also shows that most of the costs occurred in the hospital, where charges averaged $21,830 over the last two years of life for those who died in 1997. On a yearly basis, this translates to 4.75 times the annual hospitalization cost for survivors. As these numbers indicate, health care spending on people during the last two years of life is high and growing.
Decedents vs. Survivors.
How does the cost of dying compare to the costs incurred by individuals who did not die over the same time period? Interestingly, the average cost among survivors has grown more rapidly than the average cost of those in the last year of life — at an annual real rate of 6 percent. Survivors’ costs are defined as those incurred by individuals who are at least two years removed from the year of death. In 1975, the average amount spent on a survivor was 25 percent of the average annual spending on a decedent. By 1997, average spending on a survivor grew slightly to 26 percent of the average annual spending on a decedent. Thus while spending by survivors is small relative to spending by decedents, the cost of dying does not appear to be growing any faster than the rest of Medicare spending.
During this same period, however, the average age of death among Medicare beneficiaries 65 years of age and above grew 2.4 years from 78.8 to 81.2. The average age of survivors grew 1.7 years from 73.4 to 75.1. These averages indicate a changing age structure of the Medicare population and a changing distribution of spending. Although we generally expect older patients to be more expensive patients, the cost of dying actually declines as people age. For example, average spending by individuals who die at the ages 80 to 84 is 86 percent of the spending by individuals who die at ages 65 to 69. Spending by those who die at age 85 and above is two-thirds of spending by those who die at ages 65 to 69.
Cost of Dying vs. All Medicare Spending.
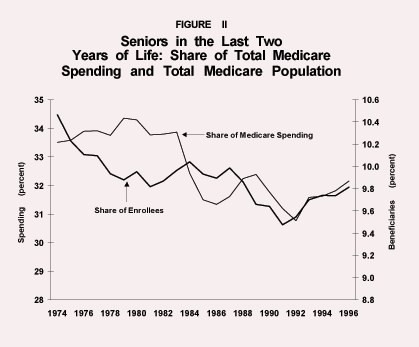
Another way to identify the cost of dying is to look at the share of total Medicare spending incurred by decedents. Roughly speaking, individuals in the last two years of life account for almost one-third of annual Medicare spending, even though these decedents account for fewer than 10 percent of all Medicare beneficiaries. In 1979, as Figure II shows, spending on decedents peaked at 34.4 percent of total Medicare spending, while in 1992 it fell to a low of 30.8 percent. In 1996, it stood at 32.2 percent of the total. The percentage of the total population in the last two years of life in any given year also has been changing. In 1974, 10.5 percent of the Medicare population was in the last two years of life; by 1996, the share was 9.8 percent.
Adjusting the Averages.
As the previous summary indicates, comparing averages and shares of Medicare spending is complicated by the changing age structure. Such comparisons can also be skewed by the effects of very high expenditures on the calculation of averages. A final way to compare the cost of dying to the rest of Medicare spending is to control for the effects of age on spending and then compare the survivors’ spending to decedents. Whether we examine decedents who are one year from death or those who are in the year of death, the percentage of survivors with higher spending than those in the last years of life fell from 1974 to the mid-1980s, but has been stable since.
Conclusion.
While Medicare expenditures by individuals in their last two years of life dwarfs spending of other beneficiaries, the cost of dying does not appear to have risen — or to be rising — faster. Nor does spending on the last years of life appear to be fueling Medicare’s spending growth. At the same time, survival rates after major medical interventions have improved and death has been delayed. As a result, spending in the last years of life does not appear to be hastening Medicare spending growth.
Andrew J. Rettenmaier and Zijun Wang are with the Private Enterprise Research Center at Texas A&M University. Rettenmaier is a senior fellow with the NCPA. This analysis is based on “Dimensions in Medicare Spending”