Urban sprawl has sparked a national debate over land-use policy, launching a movement in the past decade called "smart growth." Advocates of such policies contend that urban sprawl causes crime and congestion, and limits opportunities for the poor and minorities. They argue for such development policies as drawing "growth boundaries" around cities, outside of which residential and business development is banned or severely restricted. Inside the boundaries, however, zoning restrictions and tax incentives encourage high density development.

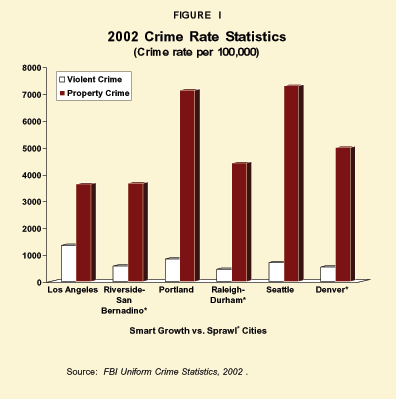
Smart Growth Does Not Reduce Crime. Author Douglas Morris and other smart growth advocates claim that suburban sprawl contributes to increased violent crime rates. Accordingly, the Local Government Commission's Center for Livable Communities promotes policies that create densely developed, walkable neighborhoods with bike paths and common areas that provide more "eyes on the street." These policies are known as Crime Prevention through Environmental Design (CPTED). But a comparison of crime rates among cities characterized as "smart growth" and "sprawlers" reveals a different story. As Figure I shows:
- In 2002, Los Angeles' violent crime rate of 1,349 per 100,000 was more than double that of the Riverside-San Bernardino metro area, considered the country's most sprawling area by Smart Growth America.
- Portland 's violent and property crime rates of 828 and 7,127 per 100,000, respectively, were much higher than sprawling Raleigh-Durham , N.C. , with rates of 455 and 4,416.
- Seattle 's violent and property crime rates of 705 and 7,298 per 100,000 outpaced sprawling Denver 's rates of 534 and 4,994.
In addition, both violent and property crime rates in Portland , Seattle and Los Angeles are much higher in the central city than in the wider metropolitan area including the suburbs. In fact, according to FBI crime statistics there are no suburbs in the country with a higher murder rate than their associated central city.
Smart growth CPTED policies have produced mixed results at the neighborhood level as well:
- A Raleigh, N.C., study showed that street robberies were less likely in neighborhoods with sprawl-associated features like cul-de-sacs, high rates of home ownership and single family homes.
- In New Bed-fordshire , England , neighborhoods designed using Europe 's equivalent of CPTED averaged more than twice the number of crime and disorder incidents per year (5,200) as traditional neighborhoods of comparable size (1,800).
Smart Growth Does Not Reduce Congestion. By increasing high-density development centered on mass transit, smart growth advocates hope commuters will abandon their cars for the convenience and lower cost of public transportation. But U.S. Census Bureau data reveals that has not happened:
- In 13 of 15 major cities with light rail systems, automobile trips as a share of overall transportation have increased an average of 2.5 percent, while the market share of mass transit has declined.
- Ironically, the greatest increase in auto use occurred in Washington, D.C., where – despite the construction of a $10 billion, 100-mile-long light rail system – the share of trips taken by auto rose from 73.9 percent in 1970 to 79.3 percent in 2000.
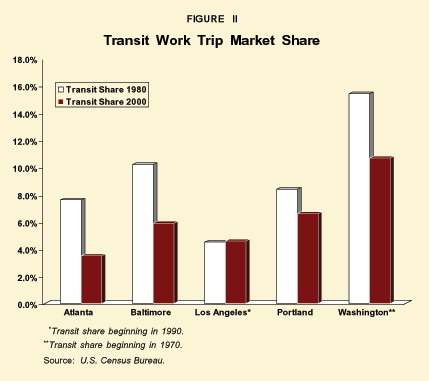
- Indeed, mass transit's market share has dropped in several large cities with smart growth policies – Portland , for instance, has experienced a 22 percent decline since 1980, and only Los Angeles saw a slight increase. [See Figure II.]

Smart Growth Hurts Lower-Income and Minority Families. In some states, growth management acts (GMAs) that restrict development have made housing less affordable for middle class families. A recent study by the Reason Public Policy Institute observed three states where statewide GMAs were implemented in the 1990s. The result:
- In Washington State, housing prices increased about 8.6 percent from 1995 to 2000 in counties that were not required to implement GMA restrictions, whereas prices increased almost 16 percent in counties with growth restrictions.
- In Florida, 20 percent of the increase in urban-area housing prices from 1994 to 2000 was attributable to GMA rules.
- In Oregon , housing prices almost doubled between 1991 and 2000 – from $75,100 to $146,500 – a 95 percent increase that far outpaced the 39.8 percent growth in the national median house price.
A study by the Urban Institute indicates that smart growth policies reduce both housing affordability and economic opportunity, especially for minorities. The study measured the ratio of urban development relative to population growth – called the dispersion rate – with a higher rate indicating greater sprawl. It also measured economic opportunity by the concentration of poverty, wage gaps between black and white males, and the availability of so-called living wage jobs – which pay well above the minimum wage – for black male heads-of-households. Researchers found that:
- The degree of sprawl in a metropolitan area is positively associated with economic opportunity and social equity – in other words, there tend to be more living wage jobs available in sprawling cities.
- Portland‘s dispersion index indicated no sprawl between 1980 and 1990, but living wage employment for less educated males declined 24 percent; for black males, the decline was an even steeper 48 percent.
- Norfolk , Va. , ranked the highest on the dispersion index from 1980 to 1990, and also experienced the second-highest growth in economic opportunity during that period.
Conclusion . Even in the face of high impact fees, suburbs continue to grow and develop – because consumers demand them. Market forces, not bicycle paths, create villages.
H. Sterling Burnett, Ph.D., is a senior fellow, and Pamela Villarreal is a research associate, with the National Center for Policy Analysis.