Critics complain that the 2001 and 2003 Bush tax cuts gave the greatest tax relief to the wealthiest taxpayers. However, every major tax bill over the past 15 years — both Republican and Democrat — has increased the progressivity of the federal income tax system.
What Makes A Tax System Progressive? The structure of the federal income tax system is progressive — each additional (marginal) increment of income is taxed at a slightly higher rate. Current marginal tax rates range from 10 percent for low-income earners up to 35 percent for the highest-income earners. However, statutory rates do not accurately measure the progressivity of the tax system. Instead, progressivity is better measured by: (1) the share of taxes paid by different income groups, (2) the share of income paid in taxes, (3) the change in taxes relative to the change in income over time and, finally, (4) a comparison of inequality of income to the inequality of taxes over time.
Do the Rich Pay a Greater Share of the Total Tax Burden? The top 1 percent of earners pays more than one in every three dollars the IRS collects in taxes. Furthermore, data from the Tax Foundation shows that the share of federal income taxes paid by wealthier income groups has increased over time:
- From 1986 to 2004, the total share of the income tax burden paid by the top 1 percent of income earners grew from 25.8 percent to 36.9 percent.
- During the same period, the total share of the tax burden paid by the bottom 50 percent fell from 6.5 percent to 3.3 percent.
Do the Rich Pay More of Their Income in Taxes? The Congressional Budget Office reports that:
- The percentage of income the top 1 percent of tax filers paid in federal income taxes rose from 18.3 percent to 19.6 percent from 1986 to 2004.
- By contrast, the percentage of income the bottom fifth of tax filers paid in federal income taxes dropped from 0.4 percent to zero.
Has the Tax Share of the Rich Increased More Than Their Income Share? Over time, the share of taxes paid by the rich has grown more than their share of income. For example, between 1986 and 2004:
- The income share of the top 1 percent of taxpayers rose 7.7 percentage points, from 11.30 percent to 19 percent of total income.
- The share of income taxes paid by the top 1 percent rose even more, by 11 percentage points, from 26 percent to 37 percent of total income taxes paid.
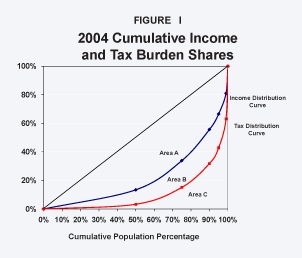
Measuring the Inequality of Income Shares and Tax Burdens. Figure I displays income and tax burden distribution data for all income groups in 2004.
- The income curve represents the cumulative shares of each income group, from poorest to richest; if income were equally distributed across the entire economy, the line would be straight, with a slope of 45 degrees from the origin (zero).
- However, the rich, as a group, earn a larger share of total income than the poor, as a group; for example, the top 1 percent of earners in 2004 received 19 percent of total income. Because of this unequal distribution, the curve bows out from a 45-degree line.
- Increases in the size of the area between a 45-degree line and the curve (Area A) indicate greater income inequality.
The tax distribution curve in Figure I shows the cumulative income tax shares of the same income groups.
- If everyone paid the same proportion of his income in taxes, the tax curve would lie perfectly on top of the income curve.
- If the poor paid a larger share of their income in taxes than the rich, the tax system would be regressive and the tax curve would lie above the income curve.
- However, since the rich pay a larger share of their income in taxes than the poor, the tax curve lies below the income curve.
In fact, the shape of these curves has changed over time. Although the total income of all groups has increased over time, the bottom half of taxpayers has experienced a decline in their income share . However, the bottom half of earners has experienced a larger decrease in their tax burden than in their income share, while the tax burden of the rich has increased by more than the increase in their income share. For instance, between 2001 and 2004:
- The income share of the top 1 percent of earners rose 8.6 percent, but their tax burden over the same period rose 8.9 percent.
- The income share of the bottom 50 percent of earners fell 2.8 percent, but their tax burden over the same period fell almost 17 percent.
Simply put, the tax system has grown more progressive over time.
Has the Cumulative Tax Burden Become More Progressive Relative to Income Shares? A final measure of progressivity is to use the income and tax curves to calculate a "progressivity index." The ratio, or index number, can be used to show how income tax reform affects the existing level of progressivity. Under a true flat income tax, the ratio of B to the sum of B and C would be zero, because B would disappear and the curves would lie on top of each other. This ratio would increase from zero and reach a maximum of 1 as the progressivity of the tax system increased.
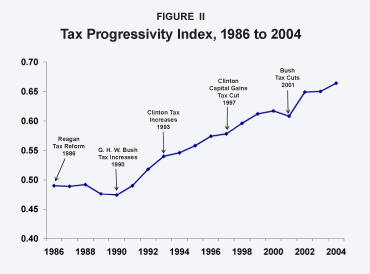
The tax burden index can be used to evaluate the progressivity of tax changes from 1986 to 2004, as shown in Figure II. (Data for tax changes before 1986 are not comparable.)
- The Reagan tax reforms of 1986 lowered marginal income tax rates, but raised capital gains tax rates to more than 28 percent (ordinary income tax rates). During this period, the progressivity index declined slightly from 0.490 in 1986 to 0.476 in 1989.
- From 1990 to 2000, during both the elder Bush and Clinton administrations, marginal income tax rates increased, but capital gains tax rates declined substantially in 1997; the progressivity index increased from 0.476 to 0.617.
- George W. Bush's tax reforms, which included reduced taxes on dividends and capital gains along with a small reduction in income tax rates, pushed the tax progressivity index up from 0.608 in 2001 to 0.664 in 2004.
Figure II shows that, from 1990 to 2000, the index increased along a stable, rising slope. When the Bush tax cuts were implemented during the economic slowdown of 2001, the tax progressivity index dipped for one year (common during recessionary times), then quickly returned to the original slope from 2002 to 2004. The overall increase in progressivity under the current Bush administration was due to changes in the tax burden distribution rather than changes in the income distribution, meaning the tax burden share of the wealthy increased significantly, while their income share increased only marginally.
Conclusion. Since the 2001 and 2003 Bush tax reforms, the share of total income received by the wealthy has increased; however, their share of the total tax burden has increased even more than their income share. In other words, Bush's reforms have helped mitigate the income gap between rich and poor by increasing the progressivity of the income tax system.
Michael D. Stroup is professor of economics and associate dean of the Nelson Rusche College of Business, Stephen F. Austin State University.