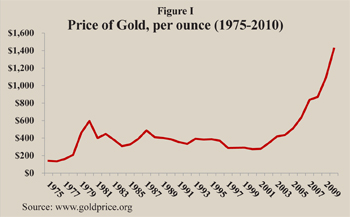
After Congress repealed the prohibition on owning gold in 1975, the market price shot up to $139 an ounce. Recent concern over the 2008 stock market crash, and doubts about the strength of the dollar have led many investors to buy gold. Gold is at its highest price in history, over $1,400 an ounce. [See Figure I.]
 Gold has many advantages: It tends to rise in price when other investments are falling; it protects against inflation; and it provides liquidity — it can be bought and sold easily. Gold investments can be used to diversify one’s portfolio. But does gold live up to its hype?
The Historic Rate of Return on Gold. Over the past 35 years, the average annual real (inflation–adjusted) rate of return on gold was 1.56 percent. However, it has fluctuated over shorter time periods. For instance:
- The largest gain for gold in one year was from 1978 to 1979, when the price doubled from $208 to $459, for a return of 98 percent.
- However, if the investor had bought gold that year and sold it in 1984, the five-year real rate of return would have been –14 percent.
- If the investor held the gold 10 years and sold it in 1989, the real rate of return would have been –6.5 percent.
Suppose an investor bought gold at a low point — $400 an ounce (unadjusted for inflation) at the end of 1981, when the price had fallen 39.1 percent over 12 months:
- If the investor had sold it for $390.90 an ounce in 1986, the five-year real rate of return would have been –4.1 percent.
- Over 10 years (to 1991), gold would have lost 5.2 percent on the initial investment.
Since 1998, the price of gold has soared at double-digit annual rates. The real rate of return of on gold purchased in 2009 at $1,087.50 and sold at the end of 2010 for $1,420.25 would have been 28.5 percent.
But over the long-term, gold investments have not done so well. For example:
- Gold purchased in 1975 at $129 an ounce would have sold at the end of 2010 for $1,420.25 for an annual real rate of return of 1.56 percent.
- By contrast, the real average annual rate of return for Standard & Poor’s 500 Composite Stock Index from 1975 to 2010 was nearly 8.4 percent.
The fluctuations in the returns to gold indicate that — like the stock market and real estate investments — gold is subject to “bubbles” of large and rapidly rising price increases, followed by unexpected declines. The danger is that many investors try to time the gold market, much like they do the stock market. They may “buy high” and “sell low,” resulting in a relatively low capital gain or even a loss.
 Investing in Gold versus Gold Mining. Investing in physical gold is very different from investing in companies that mine gold. Many assume that the returns are similar, yet there is more volatility in gold mining stocks and funds than in gold itself. Gold mining companies are also mining other metals, such as silver and copper. Thus, their profits are affected by other metals, as well as economic and geopolitical events in the countries where mines are located. The return on mining stocks and funds can be much higher than the return on gold bullion, but gold stocks are also subject to extreme peaks and valleys.
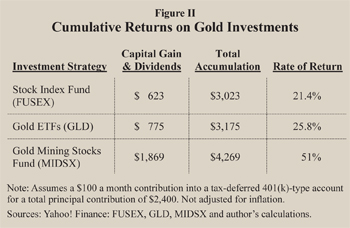
The 2008 Crash: A Time for Gold? During the stock market downturn of 2008, when gold prices were climbing and stock prices were falling, some investors pulled money out of stocks and switched to gold. But was it the best time to buy gold? Suppose that an individual made a $100-a-month contribution from January 2009 to December 2010, a total investment of $2,400, in one of the following funds [see Figure II]:
- A typical stock index fund (FUSEX) would have yielded capital gains and dividends of $623 for an annual rate of return of 21.4 percent.
- Gold in the form of shares (exchange-traded funds) sold on the NYSE (GLD) would have yielded capital gains of $775 for an annual gain of 25.8 percent.
- However, a gold mining fund (ex: MIDSX) would have yielded capital gains and dividends of $1,869, for an annual gain of 51 percent.
Thus, over the past two years, gold and gold-related stocks have generally outperformed the S&P 500. But it remains to be seen how long this growth will continue.
Gold Certificates versus Gold Coins. The gold prices quoted above are for gold bullion — bars of pure metal — sold on the commodities market. For security and easy trading, most investors purchase gold certificates instead of gold bullion. Many small investors, however, have purchased gold coins or medallions advertised as an investment. Coins issued by governments usually have a low legal tender value, such as $20, although the gold may be much more valuable. But when coins or privately minted medallions are sold at retail to the public, the mark-up in price can be high — often up to 100 percent.
Conclusion. Saving for retirement or other long-term goals means giving careful consideration to where money should be invested in order to receive the best possible returns. It is a hedge against inflation, but like any other investment gold should not be the only egg in the portfolio “basket.”
Pamela Villarreal is a senior fellow at the National Center for Policy Analysis.