1April 1995 marked the beginning of the fifth consecutive year of U.S. economic expansion. Gross domestic product (GDP) has grown an average of 3.1 percent annually since the trough of the 1990-91 recession, job growth in 1994 was the highest in a decade, unemployment is hovering around historic lows and the Consumer Price Index through 1995 registered its best five-year performance since the early 1960s.
"Views on the economy contrast so sharply that many people are seeking clarification of the average American worker's prospects."
Despite this good news, media reports often paint a bleak picture of the average American worker's prospects. Such reports cite studies that claim wages and incomes are falling, the pace of economic progress is slower than in the past and not everyone is sharing equally in the economy's gains. In light of these contrasting views on the economy, it is understandable that many people are seeking clarification.
[page]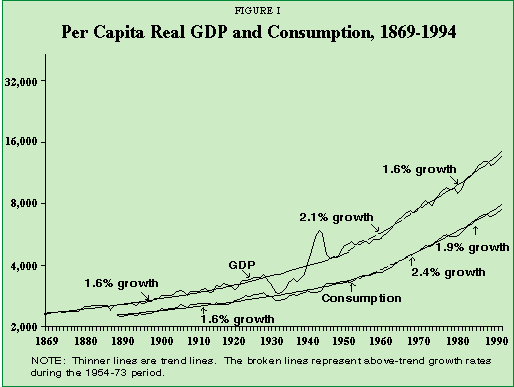
A thorough assessment of Americans' living standards must include a host of considerations that matter to people, such as leisure time, working conditions, life expectancy, pollution and crime.2 Clearly, people care about more than purely pecuniary considerations — wages, earnings, income. However, most recent studies have focused solely on monetary measures of Americans' well-being. In an attempt to sort through the conflicting information, this backgrounder focuses narrowly on some of the same money issues.
GDP Growth. GDP is the broadest and most longstanding of the aggregate output and income statistics.3 Much of the hand-wringing in the news media has been over the GDP's apparently lackluster performance over the past two decades, particularly compared with that of the 1950s and 1960s. Figure I shows per capita real GDP, the inflation-adjusted measure of the economy's output per person going back in time more than 100 years. As the figure shows:
- Per capita real GDP growth averaged 2.1 percent annually over the 1954-73 period, then slowed to 1.6 percent through 1989.4
- Although the half-point lower growth rate after 1973 represents a significant slowdown, the rate of growth during the 1954-73 period was quite high by historical standards.
- Over the 84 years from 1869 through 1953, per capita real GDP growth averaged 1.6 percent annually — a rate virtually identical to that of the 1974-89 period.5
"Arguably, the country's period of abnormal growth was the 1950s and 1960s."
More recently, GDP has been recovering from the 1990-91 recession. After stalling during 1989 and 1990 and subsequently turning down, per capita real GDP hit a trough in the fourth quarter of 1991.6 Since then, it has grown at an average annual rate of 2.5 percent (nearly 3 percent in 1994), well above the 1.6 percent growth needed to eventually restore the long-term trend.
In this light, America's recent economic progress does not appear to be below par. Arguably, the country's period of abnormal growth was the 1950s and 1960s, during which U. S. consumers sought to catch up from the scarcity of the Great Depression and World War II.7
"Four measures of economic progress that a lay audience would expect to be interchangable appear to diverge sharply."
Consumption. Presumably consumption, not production, is the end goal of economic activity, and it is from households' consumption experience that their impressions of living standards are formed. The data in Figure I show that consumer spending rose even faster (2.4 percent) than GDP during the 1950s and 1960s, as the vast military expenditures of World War II (and later the Korean War) were steadily reduced. With labor and industry freed from government control, factories turned to producing cars rather than tanks, and the share of output going to private consumer goods rose from 56 percent in 1953 to more than 63 percent by 1973. And that's not all. Researchers have found that about 23 percent of government nondefense spending is on goods and services that households value and consume. When this portion of government spending is added in, the effective total share of production going to consumers rose from 58 percent in 1953 to 68 percent by 1973.8
In effect, paring military expenditures from 13.2 percent of GDP in 1953 to 5.7 percent by 1973 boosted consumption growth by nearly 0.4 percentage points annually over those two decades. Clearly, this boost was transitory, but it nonetheless helped feed the consumer euphoria of the era. No such boost occurred subsequently, even when the Soviet Union dissolved. The end of the Cold War has resulted in paring military expenditures to 4.7 percent of GDP, but that represents a relatively small gain for consumers.9 Thus again the statistics highlight the uniqueness of the 1954-73 experience.
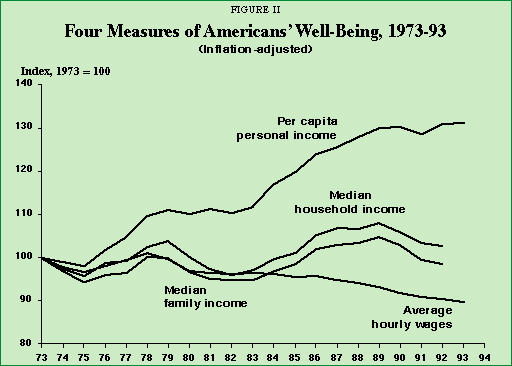
Other Measures of Well-Being. With these historical perspectives on GDP and consumption, America's more recent economic performance may look better. Still, skeptics cite other statistics that paint a bleak picture of the nation's recent economic progress. Figure II shows four measures of Americans' monetary well-being frequently cited by economic reports: per capita personal income, median family income, median household income and average hourly wages.10 One can preach four distinctly different sermons on Americans' recent economic progress, depending on the statistic wielded. For example, from 1974 through 1993:
- Per capita real personal income increased an average of 1.4 percent a year.
- Median family income increased an average of only one-tenth of a percentage point annually.
- Median household income fell about a tenth of a percentage point per year.
- Average wages fell by one-half a percentage point annually.
Thus four economic series that a lay audience would expect to be interchangeable appear to diverge sharply. Let's take a closer look.
[page]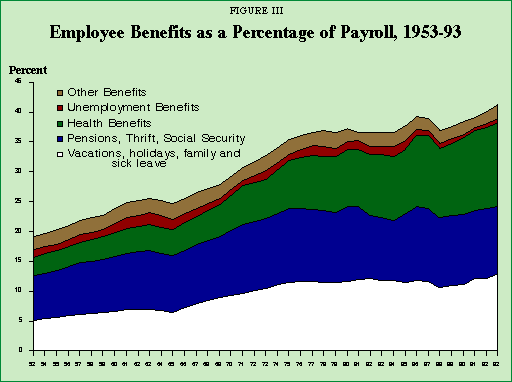
"Today's households nearly 15 percent smaller than they were in the 1970s — so household income is spread over fewer people."
Economic statistics gathered over a period of years can sometimes be misleading when they are used to gauge economic progress. We must interpret the economic variables we measure today differently from those of yesterday to account for changes in the population's size, work habits, social habits and age distribution, changes in the way we are paid and in the goods we produce. We must allow for the marked decline in size of the average U.S. family over the past 20 years, the increasing number of people in the labor force, shorter average workweek, younger labor force, higher employee benefits and so on. Such changes distort year-to-year comparisons of virtually every aggregate statistic, making comparisons difficult and inviting many different conclusions from the data. It is important to sort through this economic puzzle to determine what's really happening to Americans' monetary well-being.
"Employees benefits have grown from 20 of payroll in 1953 to more than 41 percent today."
Median Income. For the purpose of comparing today with yesterday, two of the economic aggregates most severely tainted by hidden biases are median household income and median family income. Today's households are nearly 15 percent smaller than they were in the 1970s — the average household size was 3.01 persons in 1973 vs. 2.63 today — and therefore household income is spread over fewer people.11 Comparing household income statistics over the past 20 years thus significantly understates the true income gains for comparable households. Similarly, the median family income statistics for yesterday's Brady Bunch cannot be accurately compared with those of today's Murphy Brown.
Total Compensation. Also severely tainted are the simple wage data, the biggest bias being that they ignore employee benefits.12 Employee benefits have grown from only 20 percent of payroll in 1953 to more than 41 percent today. As Figure III shows:
- The proportion of payroll devoted to health benefits rose from 3 percent in 1953 to more than 14 percent recently.
- Retirement and savings benefits went from 5 percent of payroll in 1953 to 13 percent in 1993.
- Payments for time not worked, including vacations and holidays, sick leave, military leave and family leave, grew from 7.5 percent to 11 percent of payroll over the same period.
Benefits are a form of employee compensation. Like wages, workers value benefits and even bargain for them. Indeed, since benefits are often untaxed (or are taxed at a substantially lower rate than wage income), employees may be willing to give up more than a dollar in wage income to receive a dollar's worth of benefits. This means, in terms of the data, that the rise in employee benefits may have caused a more-than-equal decline in wages, again distorting the armchair analyst's ability to gauge well-being by looking at the wage data alone.
"From 1974 to 1993 real wages fell about half a percentage point per year, but total compensation rose about half a percentage point per year."
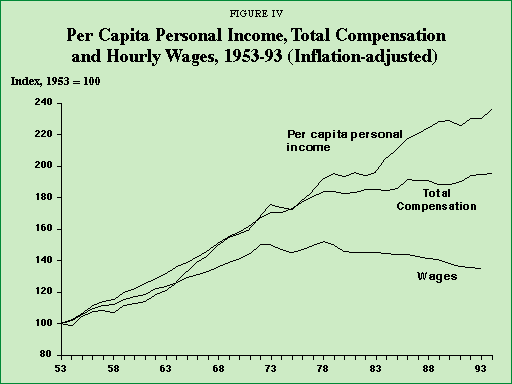
Personal Income. Once employee benefits are added to the raw wage data, the story of workers' compensation becomes a bit more optimistic, as shown in Figure IV. As mentioned earlier, from 1974 to 1993 real wages fell about half a percentage point a year. However, real total compensation, which includes wages and benefits, rose about half a percentage point a year. Add to this the fact that today's labor force is roughly two years younger than that of two decades ago, and the wage gain figures look even less subpar.13
A better gauge of economic well-being is per capita real personal income. Roughly speaking, per capita real personal income is the inflation-adjusted sum of all income-related receipts and disbursements — wages, rents, interest, profits and government transfers, less taxes — per person in society. It lacks the problems of household and family income because the economic unit is of a fixed size (one person), and it lacks the problems of the wage data because it measures more than wage income.
Personal income is essentially the payment side of GDP with allowances for depreciation, and it grows at roughly the same rate as GDP. For example, per capita real personal income grew at an annual rate of 1.65 percent over the 1974-89 period, which is virtually identical to the 1.64 percent growth in per capita real GDP.14
"Over the past two decades the average workweek has declined by 2.4 hours, and workers have added seven days of vacation and holidays annually."
However, per capita real personal income also hides distortions, such as those stemming from changes in labor force participation rate or annual hours worked. Over the past two decades the average workweek has declined by 2.4 hours, and American workers have added seven days of vacations and holidays annually, yielding roughly a 180-hour reduction in average time worked per year.15 Thus Americans have taken a portion of their progress as leisure rather than income, lowering the income and GDP growth numbers from what they otherwise could have been.
[page]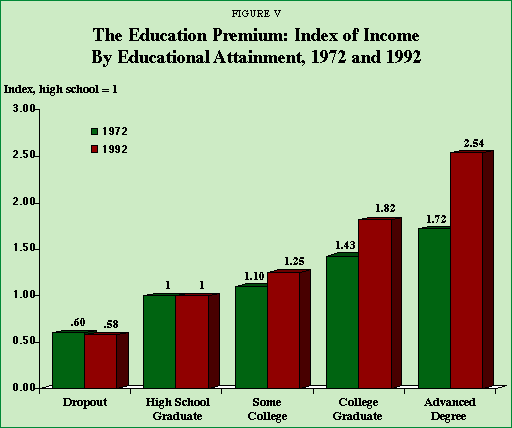
One major issue remains: the sharply slower growth in total employee compensation compared with personal income. From 1974 to 1993, the gap between income and compensation widened as total compensation grew at a 0.7 percent rate, compared to 1.4 percent for per capita personal income (see Figure IV). It should be noted that data on wages and compensation pertain only to production and nonsupervisory workers, about 63 percent of the work force, whereas the income data cover all workers. The widening gap tells us that the share of income paid for production and nonsupervisory work is declining, while the share paid to professionals, supervisors, managers and owners is growing.
One explanation for the widening gap appears to be the rising return to human capital. In an information- and service-oriented economy, business capital encompasses not just physical plant and machinery but, to an increasing degree, intellectual capital as well.16 As Figure V shows, the workers reaping most of the economic gains have been those at the higher end of the education spectrum. The income premium to education is substantial and has grown markedly over the past two decades. In 1992, college graduates made an average of 82 percent more than high school graduates, up from only 43 percent more in 1972. The really big returns to education these days come with advanced degrees.
- In 1972, people with advanced degrees earned 72 percent more than high school graduates.
- By 1992, those with graduate degrees made 2.5 times more than high school graduates.
- Today, high school dropouts earn scarcely half as much as high school grads, and the gap is widening.
"By 1992, people with graduate degrees made 2.5 time more than high school graduates."
In the public arena, reports can produce shock waves long before the facts are determined. Recent economic reports have been no exception. Economic doomsday stories have proliferated from superficial analyses based on aggregated wage and income statistics. A careful examination of the data that takes into account just a few of the surrounding factors — the increase in employee benefits, the decline in median household or family size, the shortening in the average workweek and so on — brightens the picture of Americans' progress in living standards.17 Indeed, from the perspective of the two broadest and most long-term economic aggregates — per capita real GDP and consumption — Americans' recent gains are on par with those garnered historically. There is little cause for alarm.
"From the perspective of per capita real GDP and consumption, recent income gains are on par with historical gains."
Aggregate statistics, of course, reflect averages. Some people have gained more, others less. But one thing can be said conclusively: the income of the well-educated has grown substantially faster than that of the less-educated over the past two decades. Clearly, education is one of the most effective tools Americans can use to increase their income potential.
[page]- The views in this paper are not necessarily those of the Federal Reserve Bank of Dallas or the Federal Reserve System.
- For a discussion of these aspects, see W. Michael Cox and Richard Alm, "These Are the Good Old Days: A Report on U.S. Living Standards," Annual Report, Federal Reserve Bank of Dallas, 1994, pp. 2-15.
- In 1991, the Department of Commerce switched from gross national product (GNP) to GDP as its generally preferred measure of aggregate economic activity. Figure I uses GNP data since GDP data are not available before 1947. Because the difference between the GNP and GDP series is negligible (less than one-tenth of 1 percent on average), the distinction is unimportant here and the term GDP will be used henceforth.
- The average growth rates of per capita real GDP during the periods 1869-1953, 1954-73 and 1974-89 were estimated by regressing the log of per capita real GDP on a constant and time for each of the three separate periods. The same is true for consumption, beginning in 1889. Available GDP data begin in 1869, and consumption and government purchases data begin in 1889. The years 1953, 1973 and 1989 were chosen because they represent business-cycle peaks.
- More precisely, per capita real GDP growth averaged 1.61 percent, 2.08 percent and 1.64 percent, respectively, over the three successive periods. Thus growth during the 1974-89 period was actually slightly higher than that during 1869-1953.
- Per capita real GDP hit a trough later than the official GDP trough, as the recovery's initial GDP gains fell short of simple population growth.
- Mark A. Wynne, "The Comparative Growth Performance of the U.S. Economy in the Postwar Period," Economic Review, First Quarter 1992, Federal Reserve Bank of Dallas, pp. 1-16; and "How Serious Is the Productivity Problem in the U.S.?" Southwest Economy, May/June 1992, Federal Reserve Bank of Dallas, pp. 1-3.
- Roger C. Kormendi, "Government Debt, Government Spending and Private Behavior," American Economic Review, Vol. 73, December 1983, pp. 994-1010; and David Alan Aschauer, "Fiscal Policy and Aggregate Demand," American Economic Review, Vol. 75, March 1985, pp. 117-27. The government purchases many types of items, from tanks to school lunches. Clearly, some goods provided publicly — food stamps, rent subsidies, school lunches, Medicare and so on — are of a consumer nature and may be valued by households as equivalent to those they could buy privately. Following the research of Kormendi and Aschauer, we assume that approximately 23 percent of government nondefense purchases are viewed by households as equivalent to their own private consumption.
- Growth in total real consumption averaged 1.6 percent annually during the 1889-1953 period and 1.9 percent during the 1974-89 period, then jumped to more than 2.4 percent during 1954-73.
- Each of the series cited henceforth — per capita personal income, median household income, median family income, average hourly wages and total compensation — are deflated using the CPI-UX1 consumer price index.
- More specifically, the data show that in 1973 the average household had 1.34 adults (members age 18 or older) in the labor force, 0.67 adults not participating in the labor force and one child. For 1993, these numbers are 1.34, 0.60 and 0.69, respectively.
- Another problem with the wage data is that they do not measure take-home pay, as affected by tax rates and transfer payments. Adjustment for these factors is beyond the scope of this study.
- As the age of the workforce declines, so do the level of experience, income and wages, yet the aggregate measures conceal this change. We make no attempt to adjust for the age factor here.
- More precisely, per capita real GDP growth averaged 1.61 percent, 2.08 percent and 1.64 percent, respectively, over the three successive periods. Thus growth during the 1974-89 period was actually slightly higher than during 1869-1953.
- W. Michael Cox and Richard Alm, "These Are the Good Old Days: A Report on U.S. Living Standards," pp. 2-15.
- See Cox and Alm, "The Service Sector: Give It Some Respect," pp. 3-22, for a broad examination of the growth of the service sector and what it portends.
- Two other major income data adjustments needed are for taxes (and transfers) and improvements in product quality. The Department of Labor recently began an extensive study to determine the extent (if any) to which price indexes are overstated due to an under-recognition of the gains in product quality. Overstatement of inflation would be tantamount to understatement of the gains in virtually every series on Americans' monetary well-being, including real GDP, consumption, wages, compensation and income.