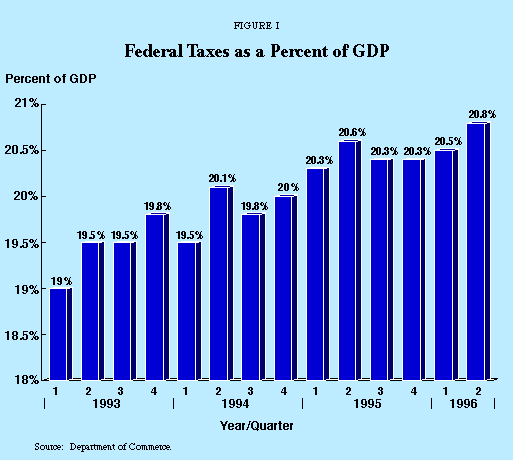
Federal taxes have reached their highest level in history. As of the second quarter of 1996, these taxes consume 20.8 percent of annual U.S. gross domestic product (GDP).1 [See Figure I .] Out of $7,547.6 billion in national output, the federal government claims $1,572.5 billion.
Annual GDP data go back to 1929. In only four of those 67 years were federal revenues as high as 20.5 percent of GDP, and three were war years.
- Revenues reached 20.5 percent of GDP in 1943 at the peak of World War II.
- They reached 20.6 percent in the first quarter of 1951 during the Korean War.
- They reached 20.7 percent in the second quarter of 1969, when the Vietnam War surtax was in effect.
"Federal taxes are at their highest level in history."
The only other time federal revenues attained that level was in 1981, when they reached 20.7 percent of GDP in the first half of the year due to double-digit inflation that pushed people into higher tax brackets.
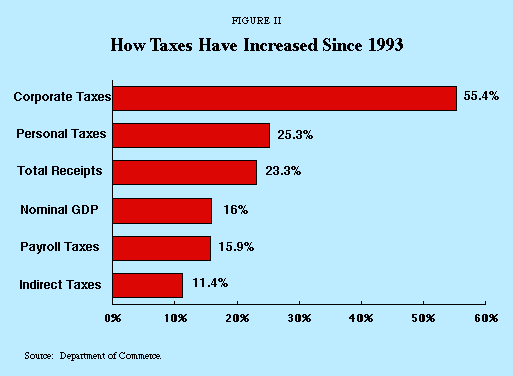
Figure II shows how the tax burden has increased over the last three years:
- Taxes on corporations have increased 55.4 percent, or 3.5 times faster than GDP.
- Personal income taxes have risen 24.3 percent, or 1.6 times faster than GDP.
Had corporate and individual income taxes increased only as fast as GDP:
- Corporate taxes would have equaled $138 billion last year rather than the actual figure of $184 billion.
- Individual income taxes would have grown to $555 billion instead of $598 billion.
"Even without legislated tax increases, taxes must be cut periodically to keep the burden from rising."
The vast increase in federal taxes is the result of two factors: 1) the 1990 and 1993 tax increases and 2) the effect of progressive tax rates. The latter may be more important. While tax rates are indexed to inflation, they are not adjusted for real growth in the economy. This means that even without legislated tax increases, taxes must be cut periodically just to keep the tax burden from rising. The wage base for Social Security taxes increases annually and, as workers manage to achieve some growth in their real incomes, they get pushed into higher tax brackets. As a recent Congressional Budget Office (CBO) report put it, "The GDP share [of taxes] creeps up over time as rising real incomes cause a larger fraction of income to be taxed in higher tax brackets."2 For example, a single worker with a taxable income of just $24,000, facing a 15 percent federal income tax, will pay 28 percent on his or her next dollar of income. With Social Security taxes on top of that on all earnings up to $62,700, workers with incomes between $20,000 and $60,000 are among the most heavily taxed people in America.
[page]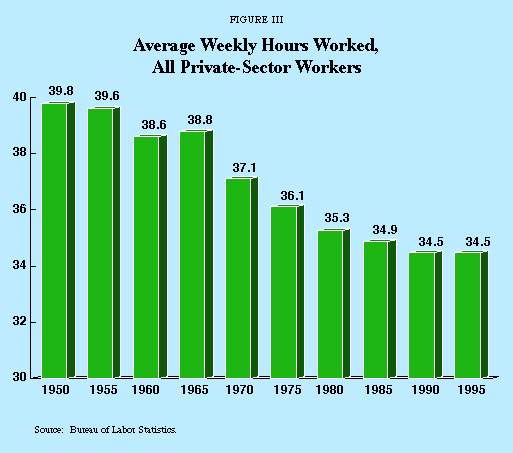
"Historically, tax levels even close to these have triggered major tax cuts."
Historically, tax levels even close to these have triggered major tax cuts. Now Republican presidential candidate Bob Dole has proposed an across-the-board reduction of 15 percent in the individual income tax, as well as a cut in the capital gains tax from 28 percent to 14 percent. The purpose, Dole said, is to "repeal the Clinton tax hike on the middle class" and to "return total taxes to where they were when Ronald Reagan left office."
Although President Clinton proclaimed in his State of the Union address that the nation's economy is in the best condition in the last 30 years, overall economic growth has in fact been weak. Further, incomes today, whether measured by weekly earnings or by median family income, are lower than they were in the 1980s.
Stimulating the Economy. The main goal of the Dole economic plan is to increase the anemic rate of growth of the U.S. economy. From the fourth quarter of 1992 through the second quarter of 1996, real GDP has increased by an average of just 2.4 percent per year. Even the growth rate for 1996, now estimated to reach 2.6 percent to 3 percent, is still well below the economy's historic growth rate of 3.1 percent.
Dole has not released estimates of what effect his plan – which also includes cutting the capital gains tax rate in half – would have on economic growth. However, based on the published revenue estimates, the Tax Foundation has estimated that the impact of the plan would be an increase in GDP of 0.1 percent the first year, rising to 0.8 percent in the third year as the tax cut is phased in, and then falling to 0.3 percent in the sixth year.3
Some critics have attacked as implausible the very idea that growth can be raised at all. For example, an article in the August 12 issue of the New Yorker maintained that the economy cannot grow more than 2.5 percent per year without reigniting inflation. Faster growth, the article said, would lower unemployment, and with the economy already at full employment, the added demand for labor would only increase wages and prices.4
"We are nowhere near full employment, even with an August unemployment rate of 5.1 percent."
This analysis is faulty on several counts. First, we are nowhere near full employment, even with an August unemployment rate of 5.1 percent. In recent years, some economists have insisted that the "natural" rate of unemployment is 6 percent, and that a drop below that rate will trigger inflation. Historically, however, 4 percent unemployment has been considered "full employment" and in the 1950s this rate was achieved without inflation.
Second, the unemployment rate does not fully take into account part-time workers who would prefer to work full-time, and it does not count those who have given up hope of finding a job. In July, according to the Bureau of Labor Statistics, there were 9.6 million people in the two categories.
- 4.4 million held part-time jobs due to lack of full-time work.
- 5.2 million had dropped out of the labor force altogether.
Further, there is vast room for expansion of the labor supply through increased hours. As Figure III illustrates, average weekly hours for all private-sector workers have fallen sharply over the last 30 years. This is partly due to the rise of part-time employment, but also due to fewer work hours for those nominally employed full-time. In July, for example, 9.7 million full-time employees worked fewer than 35 hours per week.
In short, there is good reason to believe that the labor supply could easily expand enough to raise the growth rate well above current levels.
Increasing Incomes. The Clinton administration maintains that a 2.2 percent growth rate is the best we can do at present.5 Further, it says that with unemployment now in the low 5 percent range, any increase in growth would push up wages and thus trigger inflation and an increase in interest rates by the Federal Reserve.
"Incomes today are lower than they were in the 1980s."
It is true that faster growth would raise wages. But in 1995, according to the Bureau of Labor Statistics:
- Real average weekly wages were just 75 cents higher than in 1992.
- Real average earnings were $255.29 per week, or 5.5 percent lower than during the Reagan administration, when they averaged more than $270 per week.
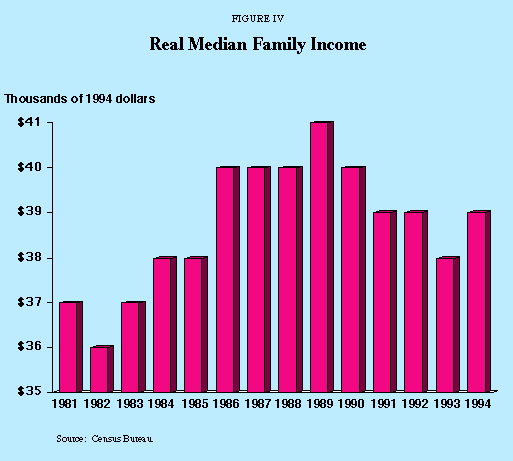
Declining real wages, in turn, have led to a decline in living standards. According to the Census Bureau, real median family income has fallen from $40,890 in 1989 to $38,782 in 1994, the latest year available. [See Figure IV.] By contrast, during the Reagan administration, real median family income rose every year after the end of the recession.6
The Senate Budget Committee reports, as shown in Figure V, that the median family now pays 25 percent of its income in federal taxes, compared to 12 to 13 percent in the early 1960s. With this increased tax burden, many families are having trouble making ends meet, saving for college and retirement and living as well as their parents did.
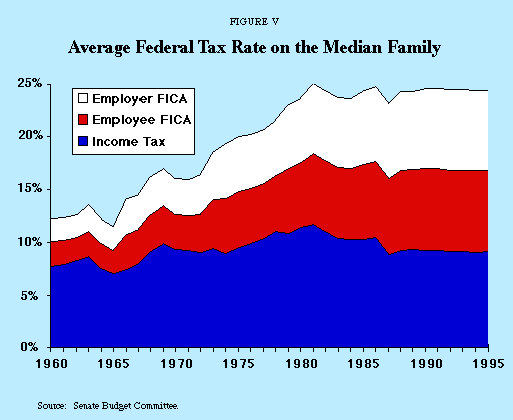
"Real median family income has fallen from $40,890 in 1989 to $38,782 in 1994."
In short, workers need a pay raise, and increasing the demand for labor is one way to provide it. Of course, keeping inflation under control is also an essential goal. But nothing in economic theory or economic experience demonstrates that rising real incomes are inconsistent with price stability. Moreover, Federal Reserve Chairman Alan Greenspan and other Fed officials have repeatedly stated that monetary policy would not stand in the way of balanced higher growth.
"The median family now pays 25 percent of its income in federal taxes."
The American Bankers Association recently reported that 3.66 percent of all credit card holders were behind in their payments in the second quarter of 1996. This is the highest figure in 22 years and well above the level during the 1990-91 recession. At the same time, consumer debt has hit an all-time high – over $1 trillion – a 44 percent increase during the Clinton administration. With debt at such a high level, even a small rise in short-term interest rates could depress consumer spending very quickly.
While household assets also have risen due to the run-up in the stock market, much of the gain is locked into retirement accounts such as 401(k) plans and is difficult to tap in a crunch. Generally, Federal law requires financial institutions to withhold 20 percent of assets withdrawn from a retirement account.
Yet for many consumers the crunch is already here. According to the American Bankruptcy Institute, personal bankruptcies hit an all-time high in 1995 at 874,642 filings. And the trend suggests that this year's figure will be even higher. In just the first quarter, another 252,761 individuals filed for bankruptcy. If this trend continues for the rest of the year, more than one million people will go bankrupt in 1996.
While a 15 percent tax rate reduction may not be enough to solve the problems of declining real incomes, stagnant wages and soaring debt burdens, it will put more money into people's pockets. Therefore it will unambiguously raise disposable incomes and give people more resources with which to service their debts and avoid bankruptcy.
[page]"The Reagan tax rate cuts had nothing to do with the budget deficits during the 1980s; instead, spending exploded."
Opponents of a tax cut now contend that Dole is repeating the mistakes of the Reagan administration in the 1980s, when cutting taxes led to economic disaster. However, when asked for evidence that the American people suffered from Reagan's tax cut, critics have none to offer except the increase in the federal budget deficits during the 1980s. In fact, the Reagan tax rate cut had nothing whatsoever to do with the increase in deficits in the 1980s. On average, federal receipts as a share of GDP were higher in the 1980s than in the 1970s – 19.0 percent of GDP versus 18.5 percent. What caused the deficit is that spending exploded. Although Reagan was often attacked for "slashing" the budget, outlays as a share of GDP actually rose from 20.6 percent of GDP in the 1970s to 23.1 percent in the 1980s.
On every other score, the 1980s were a smashing economic success. The country entered the decade with the annual inflation rate at 12.5 percent and the prime interest rate at 21 percent. Real income of the median family had fallen by $3,000 between 1973 and 1981. The sharp but brief 1981-82 recession effectively broke the back of inflation, setting the stage for the longest peacetime economic expansion in our nation's history – 92 months of continuous real growth.
- From 1982 to 1989, real growth averaged 3.9 percent per year.
- Real median family income increased by $4,564, or 12 percent, between 1982 and 1989.
- By contrast, real family income has fallen by $2,108, or 5.2 percent, in the 1990s.
Opponents of an across-the-board tax rate cut argue that it would either require massive spending cuts or lead to higher deficits. Liberals contend that the necessary spending cuts would be so large that they would devastate essential programs. While conservatives have no objection to cutting spending, many worry that it will be politically difficult to do so because the tax cut will widen the deficit. Both arguments implicitly exaggerate the size of both the tax cut and the needed spending cuts, making them appear much larger than they actually are.
Revenue Loss: 1 Percent of GDP. The "huge" tax cut that both liberals and many conservatives fear would emaciate the federal government would lower revenues by only 4 percent over six years. With GDP expected to total $54 trillion between 1997 and 2002, the $548 billion tax cut proposed by Dole amounts to just 1 percent of GDP, or 0.5 percent less than federal revenues have risen just since early 1993.
Similarly, the cuts in projected spending necessary to pay for the Dole plan are modest, only 5.6 percent lower than what is now projected. But even this figure is overstated because congressional Republicans have already passed a budget resolution containing $400 billion in spending reductions. All Dole is really proposing is taking another $217 billion, or 2 percent, out of expected future spending. This would pay for the tax cut and balance the budget in 2002 without the necessity of touching Social Security or Medicare.
"With the spending 'cuts' necessary to pay for the Dole tax cuts, federal spending would increase 14 percent from 1996 to 2002."
Paying for the Tax Cut by Holding Down Spending Increases. Although many people are legitimately concerned about the deficit, arguments about government spending actually are about cutting planned increases in federal spending, not about reducing the current level of federal spending.
- Federal spending in 1996 is set at $1.566 trillion.
- Federal spending in 2002, without any reductions in planned increases, is expected to be $1.968 trillion, or an increase of 26 percent from 1996.
- With the spending "cuts" necessary to pay for the Dole tax cut proposal, federal spending in 2002 would be $1.783 trillion, or an increase of 14 percent from 1996.
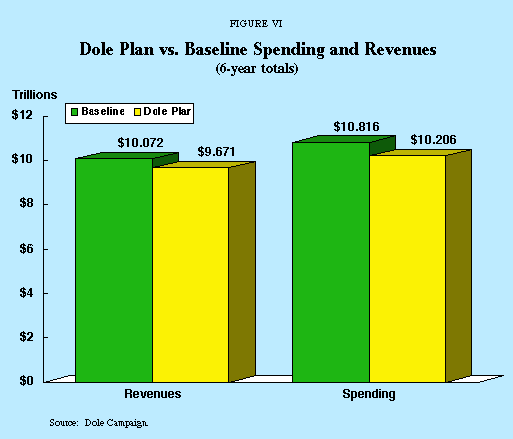
The truth of the matter, then, is that the Dole plan is quite modest. As Figure VI indicates:
- Over the period from 1997 through 2002, the federal government expects to collect more than $10 trillion and spend almost $11 trillion.
- Enactment of the tax cuts proposed in the Dole plan would only lower revenues to slightly less than $10 trillion and spending to just over $10 trillion.
Paying for the Tax Cut through Higher Economic Growth. If a tax cut produces economic growth, an important consideration is the amount of new tax revenue the growth produces for the government, or as economists term it, the "feedback" effect. There is virtual consensus spanning the political spectrum that substantial revenue feedback would result from tax cuts. And the impact on growth need not be large for there to be large revenue effects. According to a table in the federal budget for fiscal year 1997:7
- A sustained increase in growth of 1 percent per year would increase federal revenues cumulatively by $420 billion between 1996 and 2002, while lowering spending by $183 billion.
- Thus even an increase in growth of 0.1 percent per year would lower the deficit by some $60 billion over seven years.
"The Dole plan would lower revenues to slightly less than $10 trillion and spendin to just over $10 trillion over six years."
It is certainly not the case, as some critics continue to charge, that the Reagan administration predicted that its tax cut in the 1980s would pay for itself. Every official document ever produced by the Reagan administration showed large revenue losses from its tax cut.8 But the Reagan tax cut had feedback effects. In testimony before the Joint Economic Committee on February 23, 1981, Professor Richard Musgrave of Harvard estimated that 30 percent to 35 percent of the revenue loss might be recouped based on standard Keynesian assumptions. Later, Lawrence Lindsey, then also a professor at Harvard and now a member of the Board of Governors of the Federal Reserve System, calculated that by 1985, 70 percent of the direct revenue loss had in fact been recovered through higher growth and behavioral changes.9
No one has ever seriously argued that an across-the-board tax rate reduction, such as that enacted in 1981, would recoup 100 percent of lost revenue through higher growth. What tax cut advocates have said is that some tax cuts, such as a cut in the capital gains tax, might well pay for themselves. They also have said that tax rate reductions do not lose as much revenue as static revenue loss estimates predict. This is, in fact, the view generally accepted by economists. For example, a 1978 CBO report estimated that:
- A one-third reduction in income tax rates would produce a static revenue loss of $21 billion the first year, but a net cost of just $16 billion.
- By the fifth year after enactment, the static cost had risen to $164.6 billion, but the net cost was just $79.1 billion.
"Tax cut advocates have said some tax cuts, such as a cut in the capital gains tax, might well pay for themselves."
In other words, even the CBO, then headed by Alice Rivlin, who was the president's budget director until earlier this year, thought that this proposal would produce 24 percent revenue feedback the first year, rising to 52 percent after five years.10 [See the Sidebar on Dynamic and Static Scoring.]
Another CBO report reviewed the experience of the Kennedy administration tax cut in the early 1960s. The CBO concluded that:
- The direct effect of the tax cut was to reduce federal revenues by $12 billion per year.
- However, because of the higher growth resulting from the tax cut, $3 billion to $9 billion of the direct cost was recouped after two years.
- Thus the feedback from the Kennedy tax cut was between 25 percent and 75 percent.11
In 1982, the CBO discussed in detail the dynamic effect of tax cuts on revenues. In How Changes in Fiscal Policy Affect the Budget: The Feedback Issue, the CBO estimated the effect of an across-the-board tax rate reduction and concluded:
Generally, the figures suggest that between roughly one-tenth and two-tenths of the static revenue loss from the tax cut may be recouped through induced increases in revenues during the first fiscal year after the tax change, and that roughly one-third to one-half of the static revenue loss may be recovered in later years.12
Lawrence Chimerine, former chief economist for both Chase Econometrics and the WEFA Group and now chief economist for the liberal Economic Strategy Institute, conceded that "credible evidence overwhelmingly indicates that revenue feedback from tax cuts" may be as high as 35 percent.13
[page]When state and local government receipts are added to federal receipts, total taxes as a share of GDP were the highest in U.S. history in 1995 – 31.3 percent. At the height of World War II in 1945, total taxes consumed only 25 percent of GDP.
In the first three years of the Clinton administration, Americans paid $151.1 billion more in federal taxes than if federal receipts had remained at their 1992 level of 19.2 percent of GDP. An across-the-board 15 percent reduction in individual income tax rates would lower federal receipts as a share of GDP to what they were in 1992.
"Ultimately, tax reduction must be accompanied by spending reduction."
The 15 percent tax rate reduction proposed by Bob Dole would stimulate economic growth and provide some relief to taxpayers, but it would not solve the tax problem. It is just a down payment. To bring federal taxes to a tolerable level will require not just tax reform, but a complete overhaul of the federal budget as well. Ultimately, tax reduction must be accompanied by spending reduction because it will be impossible to lower taxes as much as needed while federal spending consumes over 20 percent of our national output.
NOTE: Nothing written here should be construed as necessarily reflecting the views of the National Center for Policy Analysis or as an attempt to aid or hinder the passage of any bill before Congress.
[page]- These data come from the National Income and Product Accounts of the United States, which more accurately represent the true picture of taxation than does the federal budget. They are published in the Economic Report of the President, the Survey of Current Business and elsewhere. The principal differences between these figures and the more common figures in the budget are that the NIPA data are compiled on a calendar-year basis, rather than a fiscal-year basis, and they include certain federal receipts that are included in the budget not as receipts but as negative spending. The most important of these receipts are government employee contributions for retirement and Medicare Part B premiums. For an explanation, see Budget of the United States Government, Fiscal Year 1996: Analytical Perspectives (Washington: U.S. Government Printing Office, 1995), pp. 267-70. This chapter did not appear in the FY 1997 budget.
- Congressional Budget Office, The Economic and Budget Outlook: Fiscal Years 1997-2006 (Washington: U.S. Government Printing Office, 1996), p. 39.
- J.D. Foster, "Analysis of the Dole Economic Plan," Tax Foundation Special Report No. 62, August 1996, p. 3.
- John Cassidy, "The Growth Fallacy," New Yorker, August 12, 1996, pp. 34-37.
- Economic Report of the President (Washington: U.S. Government Printing Office, 1996), ch. 2.
- Bureau of the Census, Income, Poverty, and Valuation of Non-cash Benefits: 1994 (Washington: U.S. Government Printing Office, 1995), p. B-8.
- Budget of the United States Government, Fiscal Year 1997: Analytical Perspectives (Washington: U.S. Government Printing Office, 1996), p. 13. The table actually shows the impact on the budget of lower GDP, but the numbers are symmetrical; that is, the magnitude of the effects are the same regardless of the direction of the change.
- For the administration estimate, see A Program for Economic Recovery (Washington: The White House, February 18, 1981), p. 7. The CBO estimate may be found in Congressional Budget Office, Economic Policy and the Outlook for the Economy (Washington: U.S. Government Printing Office, March 1981), p. 47.
- Lawrence B. Lindsey, The Growth Experiment (New York: Basic Books, 1990), pp. 74-76.
- Congressional Budget Office, An Analysis of the Roth-Kemp Tax Cut Proposal (Washington: U.S. Government Printing Office, 1978), p. 45.
- Congressional Budget Office, Understanding Fiscal Policy (Washington: U.S. Government Printing Office, 1978), p. 25.
- Congressional Budget Office, How Changes in Fiscal Policy Affect the Budget: The Feedback Issue (Washington: U.S. Government Printing Office, 1982), p. 16.
- Lawrence Chimerine, "Return of the Supply-Siders," Washington Post, July 23, 1996