Our country is in far worse fiscal shape than its $14 trillion — and rapidly growing — official debt suggests. Indeed, that figure measures just a small portion of the government’s total liabilities. It leaves out, for example, the obligation to pay hundreds of trillions of dollars in Social Security and Medicare benefits to today’s and tomorrow’s elderly.
Why is that? If the unofficial obligations, such as Social Security and Medicare, are as real as the official ones, why are they not also called official debt?
A Tax or Borrowing? The answer is there is no answer, and because there is no answer, the deficit is not well defined. The government has a choice with respect to every dollar it takes in from the private sector whether to call that dollar a tax or call it a dollar of borrowing, which in turn affects the official debt count.
Take Joe, who hands the government $5,000 this year and $3,000 next year. Suppose the interest rate on one-year Treasuries is 1 percent. Uncle Sam could say, “I’m taxing Joe $5,000 this year and $3,000 next year.” Or Uncle Sam could say, “I’m borrowing $4,000 from Joe this year and taxing him $1,000 this year. And next year, I’m paying him $4,040 in principal plus interest and taxing him $7,040.” Note that whether Sam uses the first or second label (choice of words), he collects $5,000 from Joe this year and $3,000 ($7,040 minus $4,040) next year. Using the first set of words, rather than the second, however, means this year’s deficit and the debt at the beginning of next year are $4,000 smaller.
Nothing in economic theory pins down whether to use the first or second set of words or, for that matter, a zillion other sets of words. For example, Sam could say, “I’m taxing Joe $10,000 this year and making a loan to Joe this year of $5,000. And next year I’m receiving $5,050 from Joe in principal plus interest and making a transfer payment to Joe of $2,050.”
If Sam uses this third set of words rather than the first, Sam still receives $5,000 from Joe this year and $3,000 from Joe next year, but Sam reports a deficit this year and a debt at the beginning of next year that is $5,000 smaller.
Economics’ Labeling Problem. These examples illustrate economics’ labeling problem. Economics, at its core, is not a set of opinions about the economy related through media to the public by people with doctoral degrees. At its core, economics consists of a body of mathematical models that provide insight into how the United States and other economies actually operate.
The vast majority of these mathematical models assume that people are rational, which implies, among other things, that they are not fooled by language. Economists call such models neoclassical models, meaning new classical models. The terms was coined in 1900 by Thorstein Veblen to distinguish models in which the agents acted in logically consistent ways from those in which agents acted, well, nuts. Nuts, in this context, does not mean they shoot each other or run around in circles. It means they do not process information correctly and do not look out for their self-interest consistently.
Before 1900, economists rarely used math to express the way they thought people would behave, economically speaking. Once economists began to use math, they quickly realized that if you permit economic agents to be irrational, you cannot learn anything from your model. There are countless ways that people can be nuts and if you want your model to predict X, all you need to do is assume your model’s agents are nuts in a way that produces X. For example, to understand why the price of bananas observed in the market is really high, you could create a model in which people detest eating bananas, but accidentally spend all their income on bananas.
Instead of studying models where anything goes, mathematically-oriented economists began developing and analyzing models in which agents do not make systematic mistakes. This includes not being fooled by the government’s choice of labels. That is, in neoclassical models, if the government uses a given policy but describes it with one set of words rather than another, the economy’s response to that policy will not be any different.
The fact that neoclassical economics assumes rationality does not mean people are, in fact, rational. Indeed, there is overwhelming evidence that people are not. But economists have assumed that agents are, at least on average, rational.
Neoclassical Economics and the Deficit. Neoclassical economics doesn’t just tell us the deficit and the debt are not well defined. It also tells us that tax revenue, expenditures on transfer payments, disposable income, private saving, personal saving, private wealth, and government wealth and all measures in search of meaning. The fact that these measures are used routinely all over the world doesn’t change this fact. With each alternative set of fiscal labels, each of these variables takes on a different value. Hence, in economics, we have a terrible problem. We are using inherently meaningless measures of fiscal policy to assess the fiscal policy we’re actually running. The consequence of driving in New York with a map of Los Angeles is that we’re getting seriously lost.
Values for these variables are carefully assembled each year by the U.S. Department of Commerce as part of the National Income and Product Accounts. This has led economists, policymakers and the public to take these numbers seriously and, as a consequence, produce all manner of analyses and policies based on inherently meaningless data.
To understand why neoclassical economics steers clear of these numbers, think about things from Joe’s perspective. Joe knows he is handing over $5,000 now and $3,000 in a year. And since Joe is rational, he does not care what words the government uses in taking these sums from him.
Now, in considering the above, you, the reader, might say, “Well, the example you present is one with no uncertainty, no economic distortions, no erratic changes in future government behavior, no information problems and none of the many other things that make the real world highly complex.”
That is all true. But those considerations are completely irrelevant to the labeling problem. Economics’ labeling problem holds in all neoclassical models.1
There is an easy way to see this. Write down any neoclassical model and there will be a set of equations. Now, does it matter whether the equations are discussed in English, Spanish, German, or any other of the world’s roughly other 1,000 languages? Of course not — the equations will still produce and predict the same underlying economic behavior. The choice of fiscal labels is simply the choice of an alternative language.
The Generational Accounting and Fiscal Gap. In physics, space-time is a concept whose measurement is not language or frame-of-reference dependent. In economics, the same holds true for variables with physical counterparts, such as gross domestic product (GDP), consumption, national income, national saving and domestic investment. In the fiscal sphere, generational accounting and the fiscal gap are two label- and language-free measures of fiscal sustainability.
Generational accounting is a well-established methodology to measure the burden of government on specific generations. A generational account for any given generation measures the generation’s remaining lifetime net tax bill as a present value — what the generation will pay net of what it will receive, all valued as of today. If the generational accounts of all current and future generations are added together, assuming no change in fiscal policy, the sum amounts to what all current and future citizens are going to pay, on net, in taxes to the government (measured as a present value). This amount has to cover the government’s official debt plus the present value of all future government purchases of goods and services (discretionary spending). If it doesn’t, the difference that’s not covered is called the fiscal gap.
The fiscal gap can also be expressed, more simply, as the difference between the government’s official debt plus discretionary spending and the amount of taxes current and future citizens will pay. It incorporates all of the government’s fiscal activities — including its financial obligations under Medicare, Medicaid, Social Security, welfare, unemployment, and interest and principal on government debt. Because it considers the present value of all future government receipts and payments, it does not miss anything, even using different labels.2
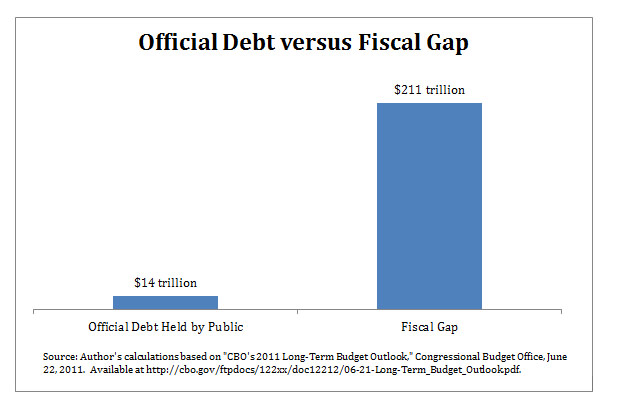
The Size of the U.S. Fiscal Gap. The U.S. fiscal gap, based on the Congressional Budget Office’s long-term Alternative Fiscal Scenario, is nowhere close to the $14 trillion official debt. Indeed, the U.S. fiscal gap is $211 trillion — 15 times larger than the official debt.3
This means that Congress and the president have been focusing on the molehill, not the mountain, in their recent contretemps over the debt ceiling. Their eventual agreement was just a continuation of postwar policy, which has been marked by using labels to run enormous unofficial deficits while distracting public attention on the official deficit.
To get a sense of the distance between the forest and the trees when it comes to stabilizing the United States’ total — official plus unofficial — debt, note that the fiscal gap rose by $6 trillion last year, whereas Congress and the administration settled on reducing the official debt by just $2.5 trillion over not one year, but 10 years!
Eliminating the Fiscal Gap. As indicated, the fiscal gap is now $211 trillion and growing. With the retirement of the baby boomer generation, millions will turn to Uncle Sam for Social Security, Medicare and Medicaid benefits — roughly $40,000, on average, per beneficiary per year. This means the fiscal gap will increase exponentially in the coming years.
The fiscal gap needs to be zero for the United States’ fiscal policy to be sustainable. The country needs the stream of projected future taxes to cover, in present value, the stream of projected future outlays, plus the current official debt. Achieving this result via tax hikes alone would require an immediate and permanent increase in all federal tax rates (corporate, personal income, excise and estate and gift taxes) of 64 percent! Each year’s revenue would be 64 percent higher, implying that the present value of all future revenues would rise by 64 percent.
Alternatively, the United States could immediately and permanently cut all non-interest spending by 40 percent. Each year’s spending would be 40 percent lower, so the present value of spending would also be 40 percent lower.
The chart below shows the terrible fiscal crisis we face — a crisis that our leaders are systematically ignoring by balancing the wrong budget and by doing far too little too late.
The Purple Plans. There are ways to simultaneously get our fiscal house in order and also modernize our fiscal institutions, such as the Purple Tax Plan (www.thepurpletaxplan.org), the Purple Health Plan www.thepurplehealthplan.org, and the Purple Social Security Plan www.thepurplesocialsecurityplan.org. In combination, these three red + blue = purple plans —which are simple, bipartisan, and absolutely essential — will not only eliminate the fiscal gap, but also jump start the economy and put us on a path of sustained growth.
Laurence J. Kotlikoff is an economics professor at Boston University and a senior fellow with the National Center for Policy Analysis.
1 Jerry Green and Laurence Kotlikoff, “On the General Relativity of Fiscal Language,” 2008. Available at http://www.kotlikoff.net/sites/default/files/On%20the%20General%20Relativity%20of%20Fiscal%20Language.pdf.
2 Laurence J. Kotlikoff, “Is Uncle Sam Bankrupt?” National Center for Policy Analysis, Brief Analysis No. 689, January 29, 2010. Available at http://www.ncpathinktank.org/pub/ba689.
3 “CBO’s 2011 Long-Term Budget Outlook,” Congressional Budget Office, June 22, 2011. Available at http://cbo.gov/ftpdocs/122xx/doc12212/06-21-Long-Term_Budget_Outlook.pdf.