The headline unemployment rate fell to 8.2 percent for June 2012 — down from 9.1 percent one year earlier.1 A declining unemployment rate is encouraging. But some of the improvement has come from those whose unemployment benefits have run out. Washington does not count these people as “unemployed.”
According to Barron’s Business Dictionary, in “very bad economic times, the unemployment rate can be deceptive because it does not consider discouraged workers, those who are unemployed but have stopped actively seeking employment.”2 The headline unemployment rate reflects the number of people who are without jobs and who have actively looked for work within the past four weeks. It is expressed as a percentage of the civilian labor force. Both labor force and unemployment are terms defined by statisticians who are ultimately answerable to politicians.
The only really hard data available are for employment and population of working age. The ratio between them changes slowly for demographic reasons, but moves rapidly during business cycles. Those rapid changes reflect the influence of the economy. The complement of the ratio between the employed and the working age population is equally objective, and supplies a transparent indicator of improving or deteriorating labor market conditions. We call it the not-employed rate.
The Recovery in Production, Spending and Employment. The current economic recovery has been unusually weak, despite government actions to jump start the economy on an unprecedented scale. This is less paradoxical than it sounds. Historical analysis indicates that energetic fiscal and monetary policy has always tended to hamper the economy rather than boost it.3
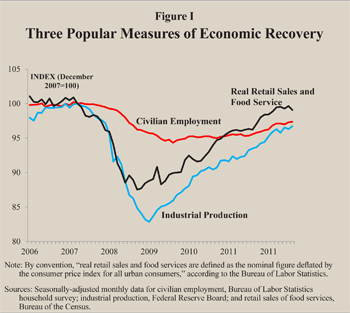
Figure I demonstrates that, as usual, the labor market bottomed later than the economy as a whole, but is improving even more slowly.
The recovery, though more than three years old, clearly has a distance to go. Each of these major indicators — civilian employment, industrial production, and real retail sales and food services — is climbing consistently, but all have yet to return to precrisis levels. Extrapolating the trends in the data, we can estimate that real retail sales will regain their 2008 high in the second half of 2012, industrial production about a year later, and employment not until 2014.
 Narrow and Broader Measures of Unemployment. The media and the public are fixated on headline statistics with respect to both inflation (the consumer price index) and unemployment. As with inflation, there is no single measure of the unemployment rate, but many different measures that depend on how unemployment is defined, and they vary from one segment of the population to another. Each month the U.S. Bureau of Labor Statistics (BLS) reports the official count of not only the civilian labor force and the numbers of employed and unemployed, but also several other groups that fall into the grey area between employment and unemployment.
The BLS publishes only one figure that represents the rate of unemployment. But it recognizes six distinct categories of what it calls “alternative measures of labor underutilization.” The code names for these alternative measures are U-1 through U-6, and it is easy to calculate an unemployment rate for each one by expressing it as a percentage of the labor force, as shown in the table.
The broadest measure, U-6, implies an unemployment rate of 15.1 percent. This category includes not only discouraged workers but people who for economic reasons cannot find full-time jobs or are no longer looking for work. Some are considered to be part of the labor force, others not.
Another alternative measure of unemployment, not sanctioned by the BLS, is called the participation-adjusted unemployment rate. It treats the failure of the labor force to grow in proportion to the population of working age as another form of unemployment. The participation-adjusted unemployment rate stood at 11.25 percent at the end of June 2012.
The more broadly unemployment is defined, the larger the reduction in unemployment numbers on an absolute basis. But on a relative basis the change is much the same. For example, the broadest rate, U-6, has come down 1.4 percentage points from a year ago, a relative decline of 10 percent. This is the same relative decline as in the headline rate. The table shows the percentage change for each of these measures.
 A More Transparent Way to Track Unemployment. There is a transparent way to define unemployment that avoids the subjective concept of the labor force altogether.
Consider that in June 2012, 58.6 percent of the civilian population of working age was employed — this is a hard statistic. So 41.4 percent were not employed. This percentage is the not-employed rate. The not-employed include the military, full-time home caregivers, the retired, those in school, the disabled and other groups. For demographic and other reasons, these components of the not-employed population change gradually over time. The faster moving and more visible component consists of people who want to be in the labor market. Changes in that component are linked to cyclical changes in economic conditions. As Figure II shows:
The not-employed rate one year ago was 41.8 percent.
The not-employed rate declined just 0.4 percentage points over the past year, and it is the broadest possible measure of recovery in the labor market.
The not-employed rate began its steep climb during the 2008-2009 recession from 37 percent or below. (It was even lower in 2006-2007, reflecting the higher levels of employment.)
Conservatively, therefore, a complete recovery requires a drop in the not-employed rate of 4.8 percentage points, from 41.8 percent back to 37.0 percent.
By this calculation, the labor market has only climbed less than one-tenth of the distance back to prerecession conditions.
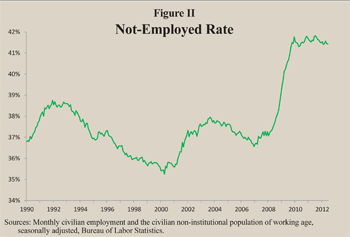 Unemployment and Past Recoveries. Figure II provides a long-term perspective, showing how the not-employed rate has fluctuated during the last two or three economic cycles.
The not-employed rate rose in the recessions of 1990-1991 and 2001, and continued to climb for two years, but began to reverse itself in the third year.
In and following the much deeper recession of 2008, the not-employed rate again climbed for two years, but has since remained stuck at or near its highest level for an unusually long time.
As recently as 2008 the not-employed rate averaged around 37 percent, but the recession propelled it up to 41.8 percent, where it still remained a year ago.
The June 2012 not-employed rate showed a slight decline; but if this rate of improvement continues, it will take a decade or more to get back to where it was in 2008.
Conclusion. The recovery of the U.S. labor market is even slower than many people are aware. The decline in the headline unemployment rate from 9.1 percent a year ago to 8.2 percent in June 2012 sounded encouraging. But it may exaggerate the improvement. Indeed, the next month the unemployment rate rose slightly to 8.3 percent. Interpretation of this headline unemployment number is clouded by the exit of unemployed people from the labor force as their unemployment benefits have run out, as well as by a general “discouragement” of would-be workers. Definitions of employment status such as “unemployed,” “discouraged” and even the “labor force” itself are soft data — subjective and fuzzy.
R. David Ranson is a senior fellow with the National Center for Policy Analysis and president and director of research at H.C. Wainwright & Co. Economics.
Endnotes
1. This report is derived from “What Federal Policies have Historically been Conducive to Superior or Inferior Economic Growth?” a presentation sponsored by the National Center for Policy Analysis and delivered at the Rayburn House Office Building in Washington, D.C., June 26, 2012.
2. The civilian labor force is “the population aged 16 or over in the United States who are not in the military or institutions such as prisons or mental hospitals and who are either employed or are unemployed and actively seeking and available for work.” See Barron’s Business Dictionary at http://www.answers.com/topic/civilian-labor-force.
3. Research Summary: “Why federal government ‘stimulus’ doesn’t stimulate,” Strategic Asset Selector, H.C. Wainwright & Co. Economics Inc., June 30, 2012.