Thomas R. Saving
Director, Private Enterprise Research Center, Texas A&M University
Public Trustee, Federal Hospital Insurance and Federal Supplementary Medical Insurance Trust Funds
Senior Fellow, National Center for Policy Analysis
Testimony before the Senate Budget Committee
February 17, 2005
Today Medicare is America's second largest entitlement program, behind Social Security. In 2004 it accounted for 13 percent of the Federal budget, 2.6 percent of GDP and required general revenue transfers equal to 10.7 percent of federal income taxes. The program provides health care insurance for the retired and disabled population, the same population served by Social Security. The 2003 Medicare Modernization Act made Medicare's health insurance coverage more comprehensive with the addition of a prescription drug benefit. Making the coverage more comprehensive has also made the program more costly. By 2024 Medicare spending is expected to exceed Social Security spending and the differential will continue to escalate thereafter. Here I discuss several ways to assess the current and future status of Medicare as it pertains to the Federal budget. As a Trustee of the Social Security and Medicare Trust Funds I will highlight a few of the measures I believe provide Congress and the Public a complete picture of Medicare's financial situation.
The Future Cost of Medicare
Before getting to estimates of the total cost of Medicare, let me review the characteristics of Medicare that will result in a program that is currently smaller than Social Security, becoming larger than Social Security is just 20 years and that will be 50 percent larger than Social Security by the middle of this century. While both Social Security and Medicare share the same demographics, the similarity ends there.
Social Security's revenue and expenses, without the consideration of the coming demographic issues, are approximately proportional to the nation's Gross Domestic Product (GDP), so its future deficits are the result of a combination of the baby boom generation's retirement, falling fertility rates and increasing life-spans.
Medicare, on the other hand, faces these same demographic issues, plus the fact that the population's demand for health care is growing faster than the nation's GDP. For example, since 1960, per-capita health care expenditures have grown three percentage points faster than per-capita GDP. Essentially, Medicare Part A, Hospital Insurance (HI), tax revenues rise only as fast as GDP, which implies that even if there were no demographic issues, the faster than per-capita GDP growth of HI expenditures would rapidly outpace HI revenues. Supplementary Medical Insurance (SMI), comprised of Medicare Part B and Part D, prescription drugs, are financed through premium payments, approximately 25%, and general revenue transfers, approximately 75%. Since the premium payments are expected to remain about 25% of expenditures, they will grow as fast as expenditures and thus faster than GDP. In fact, in 2003, HI tax revenues were more than five times total Medicare premium income and in 2006, after the prescription drug benefit becomes fully operational, HI tax revenues will be 3.5 times SMI premium income, but by 2055 SMI premium income will exceed HI tax revenues.
In producing the Trustees Report estimates of future Medicare expenditures we assume that by 2029, Medicare expenditure growth will have fallen from its current level of approximately two percentage points faster than per-capita GDP to one percentage point faster than per-capita GDP. Further, for the estimates beyond the 75-year horizon, we assume that Medicare expenditure growth will gradually fall until after 25 years it is equal to per-capita GDP growth, so that after 100 years the share of health care in GDP will remain constant for the indefinite future. Both of these assumptions are conservative as there appears to be no evidence that health care expenditures will not continue to grow at more than our ultimate assumed one percentage point above per-capita GDP.
| Table 1 Real Per-capital Growth in National Health Expenditures (NHE) Versus Gross Domestic Product (GDP) % |
|||
| Period | NHE | GDP | NHE-GDP |
| 1945 to 2002 | 4.2 | 1.5 | 2.6 |
| 1960 to 2002 | 4.5 | 1.5 | 3.0 |
| 1970 to 2002 | 4.0 | 1.8 | 2.2 |
| 1980 to 2002 | 4.4 | 2.0 | 2.4 |
| 1990 to 2002 | 3.7 | 1.9 | 1.8 |
Source: 2004 Review of Assumptions and Methods of the Medicare Trustees' Financial Projections.
Medicare's financial status can be summarized in two broad ways: in terms of the present value of future unfunded liabilities and in the path of future budget transfers required to cover the funding shortfalls. Medicare is fundamentally a generation transfer system in that current taxpayers pay for the benefits of current beneficiaries, primarily retirees. The fundamental economics of a generation transfer system is that unless current law is changed in some way, the debt owed to the current generation, all those in the system now (meaning both workers and retirees), must be paid for by future generations, those who begin work tomorrow and after.
Let me separate the debt owed to the current generation by the three principal programs that comprise Medicare. The Part A, Hospital Insurance, or traditional Medicare, debt owed to the current generation is, from the 2004 Trustees Report, $14.2 trillion. How much under current law will future generations, the new entrants to the system beginning with those who start work tomorrow, contribute toward paying this $14.2 trillion debt? Actually, they will not contribute anything. If projected benefits are paid and only scheduled taxes and premiums are collected, future generations will actually add $7.8 trillion to the unfunded liability of Medicare Part A. Thus, the total unfunded liability of Medicare Part A is $22.1 trillion.1
| Table 2 Composition of Medicare's Unfunded Obligations (Trillions 2004$) |
||||
| Hospital Insurance | Supplementary Medical Insurance | |||
| Group or Category | Part A | Part B | Part D | Combined |
| 75-Year Open Group | 8.2 | 11.4 | 8.1 | 27.7 |
| Current participants | 14.2 | 8.8 | 6.2 | 29.2 |
| Future participants | 7.8 | 14.4 | 10.3 | 32.5 |
| Current and future participants | 22.1 | 23.2 | 16.6 | 61.9 |
| Trust Fund offset | 0.3 | 0.0 | 0.0 | 0.3 |
| Infinite horizon | 21.8 | 23.2 | 16.6 | 61.6 |
Source: Tables II.B12, II.C17, II.C23 2004 Medicare Trustees Report.
Now consider Medicare Part B, which along with prescription drug benefits, Part D, comprises Supplementary Medical Insurance (SMI). Unlike Medicare Part A, which is meant to be financed wholly with HI taxes, the payroll tax plus Medicare's share of the income taxation of Social Security benefits, Medicare Part B is set up as an insurance program with participants paying a premium. However, unlike private health insurance where premiums cover cost, the SMI Part B premium is set to cover only 25 percent of Part B costs with the remaining funding coming from the federal budget. The Medicare Part B obligation owed to the current generation, the difference between premium income and expenditures, is $8.8 trillion. If the formula for premiums remains unchanged and projected benefits are paid, future generations will add $14.4 trillion to this debt. Thus, the total unfunded liability of Medicare Part B is $23.3 trillion.
Finally let us consider the newest addition to Medicare, Medicare Part D, or prescription drug benefits. This part of Medicare is an insurance program in the same sense that Part B is, in that participants are only expected to pay premiums that cover about 25 percent of the total cost.2 The Medicare Part D obligation owed to the current generation, the difference between premium income and forecast expenditures, is $6.2 trillion. If the formula for premiums remains unchanged and projected benefits are paid, future generations will add $10.3 trillion to this debt. Thus, the total unfunded liability of Medicare Part D is $16.6 trillion.
Taking all three parts of Medicare together we owe the current generation a total of $29.2 trillion and future generations will add another $32.5 trillion to this obligation. Thus, the total Medicare debt is a staggering $61.6 trillion. Let me put this number in perspective for you. Assuming that federal income tax revenues remain at the 50 year average of 10.89 percent of the nation's gross domestic product, the present value of all future federal income tax revenues from now to eternity is $99.3 trillion so that the Medicare debt of $61.6 trillion is 62 percent of all future federal income tax receipts. Thus, if Congress passed legislation today, binding on all future Congresses, setting aside 62 percent of all federal income tax revenues from now to eternity, you could just pay for promised Medicare benefits. Bear in mind that this setting aside of 62 percent of federal income tax revenues cannot be in the form of treasury bonds sent over to CMS but must be in the form of real investment in the economy. That means that the funds must come from some combination of increased federal income taxes, reduced federal expenditures and increased federal borrowing.
As a final note, the unfunded liability is often calculated using the traditional 75-year horizon. This horizon fails to measure what happens after the end of the horizon and thus ignores whether or the system improves or gets worse at the close of the period. The total 75-year unfunded liability for Medicare is $27.7 trillion, close to the debt owed the current generation of $29.2 trillion, although the two numbers are not directly comparable. Even erasing this 75-year debt would require setting aside 43 percent of all federal income tax revenues for the next 75 years.
| Table 3 Composition of Medicare's Unfunded Obligations (% of Federal Income Taxes) |
||||
| Hospital Insurance | Supplementary Medical Insurance | |||
| Group or Category | Part A | Part B | Part D | Combined |
| Current participants | 14.3 | 8.9 | 6.2 | 29.4 |
| Future participants | 7.9 | 14.5 | 10.4 | 32.7 |
| Current and future participants | 22.3 | 23.4 | 16.7 | 62.3 |
| Trust Fund offset | 0.3 | 0.0 | 0.0 | 0.3 |
| Infinite horizon | 22.0 | 23.4 | 16.7 | 62.0 |
Source: Tables II.B12, II.C17, II.C23 2004 Medicare Trustees Report. Federal Income taxes are estimated to be 10.89% of GDP which is its 50 year average share.
Another approach to understanding the future funding problems facing Medicare is to review the annual cash flows. These annual funding requirements can be denominated in several ways: as nominal dollars, constant dollars, as a share of Gross Domestic Product, or as I prefer, as a share of federal income taxes. The first three measures may be understood by the small cadre who prepare the Trustees Report and some of the more ardent analysts, but I have found that if I speak in terms of the share of federal income taxes, everyone can understand the implications for future funding. For example, in 2004, Medicare spending net of premium payments and dedicated tax revenues required general revenue funding equal to 10.7 percent of total federal income tax revenues.3
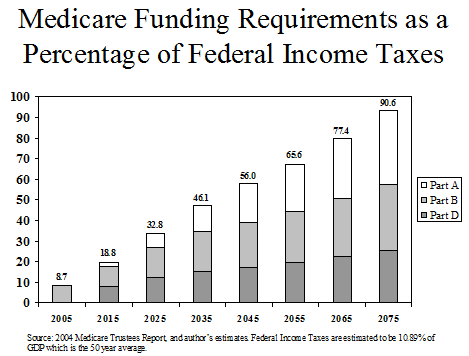
This may seem like a manageable amount, but two things are worth noting. First, Medicare Part A, the Hospital Insurance portion, will show a deficit in 2004 after several years of surplus and this deficit will grow at an accelerating pace over the next 25 years. Part D, the prescription drug benefit will begin next year, but will rapidly grow in its requirement on the budget. The transfers required to pay current law benefits given current law taxes and premiums will grow from their current level to almost 19 percent of Federal income taxes in 2015, to over 32 percent in 2025, and will require over 90 percent of projected federal income tax revenues by 2075!4 Clearly it is hard to imagine transfers of this magnitude being made.
Individual members of society must ultimately provide some of the funding for their own retirement health care. In addition, health care markets in general must be reformed in a way that users of the system care about cost. As I pointed out above, the Trustees have adopted the assumption that health care costs per-capita will grow at a rate equal to GDP per-capita growth plus 1 percentage point. This implies that health care expenditures will rise from 15 percent of GDP today to 38 percent of GDP by 2075. However, if spending were to rise at a rate equal to per-capita GDP plus 1.5 percentage points or GDP plus 2 percentage points, then health care would account for 55 or 79 percent of GDP, respectively, by 2075.5 Numerous factors contribute to health care growing faster than the rest of consumption. Regardless of the cause, it seems reforms are inevitable given that 45 percent of all health care spending today is paid for by taxpayers through federal, state, and local government funds.
Beginning with the 2005 Medicare Trustees Report, the Medicare Modernization Act requires the Board of Trustees to test whether the difference between program outlays and dedicated financing sources, consisting of HI payroll taxes, the HI share of income taxes on Social Security benefits, Part D State transfers, and beneficiary premiums, exceeds 45 percent of to total Medicare expenditures. If this critical level is expected to be attained within seven years of the projection, a determination of "excess general funding" is triggered. In the 2004 Trustees Report we reported that the critical difference is expected to reach the 45 percent level in 2012, just one year short of the seven year requirement. If our 2004 forecasts remain on track, we can expect that the trigger will be reached in this year's Trustees Report. At this point, however, it would be premature for me to comment on this since the final numbers for the 2005 Trustees Report are not yet in place.
As my fellow Public Trustee, John Palmer and I have noted for several years in the summary of the combined Medicare and Social Security Trustees reports, Medicare's financing problems occur sooner than Social Security's and the solutions to its problems more difficult. This past year Medicare Part A, Hospital Insurance, spending was in excess of its tax revenues, and Supplementary Medical Insurance, Medicare Parts B and D will require increasing general revenue transfers with each passing year. The pace of this increase takes a step forward with when the full Part D prescription drug benefit takes effect next year. The demands Medicare places on the rest of the Federal budget will force Congress to consider some difficult choices as to who should bear the burden of retirement health care spending. As the debate over Social Security has highlighted the generational consequence of financing elderly entitlements, the generational burden represented by Medicare amplifies the need for serious consideration of reform.
Notes
- The total is not equal to the sum of the two components due to rounding.
- This includes premiums paid by Medicaid for eligible Medicare beneficiaries.
- Federal income taxes, individual and corporate, were equal to 8.6 percent of GDP in 2004.
- The projected transfers as a percentage of Federal income taxes assume that income taxes will equal 10.89 percent of GDP in future years. These percentages can also be thought of as the increase in Federal income taxes, above their 50 year average share of GDP that would be necessary to meet Medicare's funding requirements.
- Estimates are from Review of Assumptions and Methods of the Medicare Trustees' Financial Projections, Technical Review Panel on the Medicare Trustees Reports, December 2000.