The collapse of crude oil prices in 2014 was a big surprise, but popular explanations quickly circulated. Most attributed the collapse to changes in supply and/or demand.
It is true that a shift in supply or demand will change prices in any market; however, not all market-price movements are necessarily due to a change in market supply or demand — especially in the case of prices for commodities as highly political as crude oil. Public policy-makers may intervene in oil markets in pursuit of national economic or security goals. Although most economies are “price-takers” in world commodity markets, major economic powers like the United States can dramatically influence world prices when they have a compelling reason to intervene. In fact, the more volatile the market, the more public policy initiatives are likely to be at work, whereas shifts in supply or demand tend to take place more gradually.
Longer term trends in the price of oil also reflect cumulative changes in the purchasing power of the dollar. Looking at oil prices relative to gold prices instead of U.S. dollars takes account of the long-term decline in the value of the dollar and allows us to recognize more clearly the effect of supply, demand and public-policy factors that influence the price of petroleum.
Declining Oil Prices
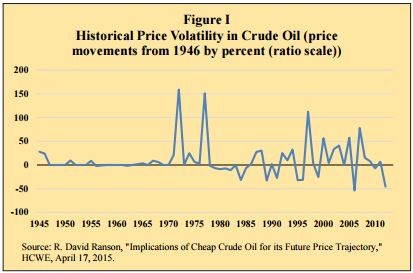
The 2014 price decline was unusually deep, as Figure I illustrates. Although oil prices jumped by well over 100 percent within a few months in both 1973 and 1979, extreme price declines are less usual. As shown in Figure I, however, the picture is fairly symmetrical when it is plotted on a ratio scale.
It took a major world recession to cut the price of oil in half in 2008.
Prices took time to rebound as the world economy recovered.
It took two-and-a-half years for West Texas crude to recover its preplunge price level of September 2008.
Trend-reversion in Oil Prices
The long historical tendency for the price of crude oil to parallel the price of gold and other precious metals is well known. Historically, an equally weighted index of gold, silver and platinum has worked as a valuation indicator for oil. However, silver and platinum prices plunged during the 2008 recession, making gold a better long-term benchmark.
Law of Diminishing Returns
Figure I shows that oil prices have increased more rapidly than gold over time. Since 1946, the cumulative difference in annual price growth was only 0.4 percent, including the 2014 collapse in prices. As a whole, the trend is toward an average annual increase in the oil-gold price ratio through 2014 of 1.1 percent (compounded).
The long-term increase is attributable to the slowly increasing scarcity of crude oil according to the Law of Diminishing Returns. In this sense, “scarcity” refers to the fact that the marginal cost of bringing to market deposits of raw materials in the earth’s crust naturally rises as the most accessible reserves are used up first. But as a measure of scarcity, the oil-gold ratio is a relative matter; the cost of exploiting crude oil reserves has risen faster than the cost of exploiting gold reserves.
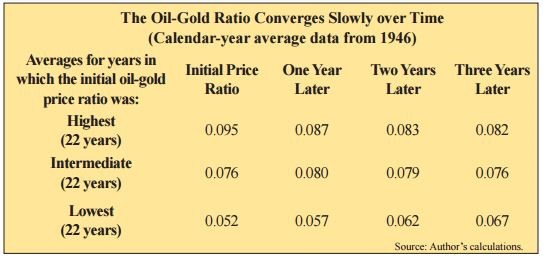
Market forces also govern the relative flow of capital into the oil and goldmining industries. When the price of oil is high relative to gold, it is more profitable for capital to flow toward the oil industry than gold mining, increasing its relative supply and putting downward pressure on its relative price. So the oil-gold price ratio should be expected to converge over time, as indeed the table shows it does. However, movement back to equilibrium appears to be asymptotic and not very fast. It takes about two years to half-close the gap between the actual price-ratio and the norm toward which it converges.
Current Outlook for the Price of Oil
The long-term tendency for the oil-gold price ratio to increase can be seen clearly in the monthly history shown in Figure II.
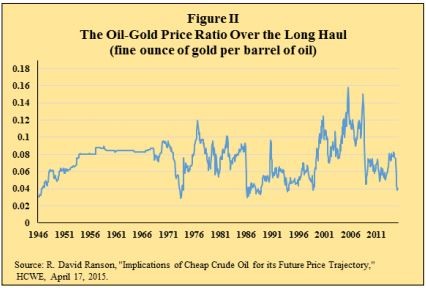
A best-fit upward-sloping straight line indicating the trajectory toward which the price ratio between West Texas crude and gold tends to converge gives us an estimate of 0.075 for the equilibrium oil-gold price ratio as of mid-2015, compared with an actual ratio of 0.045 given a current crude oil price around $49 and gold around $1,100. That implies an equilibrium price of $82 for West Texas crude, or a discount of about 40 percent.
Conclusion
If it takes two years to half-close the gap in current oil prices compared to the equilibrium price suggested by the table, it would be reasonable to expect the price of crude to rise at an annual rate of about eight dollars a barrel over the next 12 months.
R. David Ranson is a senior fellow with the National Center for Policy Analysis and president of HCWE Inc. Republished with permission by the National Center for Policy Analysis.