Republican presidential candidate Bob Dole has proposed a tax plan that includes an across-the-board reduction of personal income tax rates of 15 percent, a reduction in the capital gains tax rate and a child tax credit of up to $500. The announced goals of the Dole plan are to increase the nation's economic growth rate and to provide taxpayers with more disposable income.
This study examines the economic effects of the Dole plan using a computable general equilibrium (CGE) model, an economic model that has been published in several peer-reviewed journals. The model finds that:
- The plan would result in an increase in real output in every sector of the economy except government-subsidized agricultural crops.
- The greatest growth would be in consumer sectors, which would generally increase from 3 percent to 5 percent.
- The tax cuts would stimulate savings and investment, with a 7.8 percent increase in savings.
- The plan would create 2.9 million new full-time jobs.
Taxpayers would receive a direct gain from a tax cut, but even those paying little or no taxes would benefit.
- People with disposable incomes of less than $13,000 a year would average a gain of 3.8 percent.
- The smallest gain, 2.9 percent, would go to people with disposable incomes between $25,800 and $38,600 a year.
- Those with disposable incomes of $64,500 or more would average a gain of 7.0 percent.
The model finds that under the Dole tax plan, new tax revenue resulting from the additional economic growth – the "feedback" effect – would restore 35.5 percent of the revenue loss from the tax cuts in the first year. As a result, the revenue loss of 6.2 percent from the tax cuts would be reduced to 4.0 percent. This is in line with the estimated feedback from the Kennedy administration tax cut in the early 1960s and the Reagan administration tax cut in the 1980s.
[page]Republican presidential candidate Bob Dole has proposed a tax plan with three major components.
- All individual income tax rates would be reduced by 15 percent; thus, a current 15 percent rate would be reduced to 12.75 percent and a current 28 percent rate to 23.8 percent.
- Capital gains taxes would be reduced from 28 percent to 14 percent for taxpayers earning more than $40,100 and from 15 percent to 10.5 percent for taxpayers earning less than $40,100.
- Tax credits would be allowed for children under 18 – a maximum of $500 for single heads of households earning incomes up to $75,000, for married individuals filing separate returns with incomes up to $55,000 and for married couples filing joint returns with household incomes up to $110,000. (The credit would be reduced by $25 for every $1,000 of additional income for all three types of households.)
There are other components in the Dole tax plan, but the economic effects are minor and are not taken into consideration in this study.
In recent years, economists have developed a way of calculating the consequences of the complex economic interactions caused by changes in the tax code. The method makes use of a computable general equilibrium (CGE) model.1 Although different scholars use different variations of this model, the core concept is well understood and has appeared many times in the economic literature.2
"An economic model is used to calculate the effects of the Dole tax proposal."
In this paper, we describe the results of our use of a CGE model to calculate the effects of the Dole proposals on the various sectors of the economy, changes in the income of different income groups and the effect on government revenues.
Our model, which is described in more detail in the appendix, divides the economy into 14 production sectors and 14 consumption sectors. The goods and services consumers buy come from combinations of output from various primary production sectors. For example, the sale of food products to consumers requires outputs from the subsidized crop, other crop, livestock and food processing sectors integrated with outputs from the services sector such as advertising and distribution. The model compares relative prices and quantities of the output of the various production and consumption sectors before and after the implementation of the changes proposed by Dole to see how they change and how the changes interact to cause other changes. In turn, these changes affect the economic welfare of the various income groups, which affects government revenue.
[page]
The announced goals of the Dole plan are to increase the rate of economic growth and to increase disposable incomes by reducing the amount going to taxes. The tax cuts and child tax credit proposed by Dole would result in expanded output in every sector of the economy except subsidized agricultural crops. A large increase in disposable income – discussed later in this paper – would increase consumption of every type, which in turn would stimulate the demand for producer goods and services.
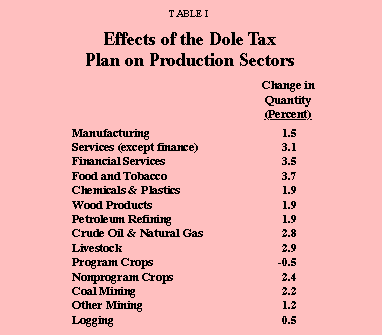
Effects on Production. The demand for producer goods and services created by increased consumption would be reflected most strongly in the increased production of food and tobacco (up 3.7 percent), as shown in Table I. In addition:
- Financial services and other production services would grow 3.5 percent and 3.1 percent, respectively, because of the demand created by the growth in other production sectors.
- The output of livestock would grow by 2.9 percent to accommodate the increase in food consumption.
- Crude oil and natural gas production would grow by 2.8 percent (and be accompanied by a decrease in oil imports) due to increased exploration resulting from the lowering of the capital gains tax rate.
The expansion of the production sectors is generally accompanied by an increase in the net import of producer goods, with three exceptions. This general increase in net imports is not surprising, given the structure of the tax cuts. The Dole tax plan reduces income taxes, but not business taxes. This encourages households to increase consumption, which in turn encourages producers to produce more goods and services. However, producers do not increase output as much as if business taxes were also decreased, so net imports increase.
"The large increase in domestic production of crude oil and natural gas is accoppanied by a decrease of 2.3 percent in net imports of goods."
However, there are three exceptions: 1) goods from foreign manufacturing, 2) foreign crude oil and natural gas and 3) foreign refined petroleum and associated products. Net imports of manufactured goods decrease by 0.03 percent, so the "giant sucking sound" that concerned Ross Perot during the debate over the North American Free Trade agreement is not apparent. More significantly, dependence on foreign oil goes down. The large increase in domestic production of crude oil and natural gas pointed out above is accompanied by a decrease of 2.3 percent in net imports of goods produced in this sector by foreign producers. Similarly, the net imports of goods from the foreign refining sectors (refined oil, kerosene, distillates and residual fuel oil ) decrease by 1.4 percent. These goods are typically imported from Canada and Mexico because they are more volatile than crude oil and are not usually imported from overseas sources.3
The decrease in production of subsidized crops (also referred to as "program crops") is explained by the fact that land is needed for livestock and non-subsidized crops (vegetables, fruits, and nuts). As the demand and, more importantly, prices for these other agricultural products increase, farmers are less dependent on subsidies they could receive for subsidized crops.4

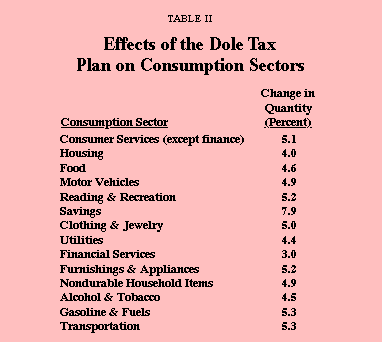
Effects on Consumption. Every consumer sector of the economy would receive a strong boost from the Dole plan. As Table II shows, increases in output would range from 3.0 percent to 5.3 percent, except for savings, which would increase by 7.9 percent. Other than savings:
- The largest expansions would be in gasolines and fuels (5.3 percent), transportation (5.3 percent), furnishings and appliances (5.2 percent) and reading and recreation (5.2 percent).
- The smallest increases would be in consumer financial services (3.0 percent) and housing (4.0 percent), in both instances because so much of the available capital would go to production sectors.
Effects on Savings. One of the important effects of the Dole plan would be the large increase in savings (7.9 percent). There are two major reasons for this. First, savings includes purchases of stocks and bonds and the reduction of the capital gains tax rates encourages these. Second, as discussed below, disposable income would increase among all income groups, and as incomes increase households save more. The increase in savings bodes well for future economic growth.5
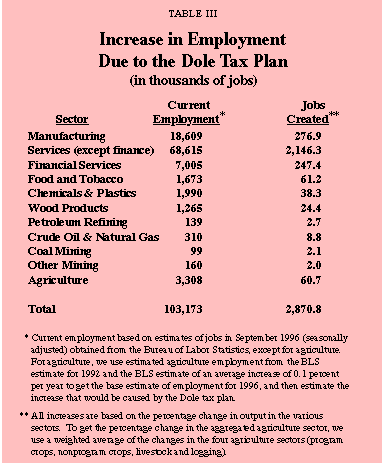
Effects on Job Creation. The increased output resulting from implementation of the Dole plan would cause private-sector employment to grow by 2.8 percent, or 2.9 million full-time jobs. As Table III shows, services other than financial services, which now employ about two-thirds of the private-sector work force, would create about three-fourths of the new jobs, with that sector's workforce growing by 3.1 percent.


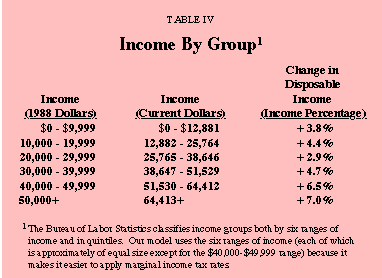
One of the criticisms of the Dole plan, other than that it would increase the federal deficit, is that those with high incomes would receive the greatest benefit. Much of the gain from the Dole proposals would indeed go to those who pay the greatest amount of taxes. However, the resulting increase in economic activity would benefit all income groups, including even those who pay little or no taxes. As Table IV shows:
- People with disposable incomes of less than $13,000 a year would average a gain of 3.8 percent.
- The smallest gain, 2.9 percent, would go to people with disposable incomes between $25,800 and $38,600 a year.
- People with disposable incomes of $64,500 or more would average a gain of 7.0 percent.
Critics of the Dole plan, led by President Clinton, have maintained that it would "blow a hole in the deficit," a phrase they have used frequently. Supporters of the plan have contended that new tax revenue generated by the resulting economic growth – the "feedback" effect – would reduce the net amount of revenue lost to the tax cuts.
It has been estimated that the Kennedy administration tax cut in the early 1960s had a feedback of between 25 percent and 75 percent; that is, federal revenues were reduced by $12 billion, but between $3 billion and $9 billion of the direct cost was recovered after two years through increased economic growth.6 Lawrence Lindsey, formerly a professor at Harvard University and now a member of the Board of Governors of the Federal Reserve System, calculated that the Reagan administration tax cut in the 1980s had a feedback of 70 percent by 1985.7 The Congressional Budget Office estimated in 1978 that a one-third reduction in income tax rates at that time would produce 24 percent feedback the first year.8
The model finds that the Dole tax plan would result in a revenue loss of 6.2 percent before consideration of new revenue from economic growth, but that when the revenue from growth is considered, the revenue loss would be 4.0 percent – a feedback of 35.5 percent in the first year.
NOTE: Nothing written here should be construed as necessarily reflecting the views of the National Center for Policy Analysis or as an attempt to aid or hinder the passage of any bill before Congress.
[page]-
See the appendix for a description of the CGE model we used.
- For example, computable general equilibrium models are discussed at length in J. B. Shoven and J. Whalley, Applying General Equilibrium (Cambridge, U.K.: Cambridge University Press, 1992).
- This study does not report the details of international trade, although the model includes a foreign sector. Details of foreign trade are available from the authors.
- It should be noted that these are relative, not nominal, prices. Because production increases in all sectors except one, prices could actually fall if the quantity of money remained constant.
- See M. J. Boskin, "Taxation, Saving and the Rate of Interest," Journal of Political Economy, 1978, 86 pt. 2: S3-S27. We use Boskin's savings elasticity estimates for the various income groups, which average around 0.4, for the CGE simulations reported.
- Congressional Budget Office, Understanding Fiscal Policy (Washington: U.S. Government Printing Office, 1978), p. 25.
- Lawrence B. Lindsey, The Growth Experiment (New York: Basic Books 1990), p. 74-76.
- Congressional Budget Office, An Analysis of the Roth-Kemp Tax Cut Proposal (Washington: U.S. Government Printing Office, 1978), p. 45.
How the CGE Model Works
The general equilibrium model is an updated and expanded version of the 1984 based CGE model described in considerable detail in Roy Boyd and D. H. Newman, "Tax Reform and Land-Using Sectors in the U. S. Economy: A General Equilibrium Analysis," American Journal of Agricultural Economics, 1991, 73: 398-409. The model incorporates supply, demand by households, demand by government and a foreign trade sector. On the supply side, total U.S. production is divided into 14 production sectors. The production sectors are: food and tobacco processing; logging; wood processing (e.g., lumber products and pulp and paper); program crops (e.g., corn, wheat, cotton); livestock; nonprogram crops (e.g., fruits and vegetables); financial services; other services; manufacturing; chemicals and plastics; petroleum refining; crude oil and natural gas; coal mining; and other mining. Production functions are nested value-added CES functions with either two or three levels. The production function in the crude oil and natural gas sector treats the oil and gas as a single sector with two outputs and an elasticity of transformation between the two outputs. This is because firms producing these goods produce them jointly and simultaneously. In sectors where land enters the production function explicitly (viz., logging, program crops, livestock, and nonprogram crops), the first-level CES function combines land and capital. Otherwise capital is taken as a primary input. The capital/land CES function is then combined with labor in a second-level CES function. In all CES functions, the inputs have positive substitution elasticities obtained from previous empirical studies. Inputs from the other production sectors enter in fixed proportions, with ratios taken from the national input-output matrix; there is no allowance for substitution among the production sector inputs. These inputs are combined with the capital/land/labor functions in the completed CES function.
The 14 production sectors create 14 commodities. The commodities are: alcohol and tobacco; food; consumer services; housing; clothing and jewelry; reading and recreation; motor vehicles; furnishings and appliances; utilities; gasoline and fuels; nondurable household items; transportation; financial services; and savings. Any given commodity will use inputs from several of the production sectors.
Consumers are divided into six income groups. The groups are (in 1988 dollars): $0 – 9,999; $10,000 – 19,999; $20,000 – 29,999; $30,000 – 39,999; $40,000 – 49,999; and $50,000 and higher. In each group, household utility is a triple-nested CES function. Goods and services enter into the lowest nest. The bundle of goods and services then enter a higher nest which includes the goods/service bundle and leisure. In the highest nest, the goods/service/leisure bundle competes against saving for the consumer's disposable income.
Government utility for goods and services is modeled as a single Cobb-Douglas function. The government obtains its income from its initial endowment and by imposing taxes on output, income, consumption and imports. Thus, for example, the model has the government taxing the various income groups at their (actual) marginal tax rates. The use of the marginal tax rates preserves the incentive structure, but takes too much income away from the consumers. To correct for this, the differences between tax collections calculated using the marginal tax rate and the actual tax collections are added to the consumer's group's income as a lump-sum transfer from government.
A foreign sector completes the model. The foreign sector produces imports and consumes exports. In the foreign sector, we hold foreign borrowing constant.
[page]Roy G. Boyd, Professor of Economics at Ohio University, currently is in a temporary assignment at the University of Colorado. Boyd received a Ph.D. in economics from Duke University. He was formerly on the faculty of the University of Wisconsin at Milwaukee. In addition to the CGE model of the United States economy, which he originally developed for the U.S. Department of Agriculture, he has also developed models of the national economies of Mexico and the Philippines. His research has often focused upon taxation policies involving natural resource sectors and their general equilibrium effects on other related sectors of the economy.
Barry J. Seldon is Associate Professor of Economics and Political Economy at the University of Texas at Dallas. He has a Ph.D. in economics from Duke University, and previously taught at Ohio University. His publications have spanned a variety of topics from research and development and advertising to public finance, public choice and political support. His research often considers the impact of and private-sector response to public policy.