At least 170 million people – and perhaps as many as 360 million – have been murdered by their own governments in this century. This is more than four times the 42 million deaths from civil and international wars. When a state murders some of the general population, it is called democide; when it murders minorities, the term is genocide. Thus genocide is one type of democide.
Democide is employed to intimidate, demoralize or subjugate and to maintain power. Democracies have not entirely eschewed democide, but they have usually inflicted it on colonial populations.
- Communist regimes have killed the most people in this century, followed by Nazi Germany, which killed more than 16 million people between 1933 and 1945.
- The Soviet Union killed 54.7 million between 1917 and 1987, and China killed 35.6 million between 1949 and 1987.
- The Khmer Rouge killed a much larger percentage of its nation's people, liquidating about a third of all Cambodians between 1975 and 1979.
The more productive people are, the more governments can tax and confiscate. So the more productive people are, the more costly it is for governments to kill them. Evidence indicates that governments respond to this economic incentive. Other things being equal, a 1 percent increase in per capita real Gross Domestic Product (GDP) leads to about a 1.4 percent decline in killing. The increased value of a human life in the Soviet Union and China from increased output per capita may have done more to slow the pace of state murder in those countries than changes in policy after the deaths of Stalin and Mao Tse-tung:
- During the Stalin era (1929-53), about 42.7 million people were killed in the Soviet Union, while 8.1 million were killed in the following 34 years.
- In China, 34.4 million people were killed during the reign of Mao Tse-tung (1949-76), and 874,000 were killed in the following decade.
Countries that kill their own people are poorer and grow more slowly than countries that do not. A comparison of 33 less-developed countries that have not practiced state-sponsored killing with 23 that have shows the average annual real GDP of the murderous states to be about 20 percent less than it might have been. Among the nations that have paid the highest price:
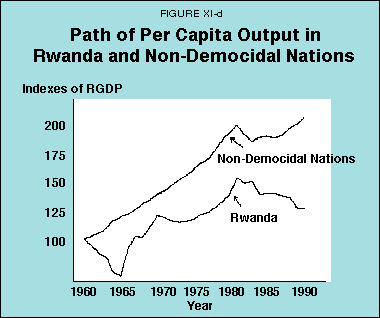
- Killing by the state in Rwanda during the years 1962-90 reduced annual GDP by 27 percent.
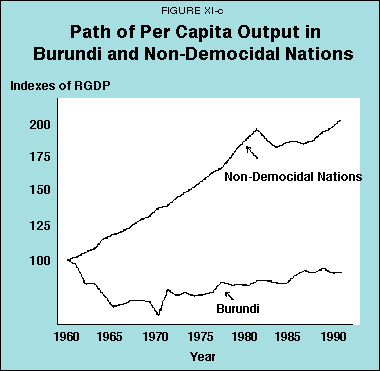
- Killing in Burundi during 1965-90 reduced GDP by 54.8 percent.
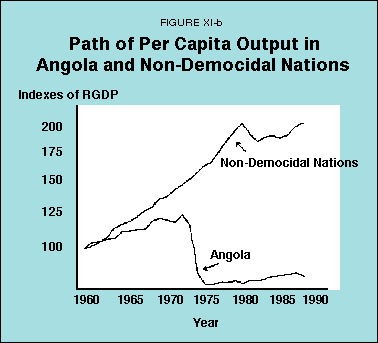
- Killing in Angola from 1975-89 reduced output by 61.6 percent.
Over several centuries, governments have tended to murder a smaller percentage of their people. However, the killing of massive numbers by Communist countries in the 20th century reversed that trend.
[page]In the 20th century, at least 170 million people – and perhaps as many as 360 million – have been murdered by their own governments. This is more than four times the approximately 42 million deaths from civil and international wars.1 The Union of Soviet Socialist Republics, the People's Republic of China and Nazi Germany killed on an appalling scale. But state-sponsored murder also is quite common elsewhere. When the state murders some of its general population, it is called democide; when it murders minorities, the term is genocide.
Authoritarian states employ democide to maintain power. It is part of a broader program of state-approved terror designed to intimidate, demoralize or subjugate the citizenry. Terror has an obvious chilling effect on actual or potential enemies, and it raises the cost of opposition.
"In this century, at least four times as many people have been killed by their own governments as by wars."
Democide has been employed to enforce ideologies (as in the Spanish Inquisition, the Cultural Revolution in China and Muslim fundamentalist states)2 and policies (as in the liquidation of the Kulaks to facilitate Soviet collectivization).3 It is not always successful in the long run, as illustrated by the collapse of socialist dictatorships in Eastern Europe and the Soviet Union and the end of the Marcos regime in the Philippines. But it often succeeds for a time, as it has in China, Cuba, North Korea, Pinochet's Chile, Haiti, Iraq, Libya and a number of other African nations.
Genocide typically is directed at a group identified by race, religion, ethnicity or tribe.4 It has occurred in environments as diverse as Germany, the Soviet Union, Bosnia, Burundi, Rwanda, Paraguay, Iraq, Bangladesh, India and Pakistan.
[page]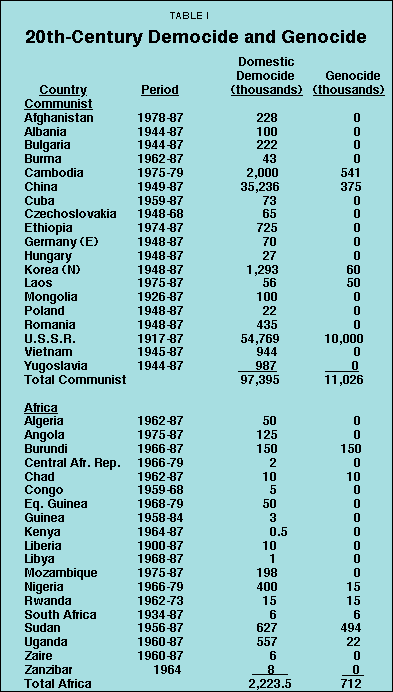
Murder is the most extreme expression of enmity. It may be spontaneous, as dominant group members massacre other groups, or it may be very well planned. This study is concerned only with the mass killings practiced by governments: democide, including genocide.
For example, the study does not include the approximately 3,400 lynchings of Negroes, mainly in the U.S. South, between 1882 and 1935; the 52 people killed in the Los Angeles riot of 1992, the worst in U.S. history; or even the large-scale killings of Muslims and Hindus in the early days of India's independence. Nor does it include civilian casualties of war. It does include deaths from democide and genocide during wartime.
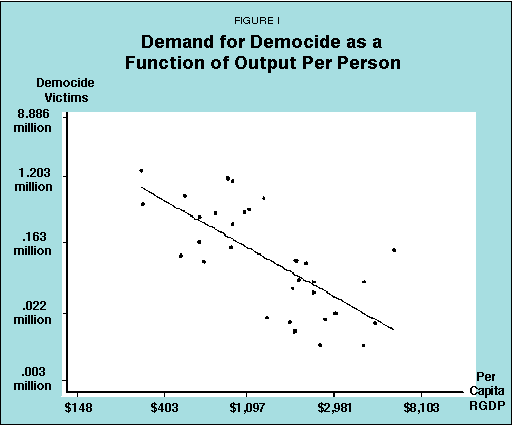
Table I demonstrates that democide occurs mainly in authoritarian regimes.5 Democracies have not always been averse to democide, but they have usually inflicted it on colonial populations. Democracies account for about 1 percent of the total deaths. The vast majority of 20th-century killing has been done by Communist regimes.6 All Communist states have committed democide and about one-fourth have practiced genocide. Numerically, the Soviet Union and China had the highest levels of killing.
- The Soviet Union killed 54.7 million between 1917 and 1987.
- China killed 35.6 million between 1949 and 1987.
- The Khmer Rouge killed a much larger percentage of its nation's people, liquidating about a third of all Cambodians between 1975 and 1979.
Authoritarian regimes and noncommunist totalitarian governments committed a third of the murders. Overall, about a third of noncommunist nations have practiced democide or genocide since World War II. This includes more than a third of the African states, such as Sudan, Uganda, Nigeria and Rwanda, which killed about half a million of its citizens in 1994. Fifteen South and Central American countries are represented, with Brazil, Guatemala and Colombia killing on a large scale. In Asia and the Middle East, 13 nations have committed democide, Pakistan and Indonesia most extensively. In Europe, besides Nazi Germany, state-sponsored murder has occurred in Cyprus, France (mainly during the German occupation), Greece, Italy (during the fascist period), Spain, Turkey (mainly against the Armenians, but also the Kurds) and the United Kingdom (Ireland, Northern Ireland).
"Where per capita income is low, the authorities view life as cheap."
A rough negative correlation exists between the level of state killing and real gross domestic product (GDP) per capita. For example, the Central and South American nations that have modest levels of democide have higher income levels than many of the African and Asian nations that have killed on a larger scale. This suggests that where per capita income is low, life is viewed by the authorities as cheap. Where per capita income is higher, states may be constrained by the cost of killing their populations.
This suggests that "price", measured as output per person, may restrict the amount of state-sponsored murder. A rational dictator or ruling group will practice democide or genocide up to the point at which the marginal benefit equals the marginal cost. In other words, the dictator or ruling group will weigh the incremental benefit of continued rule and a share in the "rents" that are generated through centralized political and economic control (plus any "pleasure" obtained from inflicting terror) against the "cost" – the incremental national output lost from the killing.7
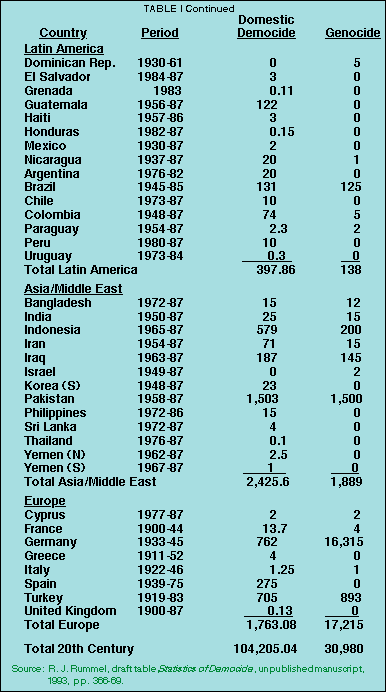
Civilized people view government-sponsored murder as demented, the murderers as sociopaths. But many aspects of life that are immoral are nevertheless explicable by the amoral apparatus of supply and demand. To explore the relationship between democide and demand, one can estimate a crude demand function illustrating the relationship between the quantity demanded and the price. This study takes the midyear of the period over which democide occurred and obtains the value of the real GDP per capita (in 1985 dollars) for that year.8 The sample comprises 31 nations which killed 10,000 or more of their citizens and for which real per capita GDP figures were available.9
"Democidal governments in higher per capita income nations may exercise selfrestraint."
The result is a highly significant association: the higher the productivity, the lower the democide level. There is an inverse relationship between the amount of state-sponsored killing of the domestic population and the "value" of the people being killed. A 1 percent increase in real GDP "buys" about a 1.4 percent decline in democide. The estimated demand function for democide is shown in Figure I.
There is also some evidence that democidal governments in higher per capita income nations exercise some self-restraint. This may even help our understanding of the slowdown in the pace of state killings that occurred in the Soviet Union and China. During the Stalin era in the Soviet Union (1929-53), about 42.7 million people were murdered by the state. About 8.1 million were killed in the 34-year period after Stalin (1954-87). While the latter number is still large, Stalin's pace of killing would have resulted in 63.5 million deaths. Despite the poor performance of socialism, the Soviet Union had experienced economic growth. Comrades were increasingly expensive to liquidate. Thus the decreased rate of killing seems attributable to economics rather than to any civility of the post-Stalin Communist leadership.
The 28-year rule of Mao Tse-tung in China (1949-76) yielded 34.4 million killed. In the post-Mao era (1977-87), characterized by rapid economic growth, 874,000 were killed. Again, the slowdown in the rate of murder may be due to the economic fact that the population was more productive and thus more valuable.
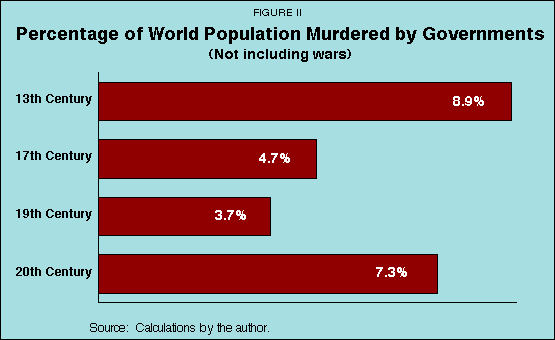
Although very limited historical information exists about state-sponsored murder over the centuries, R. J. Rummel has estimated the number of people murdered by country over time.10 This study uses his data, reworked to obtain an estimate of state-sponsored murder by century. Undoubtedly, the reliability of the data deteriorates the further back one goes in time. Nevertheless, the results indicate the relative scale of democide over the centuries.
"As per capita incomes have risen with industrialization, democide appears to have declined."
Presumably, a decline in the tempo of government-sponsored murder can be taken as an index of an upward trend in civilized behavior. For example, governments murdered about 32.2 million in the 13th century, when the world population was about 360 million. Thus the fraction of the population killed by governments in the 13th century was about 8.9 percent. Gunpowder was not yet available, and presumably killing with cruder weapons was more troublesome. In the 17th century, about 25.6 million were murdered by their governments, representing about 4.7 percent of the population. In the 19th century, when guns were highly developed and widely dispersed, about 44.4 million were killed by their governments, representing about 3.7 percent of the world's population. A resurgence of brutality occurred in the 20th century, raising the overall democide rate to 7.3 percent of the world's population. But this is mainly due to the domestic terror of the Communists and the genocide of Nazi Germany. [See Figure II]
If the murders by the Communist states are subtracted from the total, about 59 million were murdered in this century. Thus state-sponsored killing in the noncommunist world (including the more than 16 million killed by Germany) was about 3.6 percent of the population. On the whole, although the evidence is very crude, it appears that as per capita incomes have risen with industrialization, the relative incidence of democide has declined.
[page]Humans prefer to dominate rather than be dominated. They also tend to distrust and dislike people who are different. These traits often manifest themselves in government, either as official government policy or by toleration of antipathy. The extreme expression of antipathy is murder; its less pernicious expression is discrimination. Civilized societies are committed to the rule of law, which constrains the scale and scope of domination and punishes illegal acts, but the rule of law is not widespread.11 Apart from moral considerations, enmity has economic implications. The extent to which discrimination is practiced depends on its cost to the discriminator, including its legal repercussions.
"Majority groups usually have higher per capita incomes because they
discriminate against minorities."
Among groups of equal productivity, the majority group usually has higher per capita income than minority groups.12 The majority group usually gains this advantage through discrimination, which transfers income from the minority and is a form of rent seeking. The majority resists any rule or policy change that limits discrimination, since it lowers their relative income.
Among authoritarian states, domination and rent seeking by one group over another are often associated with restrictions on occupational choice, denial of educational opportunities, preferences in the licensing of trade, confiscation of land, nationalization of business, restrictions on property ownership and exchange, mobility restrictions and so on. The dominant group has an obvious vested interest in maintaining these sanctioned restrictions. For example, holders of large tracts of land in Asia and Latin America resist peasant pressure for land redistribution and often control governments. Politicians also benefit from maintaining domination; bribery and corruption are endemic throughout the less-developed world and exist in some advanced nations as well.
"A dominant group clings to power in part so it can seek ‘rents'."
Thus part of the motivation for maintaining rule is to protect the rent-seeking capacity of the dominant group. Politicians extract a fee for "renting" the coercive power of the state to that group. The aggregate size of these rents is largely unknown. In one case, it has been estimated that licensed trade in India and Turkey generated rents of about 7.3 and 15 percent of national income, respectively.13 The size of the rulers' fees also is unknown. Anecdotal evidence suggests that some, including Batista, Peron, Marcos, Duvalier and Mobutu, have extracted many millions of dollars.
Measuring the amount of rent seeking in a society is difficult in part because measuring the size and scope of rent-seeking activity is difficult. It also is hard to measure the potential national income lost because special interests capture the trade. For example, in measuring the value of trade licensing, one can compare the prices and volumes of imports under license with what they would be under free trade. But for every winner in the rent-seeking game, many others seek government favor by devoting resources to acquiring it but are unsuccessful.14 Those resources are wasted. They could have been employed in private, productive activity. Some fraction of GDP is not produced as a result of that rent-seeking activity. Where rent seeking is on a grand scale, the lost GDP may be quite large. Thus the rent-seeking losses associated with trade restrictions and other market restrictions ought to include the value of the resources withdrawn from private, productive activity.
My purpose here is to estimate the rents associated with democide. It is quite impossible to know the value (not necessarily pecuniary) of those activities to the officials who have practiced it. But it is possible to crudely calculate lost national output arising from democide. Democide makes life and property insecure and lowers the rate of savings. Reduced capital formation lowers the rate of economic growth. I hypothesize that the path of per capita income in nations that practice democide is below the path of income in nations that do not engage in it. By comparing the divergent paths of per capita income, I estimate the order of magnitude of this form of rent-seeking activity.
[page]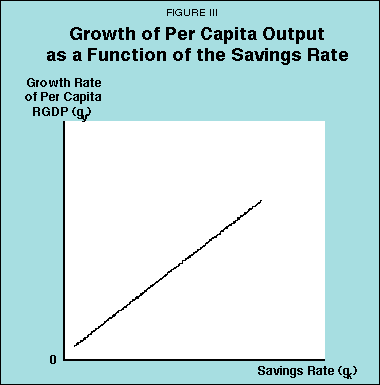
The relationship between the rate of growth of real per capita income (gy = growth rate of output per head) and the savings rate (gk) is shown in Figure III. At high (or low) rates of saving, the growth rate is higher (or lower). [For calculation of the growth paths, see the Technical Appendix]
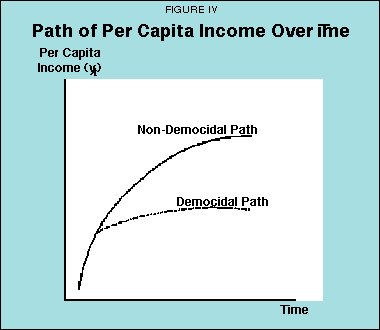
Figure IV illustrates the path of per capita income, yt, over time. It is drawn as a nonlinear function to reflect diminishing returns. Thus growth rates are higher at low levels of per capita income than at high levels.
If some outside shock to the savings rate occurs, such as might arise with democide, the lower savings rate switches the growth path of the economy to a lower level. The time that elapses before the economy returns to its original growth path depends on the circumstances and psychology of the people whose behavior was altered by democide.
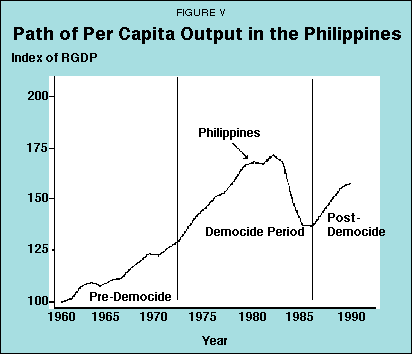
For example, consider the evolution of the path of real GDP per capita in the Philippines from 1960 to 1990, as shown in Figure V. From 1950 to 1972, the economy grew at a per capita compound rate of 2.9 percent per annum. Ferdinand Marcos was elected president in 1965 and reelected in 1969. Facing mandatory retirement in 1973, in September 1972 he declared martial law and suspended the constitution. He lifted martial law in January 1981 but continued to rule by decree. From 1973 to Marcos's demise in 1986, the Philippine economy did not grow. The growth rate averaged -3.0 percent from 1982-86 as the Marcos regime practiced more violence to stay in power. Marcos won the fraudulent 1986 election, but the population rioted and the military eventually backed Corazon Aquino. There were about a half-dozen attempts to topple the Aquino government, but state-sponsored killing stopped and the economy turned upward. The average annual real per capita growth from 1987 to 1990 was 3.6 percent.
In principle, the rent-seeking losses associated with the democide of the Marcos regime can be calculated by comparing the evolution of the economy before and after the democide with its path during the killing. But that comparison would be dubious. Politics has long been violent and dangerous in the Philippines. Political murder is not an infrequent event. We do not know whether the path of per capita income prior to the democide of the Marcos regime was free of political uncertainty or whether the people fully recovered from it after Marcos was overthrown. A better comparison would be with the growth path of countries that were broadly similar to the Philippines in political and economic development but have not experienced democide.
To eliminate intercountry differences in per capita income levels, I converted real GDP data to indexes (1960 = 100) by dividing the income data by the base year.
"Nations with freer institutions grow faster than those with less freedom."
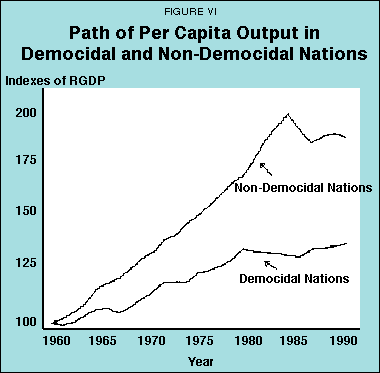
To make comparisons of the growth paths of nations that practice democide and those that do not, a comparison sample is required. These nations should be more or less similar in their stage of economic and political development. In most instances, the nations that have practiced democide are autocratic and less developed. My sample of non-democidal, less-developed and mainly autocratic nations consists of 23 countries.15 A composite index of per capita real GDP was obtained by weighting each real GDP by its population share and summing to form a weighted mean for the series.
There are 33 democidal nations in my sample.16 I converted these 33 nations into a representative democidal nation by weighting each nation's real GDP by its population share, summing and then converting the real GDP into an index (1960 = 100).
Figure VI compares the two indexes of the paths of per capita real GDP. Clearly, the path of income in the democidal nations is below that of the non-democidal, autocratic nations. Dividing the index of per capita real GDP of the democidal nations by that of the non-democidal nations yielded an average value of .81. Democidal rent seeking then is estimated at 19.2 percent of real GDP (1 – .808).
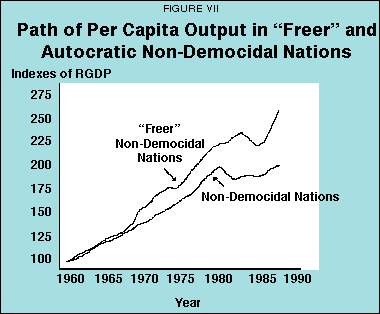
To make sure that the result is not a function of the 23 nations chosen for the comparison sample, I constructed a sample of 11 other mostly freer, less-developed, non-democidal nations.17 I composed this index in the same way as the others and present it in Figure VII. Observe that the composite index for the 11 freer nations is above that of the 23 autocratic nations. This result is not surprising, since nations with freer institutions have been shown to grow more rapidly than those with less freedom.18
It is possible that the effect of democide on the path of real per capita income is not uniform across countries or continents. The scale of democide may differ, people's attitudes toward it may vary (e.g., some may be more stoic; genocide may be less disagreeable to the dominant group than a general terror), and some may be better informed about what is occurring than others due to differing levels of literacy and government control of the media.
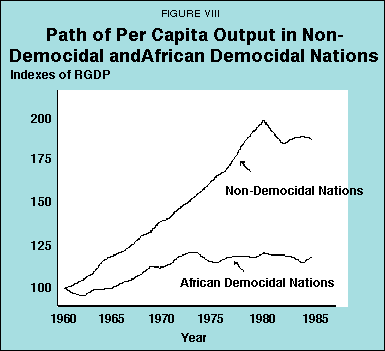
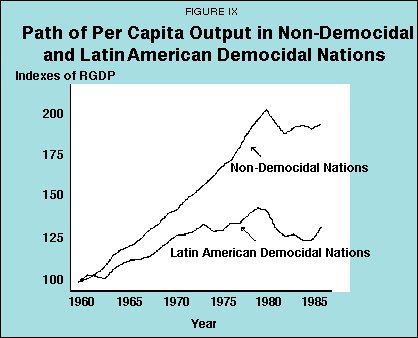
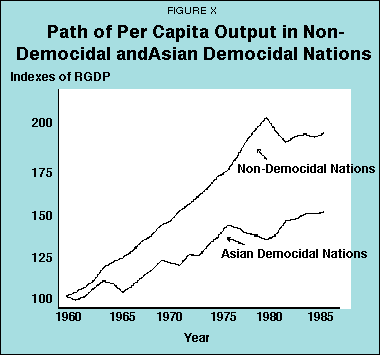
Figures VIII, IX and X compare the composite indexes of the democidal nations of Africa, Latin America and Asia with that of the 23 non-democidal nations. There is a ranking among the groups, but it is not very strong. Africa's economies have suffered the most. Democidal rent seeking is estimated at 24.7 percent of real GDP per capita in Africa, 18.6 percent in Asia and 18.0 percent in Latin America.
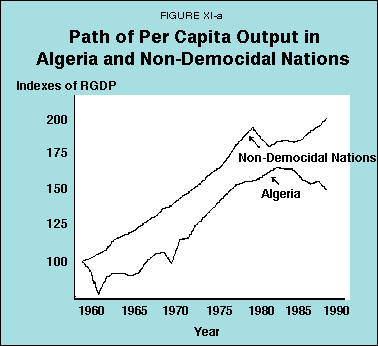
To get a feel for the range of outcomes among democidal nations, in Tables I and Table I Continued the paths of the indexes of per capita income in eight democidal nations are compared with the composite index of 23 non-democidal nations.
In Figures XI-a, XI-b, XI-c and XI-d, four African nations are compared. Terror was the principal form of democide in Algeria and Angola. Burundi and Rwanda suffered from genocide. Democidal rents averaged 19.1 percent over the period 1960-90 in Algeria and 61.6 percent in Angola over the period 1975-89. About 50,000 were murdered by the Algerian state in the late 1950s and early 1960s, but democidal terror continued at a lower level thereafter. In Angola, about 125,000 were murdered between 1975 and 1987. Democidal rents averaged 54.8 percent in Burundi over the period 1965-90, when about 150,000 were murdered, mainly in the Hutu genocide. Democidal rents averaged 27.0 percent in Rwanda over the period 1962-90; about 15,000 were murdered in genocide campaigns over the period 1962-73 and an additional 500,000 people in 1994.19
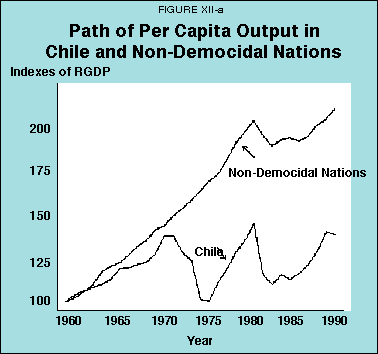
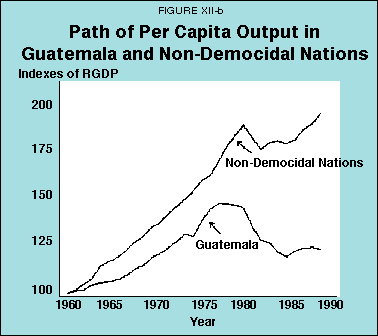
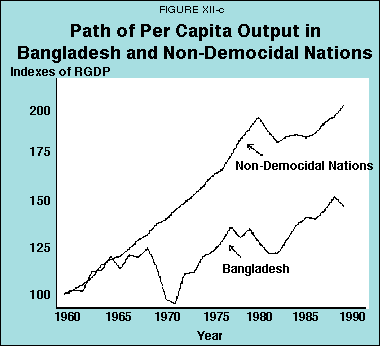
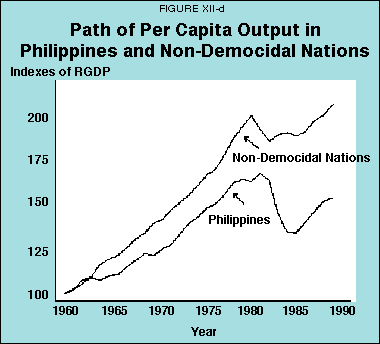
In Figures XII-a, XII-b, XII-c and XII-d, the effect of democide is shown for two Latin American and two Asian nations. During the Pinochet terror in Chile, which lasted from 1973 to 1987, some 10,000 were murdered. The average democidal rent over the period 1973-90 was 35.2 percent. In Guatemala, over the period 1956-87, 122,000 were murdered in terror campaigns and massacres. The average democidal rent over the period 1960-90 was 18.8 percent. Genocide was the main form of democide in Bangladesh. Over the period 1972-87, about 15,000 were killed. Democidal rent averaged 29.1 percent over the period 1972-90. In the Philippines (1972-86) about 15,000 were murdered.20 Democidal rent (1972-90) averaged 18.2 percent.
"Except in Communist nations, the rate of democide has declined."
Democide and genocide are seemly activities of dominant group and authoritarian rule. State-sponsored murder on a large scale has a long history. Despite crude weaponry, the Chinese emperors from the Chin dynasty (221 B.C.) to the Ching (1911), exclusive of the Mongols, murdered about 33.5 million. The Mongols in the 14th and 15th centuries killed about 30 million.21 But, exclusive of Communist democide, the rate of state-sponsored murder has declined. I hypothesize that this was due to the historical rise in human productivity, which made the cost in terms of lost GDP too high to continue the killing on a grand scale.
A demand function for democide was estimated for a sample of nations in the post-World War II period. The relationship between the quantity of killing and per capita output was found to be highly significant. To estimate rent-seeking losses associated with democide, I compared the growth paths of the democidal nations with those of a comparable group of non-democidal nations. On average, democide is associated with about a 20 percent loss of wealth.
NOTE: Nothing written here should be construed as necessarily reflecting the views of the National Center for Policy Analysis or as an attempt to aid or hinder the passage of any bill before Congress.
[page]To determine the growth paths in democidal countries, let the economy be described by a simple Cobb-Douglas production function: Y = KßL1-ß. Let the fraction of output saved be s. The annual increment in the capital stock is the amount saved, sY. The annual growth rate of the capital stock, gK, is s(Y/K). Then, in terms of the production function the rate of growth of national output is:
gY = (1 + gK)ß (1 + gL)1-ß -1
= (1 + sY/K)ß (1 + gL)1-ß – 1. (1)
The effect of a change in the savings rate on the rate of growth of output is:
dgY = [(K + sY)ß-1 ßY K-ß (1 + gL)1-ß] ds. (2)
The sign of dgY depends only upon the sign of ds, since the term in brackets is positive.
Since we are using data on per capita RGDP, the relationship is restructured in per capita terms. The corresponding equation for the growth rate of output per head, gy, is:
gy = [(1 + gK)/(1 + gL)]ß -1
= [(1 + sY/K)/ (1 + gL)]ß – 1. (3)
The effect of a change in the savings rate on the rate of growth of per capita output is:
dgy = [(K + sY)ß -1ßY K-ß(1 + gL)-ß] ds. (4)
[page]-
R. J. Rummel, "Appendices: Centi-Kilo Murders, 1900-1987," unpublished, Haiku Institute of Peace Research, 1993, pp. 6-9.
- Rummel estimates that 350,000 were murdered during the Spanish Inquisition. "Pre-20th Century Government Killing," unpublished manuscript, University of Hawaii at Manoa, Honolulu, HA, p. 31. He estimates that 1.6 million were murdered during China's Cultural Revolution. Ibid., p. 10.
- Ibid.
- Thus genocide is one type of democide. For example, from 1966 through 1987, there were 150,000 murders by the state in Burundi; this democide was also genocide because the tribe that dominated the government killed members of another tribe.
- Rummel, "Libertarianism and International Violence," Journal of Conflict Resolution, Vol. 27, No. 1, pp. 27-71. Not all countries are included in Table I, so the total differs from totals mentioned in the text of this study.
- Rummel, "Appendices: Centi-Kilo Murders, 1900-1987," p. 11.
- Rent seeking is the use of government to improve one's economic position beyond what one could gain in the marketplace. Rent is the amount of gain.
- The estimate of killing in China was confined to the regime of Mao Tse-tung. The killing in Rwanda was estimated at 500,000 in 1994. The GDP data are from R. Summers and A. Heston, "The Penn World Table (Mark 5): An Expanded Set of International Comparisons, 1950-1988," Quarterly Journal of Economics, 1991, pp. 327-68.
- (1) The regression in logarithmic form was:
Log DEMOCIDE = 22.2153 – 1.4411 Log RGDP, R2 = .488.
(11.59) (5.44) - Rummel, "Appendices: Centi-Kilo Murders, 1900-1987."
- G. W. Scully, Constitutional Environments and Economic Growth (Princeton, NJ: Princeton University Press, 1992), pp. 148-65.
- Gary S. Becker, The Economics of Discrimination (Chicago: University of Chicago Press, 1957).
- A. O. Krueger, "The Political Economy of the Rent-Seeking Society," American Economic Review, 1974, Vol. 64, pp. 291-303.
- G. Tullock, "The Welfare Costs of Tariffs, Monopolies, and Theft," Western Economic Journal, 1967, Vol. 5, pp. 224-32.
- Data for the period 1960-90 were available for the following nations. Africa: Burkina Faso, Cameroon, Egypt, Ivory Coast, Lesotho, Madagascar, Malawi, Mali, Mauritania, Morocco, Senegal, Togo, Tunisia, Zambia and Zimbabwe. Latin America: Dominican Republic, Mexico, Panama, Ecuador and Venezuela. Asia: Jordan, Taiwan and Thailand.
- These nations are as follows. Africa: Algeria, Angola, Burundi, Central African Republic, Chad, Ethiopia, Guinea, Kenya, Liberia, Mozambique, Rwanda, Uganda and Zaire. Latin America: El Salvador, Guatemala, Haiti, Honduras, Nicaragua, Argentina, Bolivia, Chile, Colombia, Paraguay, Peru and Uruguay. Asia: Bangladesh, India, Iran, Iraq, Myanmar (Burma), Pakistan, Philippines and Sri Lanka.
- This sample consisted of Botswana, Cape Verde Islands, Seychelles, Swaziland, Barbados, Costa Rica, Jamaica, Puerto Rico, Malaysia, Malta and Fiji.
- Scully, Constitutional Environments and Economic Growth.
- R. J. Rummel, draft table, Statistics of Democide, unpublished manuscript, 1993, pp. 366, 368.
- Rummel, Statistics of Democide, pp. 366-69.
- Rummel, "Pre-20th Century Government Killing," p. 31.
Gerald W. Scully is a Senior Fellow of the National Center for Policy Analysis and a professor of economics in the School of Management at the University of Texas at Dallas. His articles have appeared in the American Economic Review, the Journal of Political Economy, the Journal of Law and Economics, Public Choice and other scholarly journals. Dr. Scully is also an expert on the economics of sports. His most recent book is The Market Structure of Sports.