America's elderly retirement programs are based on pay-as-you-go financing. Taxes collected today are used to pay benefits to today's retirees. Each generation of retirees depends on the government to provide Social Security and health care benefits by taxing the next generation. But in America, as in most other developed countries, the number of taxpaying workers for every retiree is falling and is expected to continue falling. This implies that the tax burden for workers will continue to rise indefinitely into the future. As a result, our pay-as-you-go approach to elderly entitlements is on a collision course with reality.
Social Security Administration actuaries make projections about the future of Social Security that are contained in the annual report of the trustees. These projections are labeled "intermediate," "low cost" (optimistic) and "high cost" (pessimistic). Although people are encouraged to assume that the intermediate forecast is the most likely, many students of Social Security and Medicare believe that the pessimistic projection more closely reflects our recent experience.
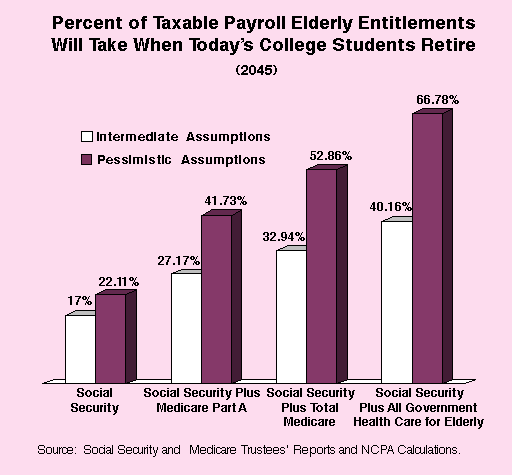
Spending on Social Security currently takes about 11.5 percent of the nation's taxable payroll. If both parts of Medicare (Parts A and B) are also expressed as a percent of taxable payroll, they take about 5.5 percent. In the future both programs will require more:
- By the year 2045, when today's 20-year-old college student will be eligible for Social Security, the fraction of employee earnings needed to pay Social Security benefits will be almost 50 percent higher than at present, according to the intermediate forecast.
- We will need almost one-third of workers' incomes to pay Social Security plus all of Medicare.
Nor is this the worst that can happen:
- Under the pessimistic forecast, by the time today's college students retire the Social Security tax burden will be almost twice its current level.
- Almost 53 percent of the entire taxable payroll will be required just to fund Social Security and Medicare benefits already promised the elderly under current law.
Medicare pays only about one-third of elderly health care costs. The government also pays medical bills of the elderly through Medicaid (for the poor), the Veterans Administration system and other programs. When this additional spending is taken into consideration, the burden for future taxpayers will be even higher:
- Under the intermediate assumptions, 40 percent of the income of workers will be needed to pay retirement benefits to today's college students.
- Under the pessimistic assumptions, the amount will be more than two-thirds of workers' incomes!
Reformers tend to fall into two camps: those who want to preserve the current system's chain-letter structure and patch its defects, and those who want to reform the system in a fundamental way. The underlying strategy of proposals for patchwork reform is to cut benefits, raise taxes or both. However, almost every patchwork reform idea has severe drawbacks. Some countries have already chosen more fundamental reforms.
- Britain allows employers and workers to opt out of the second tier of the state pension system by setting up private pension plans with benefits at least as generous as those promised under the government system.
- Australia requires workers to contribute to privately managed retirement savings plans.
- Chile requires workers to save for their own retirement by making regular deposits to private pension accounts, similar to American Individual Retirement Accounts (IRAs).
- The Chilean system has been copied to one degree or another in Argentina, Bolivia, Colombia, Costa Rica, Hong Kong, Mexico, Peru and Uruguay, and it will soon be implemented in Ecuador and El Salvador.
- Singapore requires employees and employers to contribute jointly to individual investment accounts, which may be used not only for retirement income but also to pay medical expenses, make the down payment on a home or send a child to college.
These privatized systems are fully funded, and each generation provides for its own retirement. The systems avert the long-term financial crisis inherent in a chain-letter approach. They also encourage saving, which in turn generates higher economic growth.
[page]The very first recipient of Social Security1 in the United States was Ida Fuller, a legal secretary who retired in 1940. Before retirement, Miss Fuller and her employer had paid only $45.08 in Social Security taxes. By the time she died at age 100, she had collected more than $20,000 in Social Security benefits.2
The year Ida Fuller retired, there were 42 workers for every retiree. That's why the tax rate needed back then was only 2 percent on the first $3,000 of wages. By the time Miss Fuller received the first cost-of-living increase in 1951, there were 16 workers for every retiree. And by the time she died in 1975, the ratio had fallen to 3.2 workers for every beneficiary.3 For the future, things look bleak. By the middle of the next century, the ratio is expected to fall still further, with only 1.5 to 2 workers for every beneficiary. That means each worker will be supporting two-thirds of the cost of an elderly person in addition to all other taxes and all other family responsibilities.4
"As America's population ages, the burden of elderly entitlements is on a collision course with reality."
As America's population ages, the system of income maintenance and health care for the elderly is on a collision course with reality. Longer lifespans and lower fertility rates will lead to fewer workers paying taxes to support a growing number of the elderly. Higher health care costs will add to the burden. The key to understanding how these forces affect elderly retirement programs is to recognize that the programs are all based on pay-as-you-go financing. Taxes collected today are used to pay benefits to today's retirees. Each generation of retirees depends on the government to provide its Social Security and health care benefits by taxing the next generation. If we continue this practice, the burden we create for tomorrow's workers will be impossible for them to bear.
This study is based on official forecasts by the Social Security Administration and the Health Care Financing Administration, which administers Medicare.
[page]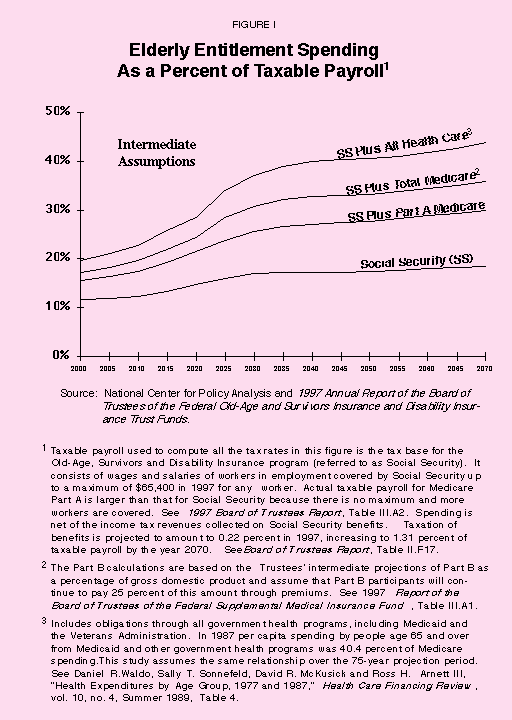
The U.S. Social Security system was born in 1935, during the Great Depression, as a tax-supported system of old-age and survivors' pensions. A payroll tax, half on the employee and half on the employer, was implemented in 1937 to fund Social Security. The initial legislation covered only workers, but was amended in 1939 to include family members and survivors. The program was expanded in 1956 to include disabled workers.
In 1965 Medicare was established to provide health care to the elderly. There were two parts: hospital insurance (Medicare Part A), funded by an additional payroll tax, and Supplementary Medical Insurance (Medicare Part B) to cover physicians' services and outpatient care, funded by a combination of premiums paid by the elderly and funds from general revenues.5 This study's calculations assume that premiums will continue to cover 25 percent of Part B costs.
"Future workers will pay a larger share of their income just to support the elderly than today's workers pay to fund all government services."
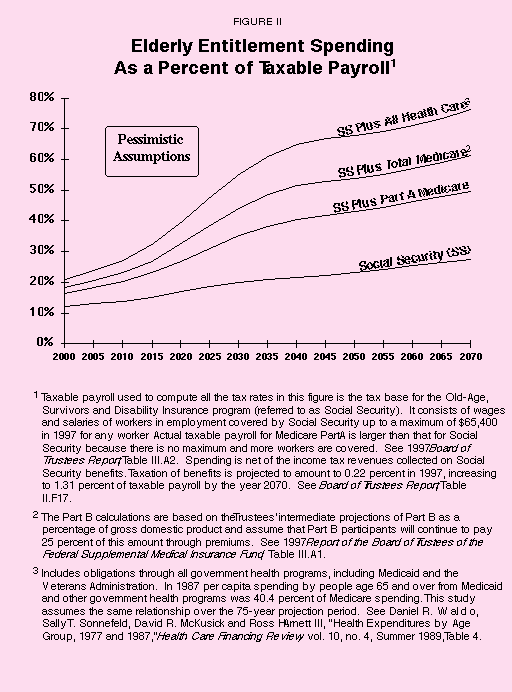
Social Security and Medicare actuaries make projections about the future of the programs that are contained in the annual reports of the trustees. These projections are labeled "intermediate," "low cost" (optimistic) and "high cost" (pessimistic). Although people are encouraged to assume that the intermediate forecast is the most likely, many students of Social Security and Medicare believe that the pessimistic projection more closely reflects our recent experience. Figures I and II show how bad the future looks for the United States under the intermediate and pessimistic forecasts. These figures show the percentage of the nation's taxable payroll that will be required to pay benefits each year under the current system of government-paid elderly retirement and health care benefits.6
Intermediate Forecast. Currently, spending on Social Security is about 11.5 percent of the nation's total taxable payroll. Social Security and both parts of Medicare combined take about 17 percent. But consider the year 2045. A 20-year-old college student in 1998 will reach the age of eligibility for Social Security (which will then be 67) in that year. As shown in Figure I (and Appendix Table I):
- According to the intermediate forecast, the fraction of employee earnings we will need in 2045 to pay Social Security benefits will be almost 50 percent higher than today.
- We will need almost one-third of workers' incomes in order to pay Social Security plus both parts of Medicare.
Two things are especially worth noting about this projection. First, although the public focus has been almost exclusively on Social Security, government actuaries forecast that the burden of Medicare will be almost as large as the burden of Social Security. Second, future workers will pay a larger share of their income just to support the elderly than today's workers pay to fund all government services, including programs for the elderly and the poor, national defense, highways, etc.
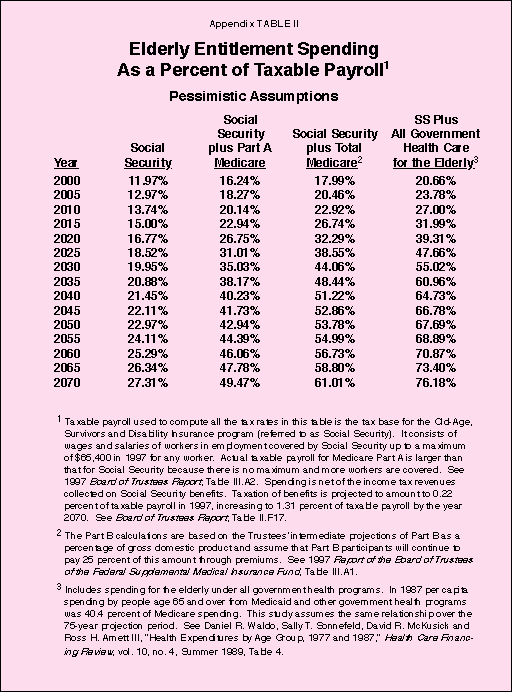
Pessimistic Forecast. Nor, as shown in Figure II (and Appendix Table II), is this the worst that can happen.
- Under the pessimistic forecast, by 2045 the Social Security tax burden will be almost twice its current level.
- Almost 53 percent of the entire taxable payroll will be required just to fund Social Security and Medicare benefits already promised the elderly under current law.
Under the pessimistic forecast, we have already pledged more than half the income of future workers without regard to any personal needs the workers and their families may have and without regard to the need to fund any other government program!
"Under intermediate assumptions, 40 percent of workers' incomes will go to the elderly by 2045."
Taking a Closer Look at Medicare. In recent years, health care costs have been increasing at twice the rate of real wages. Were this trend to continue, health care spending would consume the entire gross domestic product by the middle of the next century. The Trustees understand that this is impossible. To get around the problem, they have arbitrarily assumed in the intermediate forecast that health care costs will grow faster than taxable payroll until 2020, but thereafter will rise at the same rate as hourly wages. The optimistic forecast assumes an annual increase 2 percent less and the pessimistic forecast assumes an annual increase 2 percent more than hourly wages. But even the optimistic and pessimistic forecasts assume that the difference diminishes gradually until all three forecasts mirror the rate of growth of wages beginning in 2046.7
As with Medicare Part A, the Trustees have arbitrarily restricted the growth rate of medical costs for Part B. The intermediate forecast for Medicare Part B projects that the increase in health care costs per enrollee will gradually decline after 2010 until it reaches the same growth rate as gross domestic product per capita in 2021, where it will remain for the next 50 years. The optimistic and pessimistic forecasts assume initial growth rates 2 percentage points lower and 2 percentage points higher, respectively, diminishing gradually until all three assumptions show health care costs growing at the same rate as GDP per capita by 2021.8
"Under the pessimistic assumptions, more than twothirds of workers' incomes will go to the elderly by 2045."
Other Health Care Spending. Medicare is not the only way we pay the medical bills of the elderly. We also pay through Medicaid (for the poor), the Veterans Administration (VA) system and other programs. No matter what pocket the funds come from, however, the overall burden the elderly create for working-age taxpayers remains the same. To assess the total burden, health economists at the National Center for Policy Analysis have estimated elderly health care expenses borne through all government transfer programs.9 The projections when all government spending on the elderly is considered [see the final column of Appendix Tables I and II] are:
- Under the intermediate assumptions, 40 percent of the income of workers will go to Social Security and government-provided health care for the elderly by 2045.
- Under the pessimistic assumptions, the amount will be more than two-thirds of workers' incomes.
The Problem of Tax Collection. The forecasts in Figure I and II and Appendix Tables I and II are "static" forecasts that assume higher payroll tax rates will generate increased government revenues with no change in economic behavior. For example, the forecasts assume that taxable payroll in the future will be the same, whether the tax rate is 15 percent or 80 percent. However, experience shows that in the face of higher tax rates, people work less and avoid or evade taxes more. The higher rates would reduce economic activity and slow economic growth, so to collect the revenues needed, actual tax rates would have to be even higher – perhaps as much as another one-third. Even if an attempt were made to impose tax rates of that magnitude, no serious economist thinks that the government can collect that much in payroll taxes for any purpose, certainly not for the purpose of redistributing the money to strangers.
We have had little experience with tax rates 40 percent and more for middle-income taxpayers, but we have had a lot of experience with tax rates above that figure for the highest-income earners. In general, whenever we have increased the rate for the highest-income earners, their total tax payments have gone down. In other words, beyond a certain point, higher tax rates collect no additional revenue.10
[page]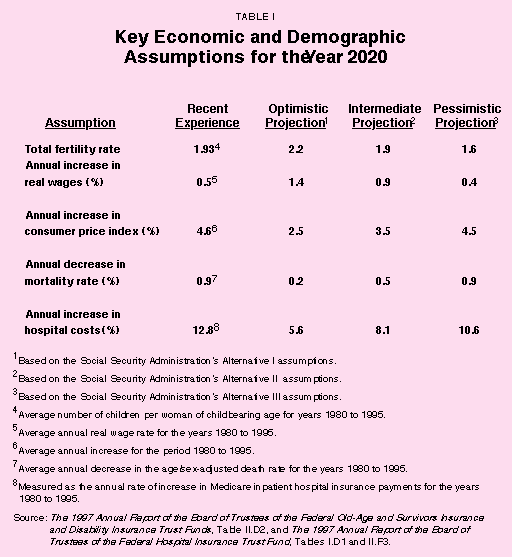
"Although a fertility rate of 2.1 is needed to replace the population, the current rate is about 1.9 and it has been as low as 1.8."
Obviously a lot of guesswork is involved in projecting what will happen 40 or 50 years from now. But just as private pension experts advise people to plan when they are young for pensions payable at 65, people who plan on drawing Social Security benefits in 45 or 50 years need to be concerned about the system's future now. One of the most important things to know about the future is how many young workers will be supporting how many old retirees. In 1940, when the first Social Security check was paid, there were 42 workers for every retiree. Today the ratio is 3.3 to 1. The Trustees' intermediate assumptions project that the ratio will fall to two workers for every retiree by the middle of the next century. The pessimistic assumptions put the ratio at 1.5 to 1. The ratio has been falling because Americans are having fewer children and those are living longer. There are three main causes of this projected decline: a lower fertility rate, longer life expectancy and advances in medical science.
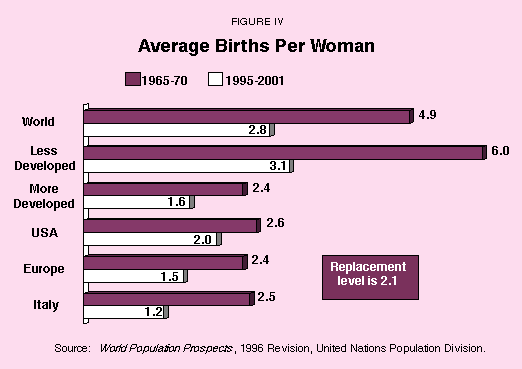
The U.S. Fertility Rate. The country's fertility rate is the number of children women of childbearing age will have over their lifetime. To replace the population, that rate must be 2.1. In other words, to keep the population at its current size each woman must have an average of two children to replace one adult male and one adult female. (The reason for the .1 is to make up for children who do not live to adulthood.) The U.S. fertility rate currently is about 1.9, and it recently has been as low as 1.8.11 If it remains below the replacement rate, the implications for the future of Social Security are dramatic. As Table I shows, the Social Security Administration's intermediate projection is for the fertility rate to continue to be 1.9 in 2020. The pessimistic projection is 1.6. Only the optimistic projection exceeds the replacement rate, at 2.2. A country with a fertility rate below 2.1 eventually will see its population shrink. Along the way, the number of old people relative to young will grow continuously. That means the tax burden on the young will grow indefinitely.
"The U.S. population 100 years from now may be only slightly larger than it is today."
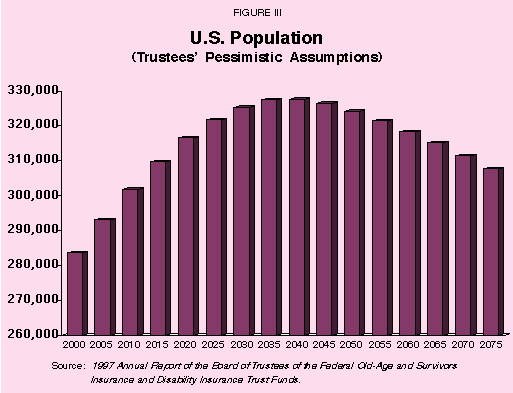
According to the pessimistic forecast, the U.S. population will peak before today's college students retire and then will begin to decline. [See Figure III.] By this projection, 100 years from now the population of the U.S. will be only slightly larger than it is today.12 But there will be one major difference. Whereas today most people are young, a century from now one out of three people will be old.13
Couldn't women choose to have more children in the future? That is possible. But don't count on it. Since 1960 the fertility rate has fallen substantially throughout the world. Virtually every developed country is now below the replacement rate (Ireland is the exception).14 The average fertility rate for Europe is only 1.5. [See Figure IV.] In Italy the rate is 1.2, the lowest in the world. In Japan it's 1.5. There are reasons to think this is not just a fad. The secular decline in fertility stretches back a hundred years.15 Demographers do not expect a reversal of the trend.
"When Social Security began, the average male could expect to die 3.5 years before he qualified for benefits."
Even less-developed countries have seen the fertility rate plunge from 6.0 to 3.1 in the past 30 years. And some demographers now seriously propose that the world's population may reach a peak of about 7.7 billion around 2040 – the current population is believed to be about 5.8 billion – and then begin a long-term decline.16 Were this to occur, it would make pay-as-you-go retirement systems in virtually all countries unsustainable.
Life Expectancy. The year Ida Fuller received her first Social Security check, life expectancy at birth was 61.4 years for men and 65.7 years for women. The average male could expect to pay taxes over his entire work life and die 3.5 years before he qualified for benefits.17 The average female could expect to collect benefits for only a few months. Reaching the retirement age of 65 was viewed as an adverse contingency – something like becoming disabled. Supporting the few people who would be so afflicted seemed easily affordable.
Today, of course, things are different. Life expectancy at birth is 72.6 years for men and 79.3 years for women.18 And every demographer expects years of life in old age to grow. Based on intermediate projections, when today's college students reach retirement age a male at birth will expect to live as many as 77.2 years and a female as many as 82.7.19 A number of analysts believe life expectancy may reach 90 or 95 by that time.
"By the time today's college students reach their mid-50s, one out of five people will be old."
Medical Science. As people get older, they consume more health care. Although the elderly today constitute only 12 percent of the population, they account for about one-third of all health care spending. By the time today's college students reach their mid-50s, one out of five people will be old and they will consume as much as two-thirds of our health care resources.20 Even with existing technology, health care for the elderly will be expensive. How much more expensive will new techniques be?
Fifty years ago, no one could have imagined the medical procedures that are commonplace today. Similarly, we cannot predict what medical science will achieve over the next 50 years. However, we do have two advantages over forecasters in the past. First, we know that modern society has given medical researchers a blank check. Implicitly we have told them: invent it and show us that it improves health care, and we will buy it. As a result, we have virtually guaranteed that the medical research and development industry will work hard at making new discoveries that will cost us more money. Second, we have a fairly good idea of the direction in which medical science will progress.
For example, it is virtually inevitable that scientists will produce a complete mapping of the genetic code. The only question is when. Because many life-threatening diseases are related to our genetic resistance to them, an understanding of individual genetic makeup opens the door to the prevention of disease by artificial intervention. For example, Americans are constantly exposed to carcinogens. They occur naturally in the food we eat, the water we drink and the air we breathe. But some people, partly because of their genetic endowment, resist exposure better than others.21 Once we understand the mechanism of susceptibility or resistance (which probably will not require a complete understanding of the genetic code), we will be able to sharply reduce and perhaps eliminate death from cancer.
"Most countries with pay-as-you-go retirement systems do not have trust funds, and the United States would probably be wise to follow their example."
The greatest uncertainty is what the achievements of modern science will do to the future financial burden of income maintenance and health care for the elderly. For example, heart disease, cancer and strokes currently account for 65 percent of all deaths among the elderly.22 Moreover, these three diseases are responsible for 40 percent of all hospital days and 50 percent of all days spent in bed.23 If we could eliminate all three diseases, we would also eliminate three major categories of health care spending. But it is not clear that our total financial burden would go down, for the elderly would live longer and collect more Social Security checks. They would then eventually die of some other – possibly expensive-to-treat – disease. One of the ironies of this issue is that what's good for people is bad for the Social Security system, and vice versa.
[page]Money to pay Social Security and Medicare Part A benefits to retirees comes from the 15.3 percent payroll tax on current workers. (Workers and employers each pay 6.2 percent of earnings up to $65,400 for Social Security and 1.45 percent of all earnings for Medicare.) Payroll tax collections currently exceed benefit payments. The surplus is credited to Social Security and Medicare trust funds and is then borrowed by the federal government in exchange for special, nonnegotiable Treasury bonds.
Most countries with pay-as-you-go retirement systems do not have trust funds, and the United States would probably be wise to follow their example. The trust funds not only mislead people – who think their taxes are actually being invested in something – but also distract attention from the real funding problem. Every payroll tax check sent to Washington is written to the U.S. Treasury. Every Social Security benefit check is written on the U.S. Treasury. The trust funds do not collect taxes, nor do they pay benefits. Technically, they hold interest-bearing bonds that represent the accounting surplus of payroll taxes collected minus benefits paid. But the Social Security trustees cannot sell the bonds on Wall Street or to a foreign investor. They can only return them to the Treasury. In this sense, the bonds are nothing more than IOUs the government has written to itself.
On paper, the Social Security trust funds have enough IOUs to "pay" Social Security benefits for about 17 months on any given day; the Medicare trust fund can "pay" benefits for about one year. In reality, they cannot pay anything. Every asset of the trust funds is a liability of the Treasury. For the Treasury to write a check, it must first tax or borrow.
If the trust funds were simply abolished, real economic activity would be unaffected. No private bondholders would suffer. The government would not be relieved of any of its existing obligations or commitments. Economist Robert Eisner has suggested that we abolish the trust funds or, with the stroke of a pen, double or triple the number of IOUs they hold.24 Either option would allow us to dispense with artificial crises and get on to the real problem: how is the Treasury going to pay the government's bills?
[page]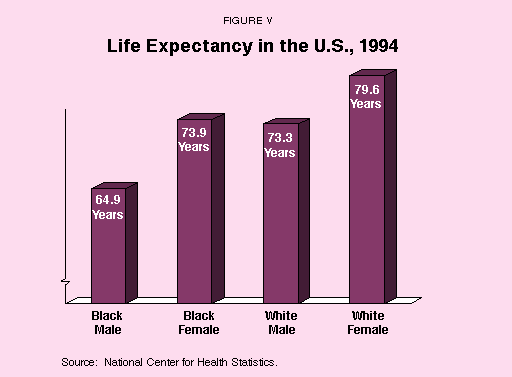
Is Social Security a program we would want to continue if it weren't in crisis? If we could go back in time and do it all over again, would we set up the system we have today? Or would we opt for something completely different?
"The payroll tax is highly regressive."
For most of its history, Social Security has been viewed as an antipoverty program. It was the crown jewel of the Roosevelt-era liberal welfare state. And Social Security checks still shield many elderly people from poverty. Sixty-six percent of elderly beneficiaries rely on Social Security for more than half their income.25 Thirty percent get 90 percent or more of their income from Social Security.26
Regressive Taxes. However, Social Security is much less progressive than first impressions suggest. Take the FICA payroll tax, which is now a larger burden than the income tax for 76 percent of taxpayers.27 The payroll tax is highly regressive – taking a larger percentage bite out of the pay of lower-income workers – for two reasons. First, although the 2.9 percent Medicare tax has no cap, the remaining 12.4 percent tax (for retirement and disabilities) applies only to the first $65,400 of wages in 1997. While low- and moderate-wage earners pay 12.4 percent of their income, those earning $1 million pay less than 1 percent. Second, the tax applies only to wage income, not capital income (rent, interest, dividends, profit), penalizing people who receive almost all their income as wages.
"Any system that makes benefits conditional on reaching old age has a builtin bias against the poor."
Regressive Benefits. On the benefit side, the system is skewed in the other direction. Benefits as a percent of preretirement earnings are lower for those who earned more during their working years. For retirees in 1996, Social Security could be expected to replace about 42.4 percent of preretirement income of the average-wage worker, 57.1 percent of that of the low-wage worker and 25.6 percent of that of the high-wage worker. But any system that makes benefits conditional on reaching old age has a built-in bias against the poor. Low-income people have higher mortality rates and shorter life expectancies. Moreover, in absolute dollars high-income earners get more. Social Security paid a rich retiree $15,912 in 1997, while a low-income retiree got less than half that amount ($6,255). Social Security pays the highest benefits to those who least need government help.
Effects on Minorities. Because blacks die earlier than whites, they can expect to collect fewer Social Security benefits.28 For example, as Figure V shows, the life expectancy of a black male is currently 64.9 years. This means that a black male at birth can expect to pay Social Security taxes for his entire work life, but collect less than nine months of benefits. Prospects are better for black females, but their life expectancy of 73.9 years is less than the 79.6 years for a white female.29 Further, a smaller proportion of blacks go to college, so blacks as a group begin their working lives earlier and thus start paying payroll taxes sooner than whites. But they receive no additional benefits for working longer because Social Security benefits are based on the last 35 years of work history.30
"The elderly have considerably more wealth than do those under age 65."
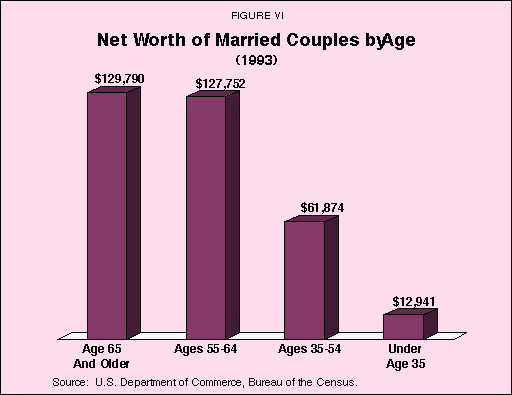
Transfers from the Poor to the Rich. There are other facts to consider. On the average, the elderly have considerably more wealth than do those under age 65. For example, as Figure VI shows, elderly married-couple households had a median net worth of $129,790 in 1993, compared to $127,752 for those ages 55-64, $61,874 for those ages 35-54 and $12,941 for those under age 35.31 Single elderly householders also had higher net worths than younger ones. As an income transfer program, Social Security takes from those who have less and gives to those who have more.
"Even low-income retirees could have had almost 2 1/2 times the retirement income had they invested their taxes in the stock market."
Private Alternatives. If people had not paid Social Security taxes, they could have invested the same dollars in stocks and bonds. According to one calculation, someone earning the maximum taxable wage could have had more than three times the income paid by Social Security if their Social Security taxes were invested in the stock market. Investments in the bond market would have produced a 73 percent higher monthly pension check. Even low-income retirees (who are supposed to benefit from Social Security's "progressive" benefit formula) could have had almost 2 1/2 times the retirement income had they invested their taxes in stocks.32 [See Figure VII.]
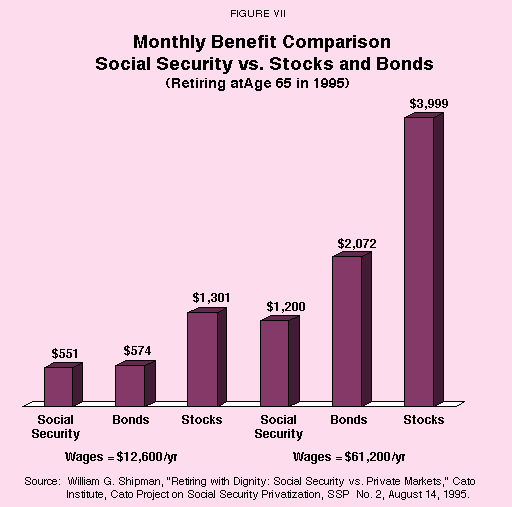
Wages represent a higher proportion of the poor worker's income, so the payroll tax, which applies only to wages, takes a higher percentage of that worker's total income. Thus that worker is further disadvantaged by having to "invest" such a high proportion of income in Social Security taxes rather than private investments with a higher return.33
[page]Nobel laureate Paul Samuelson once called Social Security "a Ponzi scheme that works." We now know that it doesn't work. So what can be done? Reformers tend to fall into two camps: those who want to preserve the system's basic chain-letter structure and patch its defects, and those who want to reform the system in a fundamental way.
Patchwork reform comes in many guises, but the underlying strategy of all is the same: cut benefits and/or raise taxes. Since overt benefits cuts are unpopular, reformers usually talk about indirect ways of achieving the same result. And since taxpayers are sure to resist tax hikes, reformers usually search for some way to increase the tax base or to include new taxpayers. However, almost every important reform idea has severe drawbacks.
Raising the Retirement Age. The official retirement age of 65 is already scheduled to rise gradually to 67 for people reaching retirement in the next century, thanks to Federal Reserve Chairman Alan Greenspan, who chaired the commission that brought about the reform in 1983.34 Some people want to go further – to increase the retirement age to 70, do the same for Medicare and index the eligibility age to rise with increases in life expectancy.
"Raising the retirement age has an adverse impact on minorities."
Yet this apparently innocuous reform faces two big problems. First, it is in direct conflict with people's preferences. The trend over the past 50 years has been toward earlier rather than later retirement, and that is unlikely to change.35 Second, raising the retirement age has an adverse impact on minorities. As noted above, blacks have shorter life expectancies than whites. So do Hispanics. The two-year increase in the retirement age already scheduled will first affect people born in 1960. Among this group, the scheduled increase will take away only about a fifth of each expected Social Security benefit check for white males but will extinguish about two-thirds of benefits for black males. Raising the retirement age to 70 would exacerbate the inequity for minorities.
Means Testing Benefits. At last count, more than 800,000 millionaires were collecting Social Security benefits. Is this fair? Why should Ross Perot receive government checks funded by day laborers? Why not cut off benefits for those well-off retirees who do not need a government pension? One problem is fairness. After all, Ross Perot has paid taxes just like everybody else. A bigger problem is that Social Security checks going to very rich retirees are a mere drop in the bucket. To make a serious dent in the flow of benefits, you would have to touch retirees who are solidly middle class. For example, government currently taxes 85 percent of Social Security benefits for higher-income retirees. But it defines "higher income" as single retirees with incomes above $25,000 and couples above $44,000. Even this tax on the middle-income elderly raises less than $6 billion a year, while Social Security and Medicare spending total $524 billion.36
Inflation Indexing. Social Security benefits are currently indexed to increase over time with the rate of inflation. Most economists believe the mechanism is too generous. Even so, small changes in the cost-of-living adjustment (COLA) will produce only small improvements in the long-term financial crisis. Major change, such as abolishing COLAs altogether, would significantly reduce government outlays. But with each passing year, Social Security checks would buy fewer goods and services, leaving the elderly with a progressively lower standard of living. This method only works if we're willing to renege on promises made to people when they were planning for their retirement.
"Patchwork reforms do not address the underlying structural problem."
Taxing Untaxed Wages. The FICA payroll tax reaches only about three-fourths of all wage income. Does it make sense to tax the other fourth? There are reasons not to. For example, much of this amount goes for employee fringe benefits – primarily health insurance and pensions. They are not taxed because government policy is designed to encourage private health insurance and private pensions. About half of untaxed wages consists of income above the $65,400 cap discussed above. Should we apply FICA taxes to all the income of wealthier taxpayers? The highest-income taxpayers already face a 40 percent marginal tax rate. Add FICA taxes and the marginal tax rate would exceed 50 percent. Experience teaches this would do more harm than good. In 1986 the top rate dropped from 50 percent to 28 percent and both the amount of taxes and share of total taxes paid by the highest-income earners rose! So reversing the process and raising the current rate above 50 percent is likely to produce less revenue, not more.37
Taxing Capital. About one-fifth of national income is capital income. Should recipients pay Social Security taxes on this income? Since a lot of capital income is received by higher-income taxpayers, this proposal runs into the previous objection: it would push marginal tax rates so high it would be self-defeating. There's also a more basic objection. Taxes on capital tend to shrink the supply of capital, which leads to lower wages. Therefore taxes on capital often turn out to be hidden taxes on labor.38
- For every dollar of extra aftertax income to investors, $12 of additional aftertax income goes to wage earners – a relationship that has been fairly constant over time.
- Thus more than 90 percent of any new taxes on capital will be paid by wage earners rather than recipients of capital income.
Putting Off the Inevitable. Patchwork reforms do not address the underlying structural problem. As long as our fertility rate remains low, life expectancy keeps increasing and medical costs keep rising, our need for more tax revenue will grow. If we fail to collect such revenue, we will face the unpleasant prospect of rationing medical care to the elderly and cutting back on their promised retirement income.
[page]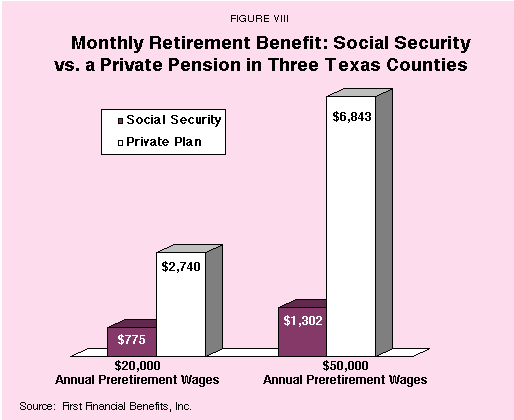
"Some countries have reformed their pay-as-you-go retirement systems."
Like our own system, the vast majority of the world's social security systems are pay-as-you-go. Not only do they face the same problems we face, but most developed countries are in worse shape. Within a generation (by the year 2020), 16 percent of the U.S. population will be elderly.39 But one out of every five people will be elderly in Denmark, Finland, Greece, Italy, Sweden and Switzerland. One out of four will be elderly in Japan. By this measure only Ireland, Australia and New Zealand are in better shape than the United States.40
- Some countries already have reformed their pay-as-you-go systems, pointing the way for others. Among the most notable alternatives to pay-as-you-go social security are the following:
- Britain allows employers and workers to opt out of the state pension system's second tier by setting up private pension plans with benefits at least as generous as the government system.41
- Australia requires workers to contribute to privately managed retirement savings accounts.42
- Chile requires workers to save for their own retirement by making regular deposits to private pension accounts, similar to American Individual Retirement Accounts (IRAs).43
- The Chilean system has been copied to one degree or another in Argentina, Bolivia, Colombia, Costa Rica, Hong Kong, Mexico, Peru and Uruguay, and it will soon be implemented in Ecuador and El Salvador.44
- Singapore requires employees and employers to contribute jointly to individual investment accounts, which may be used not only for retirement income but also to pay medical expenses or make the down payment on a home.45
These privatized systems are fully funded, and each generation provides for its own retirement. The systems avert the long-term financial crisis inherent in a chain-letter approach. They also encourage saving, which in turn generates higher economic growth.
Private Alternatives in the U.S. We need not look overseas or to Latin America to find examples of private alternatives to Social Security. The initial Social Security Act permitted state and local governments to opt out of the system – a loophole Congress closed in 1983. But before the option was ended, employees of Galveston, Brazoria and Matagorda counties in Texas chose to leave Social Security for a private alternative that has more than 5,000 participants today.46 In the private plan, contributions are similar to those for Social Security, but returns are quite different. A moderate-income employee in the private plan can expect a monthly pension of $2,740 compared to Social Security benefits that would have totaled about $775. A middle-income employee can expect to receive $6,843 from the private plan, compared to $1,302 from Social Security. [See Figure VIII.]
"Under a private plan in three Texas counties, a moderate-income employee can expect a monthly pension of $2,740 compared to about $775 from Social Security."
Employees of the three counties continue to pay their Medicare payroll taxes and to receive Medicare benefits upon retirement. But they rely on private life and disability insurance. The private life insurance benefit is three times the employee's salary. Social Security, by contrast, pays a one-time death benefit of $255 to a surviving spouse. The private disability insurance pays 60 percent of an individual's salary and is relatively easy to qualify for. Social Security disability benefits, by contrast, can be very difficult to qualify for and are unavailable to people who have not worked a minimum amount of time.
The experience of these Texas counties is not that unusual. An estimated 2 million government employees are in private systems outside Social Security because they work for state, county and local governments that opted out before 1983. A study by William Even (Miami University) and David Macpherson (Florida State University) looked at the experience of about 1 million of these employees and found them earning real rates of return between 1.6 and 3.0 percent, while their cohorts earn negative rates of return from Social Security.47 In general, participants in private plans will retire on pensions that are from three to seven times larger than their Social Security benefits would have been.
Advisory Council Proposals.48 A 13-member bipartisan Advisory Council on Social Security, appointed by the Clinton administration, recognized that the stock market historically has provided returns two or three times higher than those from government securities. However, the council couldn't agree on a single approach to Social Security reform, and last year instead proposed three different ones, none of which was supported by a majority of the council.
"Government investment in stocks would tempt politicians to try to influence the business decisions of private companies."
One proposal would have the government invest 40 percent of the Social Security trust fund – an inflation-adjusted $800 billion – in the stock market over 15 years. Investments would be in a broad range of stocks much like stock-index funds, and the government would not vote its shares. But politicians would be tempted to try to influence investments that would control as much as 10 percent of the nation's equities. They would almost certainly try to use their control to encourage or discourage certain industries, achieve social goals, reward friends or punish enemies. Critics note that this is what has happened with similar plans in Sweden and Japan.
The other two proposals envisioned individual investments in the equities markets. One would allow individuals to invest 5 percentage points of the 12.4 percent payroll tax in Personal Savings Accounts for retirement. The other would increase the Social Security payroll tax by 1.6 percentage points, allowing individuals to invest the amount of the increase in their personal retirement accounts.
[page]Most proposals for reform would give individuals tax deductions or tax credits for deposits to individual retirement accounts. Roughly speaking, people would give up the right to draw a dollar in Social Security benefits for each dollar deposited in their private accounts. After a number of years, these special IRA balances would grow to a point at which the account holders' claims against Social Security would be zero. Through a similar mechanism, individuals could opt into private alternatives to Medicare and the survivors and disability systems as well. Whatever approach we take to Social Security reform, we need to adopt three basic principles.
Choice. At least initially, people should have a choice between Social Security and a private plan.
Tax differential. Those who opt out should pay lower taxes than those who stay in. This differential should be large enough to encourage most people to choose a private plan.
Secure benefits for current retirees. The federal government should guarantee that those currently on Social Security receive their benefits.
Transition would be easy if it were a matter of allowing employees and their employers to deposit their FICA payroll taxes in private accounts instead of sending them to Uncle Sam. But if no one paid the payroll tax, how would we fund current retirees' benefits? Clearly, government must borrow or raise other taxes or both. Critics argue that throughout the transition the current generation of workers will have to pay twice: once for current retirement benefits and again for their own future benefits. The critics overlook the huge economic boost from privatization, which will make the temporary double burden bearable.
"By one estimate, workers could replace Social Security benefits by saving only 2 percent of their income."
When people save money they otherwise would have consumed, the economy gains access to new capital. When all employees increase their savings, the amount of new capital will be huge. In Chile this large increase in private capital made possible the privatization of virtually the entire Chilean economy. Banks, factories, farms and other assets that had been nationalized by a socialist government were sold to the private sector, which used pension fund money to buy them. Similarly, the increase in capital generated by Singapore's provident fund system provides investment funds that sustain a high rate of economic growth.
Economists Martin Feldstein and Andrew Samwick have calculated that the higher rate of return in a privatized U.S. system would in time permit retirees to maintain current levels of benefits by saving only 2 percent of their income.49 Professor Feldstein estimates that the value of future pension benefits would rise by 60 percent, from $11.3 trillion to $18 trillion.50 This real increase in the country's wealth amounts to more than $25,000 for every man, woman and child in the country – or more than $100,000 for a family of four.
NOTE: Nothing written here should be construed as necessarily reflecting the views of the National Center for Policy Analysis or as an attempt to aid or hinder the passage of any bill before Congress.
[page]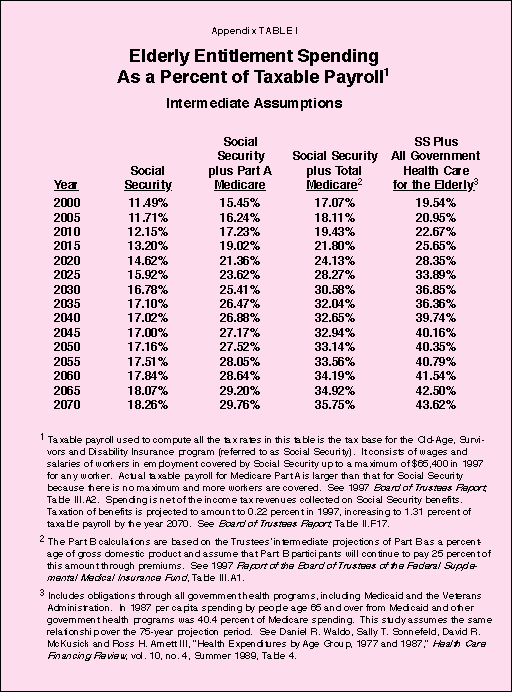
- Social Security refers to the Old-Age, Survivors and Disability Insurance (OASDI) programs that pay cash benefits to retired and disabled workers, their dependents and survivors. Currently, 12.4 percentage points of the 15.3 percent FICA payroll tax goes to fund OASDI. The Social Security benefits tax also supplies a small amount of revenue.
- Social Security Brief History, Social Security Administration, on the Internet at http://www.ssa.gov/history/history6.html.
- Marshall N. Carter and William G. Shipman, Promises to Keep: Saving Social Security's Dream (Washington, DC: Regnery Publishing, 1996), p. 30.
- 1997 Annual Report of the Board of Trustees of the Federal Old-Age and Survivors Insurance and Disability Insurance Trust Funds, Washington, DC, April 1997 (hereinafter referred to as Board of Trustees Report), Table II.F19.
- Enrollees in Part B are charged a monthly premium calculated to cover 25 percent of the cost, with the remainder of the cost paid from general revenue. Both Medicare Part A and Part B have deductibles and copayments.
- The Trustees project Medicare Part B costs paid by the government as a percent of gross domestic product. This study converts the calculations to a percent of taxable payroll. See 1997 Annual Report of the Federal Supplementary Medical Insurance Trust Fund, Washington, DC, April 1997, Table III.A1.
- Under the intermediate assumptions, health care costs will grow 2.5 percent faster than taxable payroll in 1997, 3 percent faster in 2000, 2.2 percent faster in 2005, 2.1 percent faster in 2010 and 2.9 percent faster in 2015. 1997 Annual Report of the Board of Trustees of the Federal Hospital Insurance Trust Fund, Washington, DC, April 1997, Sec II.F4 and Table II.F3.
- 1997 Annual Report of the Board of Trustees of the Federal Supplementary Medical Insurance Trust Fund, Secs. II.F5 and III.A and Tables II.F11 and III.A1. The Medicare Part B report frankly says that "assuming a continuation of the historical trend would result in an SMI (Medicare Part B) program so large as a percentage of GDP that it would be implausible given other demands on those resources." Ibid., Sec. III.A.
- Health care spending on the elderly by government programs other than Medicare is assumed to continue at 40.4 percent of Medicare spending. See Daniel R. Waldo, Sally T. Sonnefeld, David R. McKusick and Ross H. Arnett III, "Health Expenditures by Age Group, 1977 and 1987," Health Care Financing Review, vol. 10, no. 4, Summer 1989, Table 4.
- For an in-depth discussion of the effect, see Lawrence B. Lindsey, The Growth Experiment (New York: Basic Books, 1990).
- Ben Wattenberg, "Big Business Wannabe? Future Holds No Boom," USA Today, March 11, 1997.
- The pessimistic forecast of the Board of Trustees Report projects a population of 307,645,000 in 2075. Table II.H1. Extending the projection to 2095 shows a population of 288,228,000 compared to 268,055,000 in 1997.
- Extending the projection in the pessimistic forecast shows that 100,095,000 people, or 35 percent, will be age 65 and over in 2095.
- World Population Prospects, 1996 Revision, United Nations Population Division.
- "Why There Is a Perplexing Shortage of Rich Kids," The Economist, February 22, 1997, pp. 89-90.
- See Nicholas Eberstadt, "World Population Implosion?" The Public Interest, No. 129, Fall 1997.
- Carter and Shipman, Promises to Keep: Saving Social Security's Dream, pp. 29-30.
- Board of Trustees Report, Table II.D2.
- Ibid.
- Fredric D. Wolinsky, Ray R. Mosely II and Rodney M. Coe, "A Cohort Analysis of the Use of Health Services by Elderly Americans," in Journal of Health and Social Behavior, vol. 27, no. 3, 1986, p. 209.
- See Bruce Alberts et al., "Cancer," in Molecular Biology of the Cell, 3rd ed. (New York: Garland Publishing, 1994), pp. 1255-91.
- Figures for 1993, from U.S. National Center for Health Statistics, Vital Statistics of the United States, annual, and unpublished data, in Statistical Abstract of the United States, 1996.
- Ibid.
- See Robert Eisner, "There's No Need to Pick on the Elderly," Los Angeles Times, November 24, 1996.
- Facts and Figure about Social Security 1997, Social Security Administration.
- Ibid.
- U.S. House of Representatives, Committee on Ways and Means, "Background Materials on the Federal Budget and Tax Policy for the Fiscal Year 1991 and Beyond," February 6, 1990, p. 24, cited in Michael Tanner, "Privatizing Social Security: A Big Boost for the Poor," Cato Institute, Cato Project on Social Security Privatization, SSP No. 4, July 26, 1996.
- For a fuller discussion, see "Social Security and Race," National Center for Policy Analysis, NCPA Policy Report No. 128, June 1987.
- 1994 figures, National Center for Health Statistics.
- Deroy Murdock, "How Social Security Is Rigged against Blacks," Washington Times, July 29, 1997.
- T. J. Eller and Wallace Fraser, "Assets Ownership of Households: 1993," U.S. Department of Commerce, Bureau of the Census, Survey of Income and Program Participation, Current Population Reports, Household Economic Studies, P70-47, August 1995.
- William G. Shipman, "Retiring with Dignity: Social Security vs. Private Markets," Cato Institute, Cato Project on Social Security Privatization, SSP No. 2, August 14, 1995. The low-income retiree was assumed to be earning $12,600 per year at retirement.
- Tanner, "Privatizing Social Security: A Big Boost for the Poor."
- The change will first affect persons born in 1938, for whom the official retirement age will be 65 years and two months. The official retirement age will then increase gradually until it reaches 67 for persons born in 1960.
- The actual average age of retirement in the United States is 63.7 for men and 63.5 for women, as calculated by the Organization for Economic Cooperation and Development in 1994. Today only 67 percent of men aged 55-64 are in the labor force, compared to 83 percent in 1970. This reflects a combination of voluntary departures and retirements as a result of corporate downsizing. U.S. Bureau of Labor Statistics, Employment and Unemployment Statistics Program.
- U.S. Bureau of the Census, Statistical Abstract of the United States, 1996, p. 334.
- For further discussion of taxing untaxed wages, National Center for Policy Analysis, NCPA Policy Report No. 172, August 1992, pp. 29-30.
- See National Center for Policy Analysis, NCPA Policy Report No. 169, January 1992, p. 8.
- Board of Trustees Report, Table II.H1, intermediate projection.
- U.S. Department of Commerce, Bureau of the Census, International Database.
- See Peter J. Ferrara, John C. Goodman and Merrill Matthews Jr., "Private Alternatives to Social Security in Other Countries," National Center for Policy Analysis, NCPA Policy Report No. 200, October 1995.
- See the testimony of Anthony Stuart Blunn, Secretary of the Commonwealth Department of Social Security in Australia, to the Subcommittee on Social Security of the U.S. House Ways and Means Committee, September 18, 1997.
- Ferrara, Goodman and Matthews, "Private Alternatives to Social Security in Other Countries."
- See Luis Larrain, Pension Reforms in Latin American Countries, National Center for Policy Analysis, forthcoming study.
- Mukul G. Asher, "Compulsory Savings in Singapore: An Alternative to the Welfare State," National Center for Policy Analysis, NCPA Policy Report No. 198, September 1995.
- Merrill Matthews Jr., "Some Americans Already Have Privatized Social Security," National Center for Policy Analysis, Brief Analysis No. 215, November 4, 1996.
- William E. Even and David A. Macpherson, "The Consequences of Non-FICA Status in State and Local Pension Plans," National Tax Journal, January 1997.
- Report of the 1994 – 1996 Advisory Council on Social Security, Vol. I: Findings and Recommendations, Washington, DC, 1997.
- Martin Feldstein, "The Case for Privatization," Foreign Affairs, July-August 1997.
- Martin Feldstein, "Privatizing Social Security: the $10 Trillion Opportunity," Cato Institute, SSP No. 7, January 31, 1997.
John C. Goodman is President of the National Center for Policy Analysis. Dr. Goodman earned his Ph.D. in economics at Columbia University and has engaged in teaching and research at six colleges and universities, including Columbia University, Stanford University, Dartmouth College, Sarah Lawrence College and Southern Methodist University. Dr. Goodman has written widely on health care, Social Security, privatization, the welfare state and other public policy issues. He is the author of seven books and numerous scholarly articles. Dr. Goodman's published works include National Health Care in Great Britain, Regulation of Medical Care: Is the Price Too High?, Economics of Public Policy, Social Security in the United Kingdom and, with Gerald L. Musgrave, Patient Power: Solving America's Health Care Crisis.
Dorman E. Cordell is a Senior Scholar at the National Center for Policy Analysis. He has conducted research and written and spoken extensively on Social Security, criminal justice, health care and the environment. Mr. Cordell is also editor of the NCPA's bimonthly newsletter, Executive Alert. Before joining the NCPA in 1990, he was a newspaper publisher and an executive of The Associated Press, the world's largest newsgathering organization. He is a journalism graduate of the University of Kentucky, did graduate study in political science at the universities of North Carolina and Kentucky and has an MBA from the University of Dallas. He is a former adjunct professor at Southern Methodist University.