Taxes are collected for two basic purposes: to provide public goods such as national defense and a legal system and to redistribute income.
Over some range of taxation, the provision of government goods and services makes private economic activity more productive. For example, America's current level of productivity would not be possible without the infrastructure, protection of property and educational level of the workforce we have. Thus, up to some level, reducing private goods by a dollar yields more than a dollar increase in total output. Beyond some point, especially when taxes are used mainly for transfer payments, they reduce incentives to produce enough that they lower the rate of economic progress. Then, reducing private goods by a dollar yields less than a dollar increase in total output.
Using an economic model, we find a tax rate that will maximize economic growth. A higher tax rate will result in a loss of potential output for society as a whole. Using data for the 46-year period from 1950 through 1995, the model finds:
- The tax rate that would have maximized economic growth for the United States is 21 percent of gross domestic product (GDP); this tax rate would have produced average annual real economic growth of 4.8 percent.
- However, taxes took 24.2 percent of GDP in 1950 and continued to rise thereafter; as a result, the actual growth rate over the period averaged only 3.4 percent.
The additional 1.4 percentage points of growth would have resulted in workers now producing (measured in 1992 dollars) $107,900 in per capita output instead of $54,100. This means that the average person would have twice the real income he or she has today. The resulting increase in taxes paid could have paid for all government programs and left the nation debt free!
If the 21 percent tax rate had been in effect, cumulative real GDP (measured in 1992 dollars) during 1950-95 would have totaled $88 trillion more than the actual $173.5 trillion.
- On the average, each dollar of tax collected caused a $1.71 loss of private wealth over the 46-year period.
- However, the higher the tax burden, the higher the cost to the economy; specifically, each additional dollar of tax is causing a loss of $3.44 of GDP (output that was never produced).
A tax rate well above the optimal rate is common among other industrialized nations as well. The resulting loss in a number of other countries for which data are available has retarded economic growth in those nations, too.
- On the average, the growth-maximizing tax rate is about 20 percent of GDP among developed countries – ranging from 16.6 percent for Sweden to 25.2 percent for the United Kingdom.
- Current levels of taxation, however, range from 34.1 percent in the United Kingdom to 51.6 percent in Denmark.
- The marginal cost of taxation for each unit of local currency is 5.70 in Denmark, 3.34 in the United Kingdom, 1.59 in Italy, 4.20 in Sweden, 1.76 in Finland and 3.43 in New Zealand.
Not only would Americans have a higher standard of living if the tax rate had been at 21 percent of GDP, but based on public spending and indicators of social progress, it appears that the marginal benefit of taxation in the United States has been far less than the marginal cost. There is evidence that government spending prior to 1960 led to measurable improvements in social indicators. However, the explosive growth in government spending after 1960 has been accompanied by only modest improvement.
Many European nations take an even higher percentage of GDP in taxes than does the United States. Their experience suggests that in any economy where the marginal cost of taxation exceeds the marginal benefit, the eventual result is lower economic growth, reduced job formation and increased unemployment.
[page]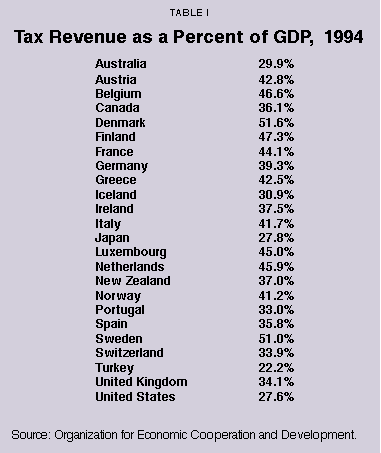
Taxes are collected for two basic purposes. First, they are used to provide public goods, such as national defense and a legal system. Second, they are used to redistribute income from the economically successful to the less successful.1
When government takes a dollar from taxpayers and spends it on a government program, there are three possible outcomes: the economy's total output of goods and services can go up, it can go down or it can remain unchanged.
Over some range of taxation, the provision of government goods and services makes private economic activity more productive. It is clear that the current level of productivity would not be possible without the infrastructure, protection of property and educational level of the workforce we have. These are activities largely funded by taxation. Thus, up to this level, reducing private goods by a dollar yields more than a dollar increase in total output. Beyond this level, where taxes are used mainly for transfer payments, the reduction in incentives produced by income redistribution lowers the rate of economic progress. Penalizing success with high marginal tax rates and subsidizing failure with generous public transfers damages economic efficiency. People work fewer hours and do not work as hard, there is more job shirking and absenteeism and workers take longer vacations. Moreover, to avoid the burden of taxes, people will engage in avoidance and evasion – diverting resources from the most productive uses to uses that lower their tax burden. Income redistribution schemes reduce incentives to innovate, save and invest, and they generally lower the rate of economic growth. Hence, reducing private goods by a dollar yields less than a dollar increase in total output.
"Government has increasingly engaged in the redistribution of income – more often than not from middleclass taxpayers to middleclass beneficiaries."
In the early days of our republic, a common view was that federal activities should be confined to actions that promote the general welfare. Presumably, these would be activities that, on balance, increased the national wealth. In the modern period, however, government has increasingly engaged in the redistribution of income – more often than not from middle-class taxpayers to middle-class beneficiaries rather than from rich to poor. Such transfer programs clearly have the potential to reduce the national wealth, for the reasons given above.
Taxes. Prior to the New Deal, taxes were low in the United States. In 1902 federal, state and local taxes were about 6.5 percent of gross national product (GNP).2 By 1929 taxes had climbed to 10.9 percent of GNP. This number rose steadily up to World War II and then sharply thereafter. In 1950 the total tax burden was about 24.1 percent of GNP; a decade later, it was 27.2 percent. Today taxes take about 31.3 percent of national economic output.
"The character of government spending has changed dramatically during the 20th century."
Spending. The character of government spending has changed dramatically during the 20th century. Before World War II most government spending was directed toward defense, education, highways, criminal justice and administration. In 1929 transfer payments to individuals were less than 1 percent of GNP. Today transfer payments to individuals (along with interest payments on a huge public debt) are the largest and most rapidly growing component of public spending, absorbing about 14 percent of GDP.3 The accelerated rise in the welfare state began with the Johnson administration's War on Poverty and other social programs in the 1960s. Like the federal government, state and local governments have reallocated public expenditures away from core functions to transfer payments to individuals.
The Welfare State. Despite massive transfer payments under various entitlement programs aimed at redistributing income, the United States has not gone nearly as far as other countries. When measured by the reduction of income inequality, we are less taxed than people elsewhere. [See Table I.]
- Among nations in the Organization for Economic Cooperation and Development (OECD), only Turkey taxes less, although Japan is close to the U.S. level of taxation.
- Clearly, the Scandinavian nations have made the most progress in using taxes and expenditures to homogenize incomes.
- On the average, the European Economic Community collects 40 percent more taxes than does the United States.
Net Impact. Setting aside philosophical questions about income redistribution, the practice raises economic questions both in the United States and elsewhere. Has the United States reached the point at which the positive net benefits of taxing and spending to provide public goods, those of benefit to the economy as a whole, are more than offset by the negative impact of income transfer programs? If so, was there an earlier period in our history when the level of taxation was more beneficial to the economy as a whole? And what has been the cost to the country of taxation that reduced the nation's output of goods and services?
This study calculates the marginal cost of taxation in the United States – how much output is never produced for each extra dollar of taxes collected – and considers the marginal benefit of taxation. No methodology exists for calculating the aggregate marginal benefit of taxation, but we can examine progress across a range of social progress indicators and assess whether public spending has been responsible for this progress.
The experience of other nations is also relevant to judging the relationship between taxation and economic growth in the United States. This study calculates the marginal cost of taxation for selected countries and considers the impact of that taxation on economic growth.
[page]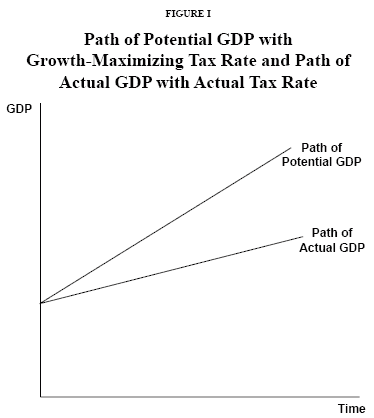
To explore the impact of government taxation and expenditure on the economy as a whole, we have sought to find a relationship between the level of taxation and the rate of economic growth over time. Discovery of such a relationship will help us determine whether there was a period in our past when the level of taxation contributed positively to economic growth and whether the relationship today is positive or negative.
For this purpose, we postulate a simple yet useful model of the economy and its relationship to taxation. In the model used here, the economy is divided into public and private sectors. Government provides goods and services, which are produced with capital and labor and are financed solely out of taxes collected. The private sector produces private goods with the remaining capital and labor. These private and public goods combine to represent the total national output.4
The path of the economy over time may be expressed as a simple compound growth relationship, like that of a savings account.5 Our interest is in how the level of taxation affects this growth rate.6 In particular, we want to determine whether or not there is a tax rate that will maximize economic growth and then discover what the consequences are of a tax rate different from the growth-maximizing tax rate.
If the tax rate is less than the growth-maximizing tax rate, increasing it accelerates the rate of economic growth. If the tax rate is greater, increasing it slows the rate of economic growth. At a tax rate equal to the growth-maximizing tax rate, the growth rate is at its maximum.
Let us assume some level of taxation other than the growth-maximizing tax rate. At this tax rate, the economy will grow at a lower rate than its potential maximum, assuming no business cycles.7 The two paths of expansion of the economy over time, one at the maximum potential growth, the other at its actual growth, are shown in Figure I.
[page]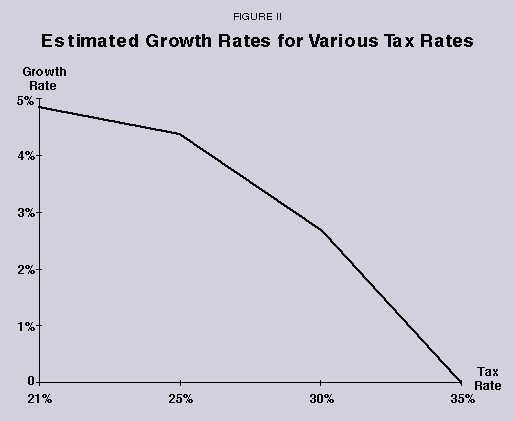
Figure I shows a gap between potential output and actual output. Assume that this gap is caused by a tax rate that is too high (i.e., higher than the growth-maximizing rate). Then the higher tax is causing a loss of potential output for society as whole. This loss is called a "deadweight loss of taxation."8 One way to measure the burden of this higher tax rate is to divide the gap between potential and actual output by the average amount of taxes collected over the period.9 Since in Figure I the gap between the potential and actual national output grows, the net burden of taxation is increasing over time.
By plugging real-world data into the economic model we've constructed, it is possible to determine the growth-maximizing tax rate, the deadweight loss of the actual rate of taxation and thus the marginal cost of taxation. The marginal cost of taxation is the amount of GDP that is lost as a result of each extra dollar of taxes above the growth-maximizing rate.
The Growth- Maximizing Tax Rate. We use data on the real rate of growth of GDP for the 46-year period from 1950 through 1995 and on federal, state and local taxes as a share of GDP for that period.10 The resulting calculations suggest that:11
- The estimated growth-maximizing tax rate for the United States is 21 percent of GDP.
- The overall rate of economic growth that corresponds to that tax rate is 4.8 percent.12
- Instead of the growth-maximizing tax rate of 21 percent of GDP, however, taxes were 24.2 percent of GDP in 1950 and continued to rise thereafter.
- The actual annual economic growth rate over the 1950-95 period was 3.4 percent.
In Figure II, the growth rates that correspond to various tax rates are plotted. The illustration clearly shows that the long-term growth rate declines for levels of taxation above 21 percent of GDP.
"If a tax rate of 21 percent of GDP had been in effect, families would have twice as much income today."
The Cost of Higher Taxation. Actual GDP in 1995 (in 1992 dollars) was $6.76 trillion. Absent other influences, if the optimal tax of 21 percent had been in effect throughout the period, real GDP would have been $13.48 trillion – or almost twice the actual figure. Accumulated real GDP over the 46-year time span would have been $261.5 trillion, or $88 trillion more than the actual number of $173.5 trillion. This means the average efficiency loss to the economy from taxation above the optimal level is 34 percent ($88 trillion divided by $261.5 trillion). The accumulated real taxes paid by Americans from 1950 through 1995 totaled $51.45 trillion.
- On the average, each dollar of tax created a $1.71 deadweight loss of private wealth ($88 trillion divided by $51.45 trillion).13
- But the marginal cost of taxation is much higher than the average cost,14 with each extra dollar of tax causing a $3.44 loss of GDP.15
"Every additional dollar of tax causes a $3.44 loss of GDP."
If a tax rate of 21 percent had been in effect over the 1950-95 period, the long-term rate of growth would have been about 1.4 percentage points higher. Workers now would be producing (in 1992 dollars) $107,900 in per capita output instead of $54,100. The standard of living would be higher for everyone, the poor as well as the well-off.
[page]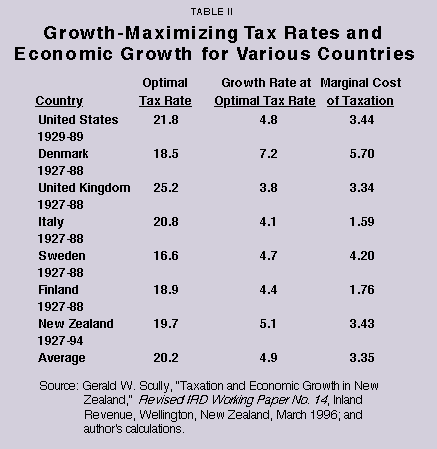
Covering a spectrum of nations provides comparisons that are useful in making judgments about the relationship between taxation and economic growth in the United States. Is a tax rate above the growth-maximizing level peculiar to the United States, or is it common among industrial nations? Long-term data on GDP, including the period during World War II, are available for a number of European nations and New Zealand. Using the same economic method applied to the U.S. data, optimal tax rates for these nations have been estimated over a similar period. (The regressions appear in Appendix Table I.) The results, summarized in Table II, show that:
- The optimal tax rates range from 16.6 percent for Sweden to 25.2 percent for the United Kingdom.
- On the average, the growth-maximizing tax rate is about 20 percent of GDP, less than half of the current levels of taxation.
- The marginal cost of taxation for each unit of local currency is 5.70 in Denmark, 3.34 in the United Kingdom, 1.59 in Italy, 4.20 in Sweden, 1.76 in Finland and 3.43 in New Zealand.
Tax rates as a percent of GDP are far above the optimal levels in all these countries. As Table I shows, they range from 34.1 percent in the United Kingdom to 51.6 percent in Denmark.
[page]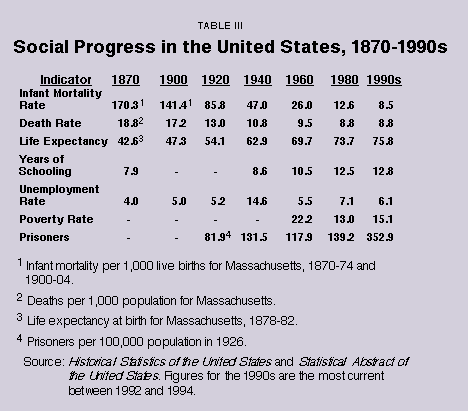
If one of the principal purposes of taxation is the promotion of social progress and harmony, are tax dollars collected at increasing marginal rates in the United States effectively employed to meet these objectives? Are we as taxpayers getting our money's worth, considering the rising tax burden?
In an interesting 1995 paper, V. Tanzi and L. Schuknecht question the value of the enormous growth in government expenditures among industrialized nations after 1960. They conclude that "…various government performance indicators suggest that the growth in spending after 1960 may not have brought about significantly…greater social progress. The group of countries with 'big governments' – those that increased spending the most – did not 'perform' better than the ones with 'small governments'…"16 Significantly, they also conclude that "for the period up to 1960, a reasonable claim can be made that the increased public-sector spending (on education, health, training, etc.) had led to measurable improvement in social indicators."17
Their conclusion is probably warranted for "free" compulsory schooling, which has raised the number of school years completed from what it might otherwise have been. (This leaves aside the issue of the quality of education produced by the public school monopoly.)
"Despite the trillions of dollars thrown at the problem, not much progress has been made in eliminating poverty in America."
Perhaps it is also true that government spending has largely smoothed business cycles and thus worked to reduce unemployment. Certainly, we have not again experienced the levels of joblessness recorded during the Great Depression. Even so, "full employment" now is considered to be an unemployment rate in the 6 percent range, rather than the 4 percent target enshrined in the 1946 Employment Act. Currently, the United States is experiencing a "tight" labor market, with unemployment below 5 percent. The size of the budget, the deficit and public debt in the United States are sufficiently large to have eliminated the use of fiscal policy as a tool for economic stabilization. In Europe, where governments are much larger in a fiscal sense, fiscal policy not only is ineffective but unemployment rates are two or more times that in the United States.
Despite the trillions of dollars thrown at the problem, not much progress has been made in eliminating poverty in America. In 1960, 22.2 percent of the population lived below the poverty level. Great Society spending programs reduced that rate to 11.4 percent by 1978, but thereafter it rose again. In 1993, 15.1 percent of the population was classified as impoverished.
Public Spending and Social Indicators. Most researchers measure social progress with such indicators as the infant mortality rate, the death rate, life expectancy, literacy and educational attainment, the unemployment rate and how equitably income is distributed. Social harmony may be measured by the amount of criminal activity in society.
Various social indicators are presented in Table III for some years between 1870 and 1995. The achievement in social progress is remarkable. Infant mortality and the death rate show a continuous decline over the past 12-plus decades, and life expectancy and years of schooling show an upward trend. But it is clear that the rate of social progress was much more rapid in the earlier decades, when government was smaller, than in the later ones when government was much larger. In 1960, 144 more infants per 1,000 live births survived than in 1870 (170 deaths per 1,000 in 1870 compared to 26 in 1960) and the death rate was reduced by more than 50 percent. Over that 90-year period average life expectancy increased by 27 years.
Since 1960 these social indicators have improved, but at a much less rapid rate. Infant mortality was reduced from 26 per thousand live births to 8.5 between 1960 and 1992. The death rate fell from 9.5 to 8.8 per 1,000. Life expectancy grew by 6.1 years.
If social harmony is measured by the absence of crime, we live in a much less harmonious society today than in the past. As a proxy for social disharmony, the number of persons imprisoned per 100,000 population is revealing. The rate of imprisonment (not criminal activity, necessarily, but related) did not change much from 1940 to 1980, but it has since grown so substantially that today more than twice as many people per 100,000 population are behind bars as in 1980. While the causes of crime are arguable and controversial, whatever its cause, government has not done a very good job of curtailing it.
Public Spending and Public Health. Communicable diseases were the main killers of people up until about 1930. For example, in 1870 tuberculosis, diphtheria, typhoid, measles and smallpox were responsible for 27 percent of the deaths in Massachusetts.18 In 1900, 44 percent of deaths in the United States resulted from tuberculosis, typhoid, scarlet fever, diphtheria, whooping cough, measles and influenza.19 The influenza outbreak of 1918 alone was responsible for a third of the nation's deaths that year. It was so severe that life expectancy fell from 50.9 years in 1917 to 39.1 years in 1918.20
"Government played only a small role in medical research and care prior to 1960."
By 1960 these diseases caused 4.8 percent of deaths and now are responsible for only a tiny fraction. Certainly, government played an important role in the eradication or reduction of communicable diseases, promoting and paying for clean drinking water, sanitation facilities, public health programs and mass inoculations. But it is important to note that private medicine and research were the source of the cures, not government. In 1929 we spent only 3.5 percent of our GNP on health care. Of the $3.6 billion expended, only $600 million was from public funds and almost none went to medical research. Not until 1940 did government spending on medical research reach $3 million, and this was prompted by the imminence of war.
The perception of a large government role in medical research and care for the elderly and indigent is a post-1960 phenomenon. Medicare and Medicaid began in 1966. The National Institutes of Health, the principal source of funding for medical research, was established a few years later.
Cancer and heart disease are today's main disease killers. In 1900 almost 24 percent of deaths were from these diseases. By 1960 they were the cause of 70.6 percent of deaths and in 1993 of 65 percent. Enormous expenditures are made to treat these diseases and to fund curative research. There has been some progress, but the death rate from cancer and heart disease has only declined from 671 per 100,000 population in 1960 to 572 in 1993.21
Some scientists say that the life span of humans could be as much as 150 years if heart disease were controlled and cancer cured. Biotechnology and genetic engineering offer the tantalizing prospect of eliminating genetically based diseases and of dramatically advancing organ transplantation techniques. Perhaps this is a realistic dream, perhaps not. But based on past performance, it is important to note that massive public funding of medical research and high expenditures on health care produced sharply diminishing returns to social progress after 1960.
[page]We have shown that tax rates in the United States, as well as in nations with more aggressive welfare programs, are substantially higher than the rates that would maximize growth. Thus we have proved that the marginal cost of taxation is high. By the standard of maximizing per capita output (another way of saying economic growth), Americans are overtaxed by about 50 percent. By penalizing success with taxes and subsidizing failure with transfer payments, the United States and other OECD nations have lower standards of living than they would have if tax rates were lowered. The slower rise in various social indicators and the increasing societal disorder since 1960 demonstrate the consequences of higher tax rates.
In terms of social progress, increased taxes have not bought very much for the United States. It is true that infant mortality and the overall death rate are down and life expectancy is up since the 1960s, but these gains are small compared with those of the previous 90 years, when government was smaller and tax burdens much less oppressive. Little progress has been made in reducing poverty. Criminal activity, as measured by incarceration rates, has skyrocketed.
Many European nations have gone further than the United States in efforts to reduce income inequality and establish welfare states. To reach the European level of income equality, government in the United States would have to be expanded to the point that taxes would take about 45 percent of GDP instead of the current one-third. But the price for further homogenization of incomes is even lower economic growth, reduced job formation and increased unemployment – exactly what Europe is experiencing now.
"Welfare states are failing, with fiscal policies that are simply unsustainable."
Welfare states were successful for nearly two generations after World War II. They had reasonable rates of economic growth, low unemployment and very little poverty. Sweden became the liberal utopian model. The Swedes were widely praised for their attention to jobless workers, who received 90 percent of their pay for several years while seeking new employment, and for the fact that, after taxes, university professors earned little more than bus drivers. Asser Lindbeck makes the point that such social programs may change individual behavior temporarily, but eventually – probably after more than one generation – the disincentives to productive labor become fully visible. Habits, social norms, attitudes and ethics constrain purely economic incentives. But before long, a critical mass of welfare recipients begins to undermine the old norms and the overall economy. As public benefits expand and marginal tax rates rise, the net payoff to private productivity shrinks and the demand for inclusion in welfare programs rises.22
Now welfare states are failing. Many European nations have fiscal policies that are simply unsustainable. High taxes and large deficits have sucked the marrow from their economies, and governments have been forced to scramble to pay the interest charges on huge public debts. Labor peace has been purchased with massive long-term transfers of wealth to the unemployed and a host of social programs from health care to baby-sitting. Many of these governments recognize that the size and scope of the welfare state has to be reduced or there may be an economic collapse. But shrinking the welfare state is politically difficult, unless a serious crisis arises.23 For example, France tried to modestly reduce individual entitlements and got rioting in the streets.
"Because of the burden of taxation, our standard of living is lower than we could have had now."
For the United States, the evidence points to a need to revise the structure and philosophy of taxation. Considering the deadweight loss from tax rates above the growth-maximizing level and the diminishing gains in terms of social progress from increased taxes since the 1960s, the marginal cost of taxation is far higher than the marginal benefit. Rather than improving lives, the current burden of taxation has resulted in a lower standard of living than we could have had now.
NOTE: Nothing written here should be construed as necessarily reflecting the views of the National Center for Policy Analysis or as an attempt to aid or hinder the passage of any bill before Congress.
[page]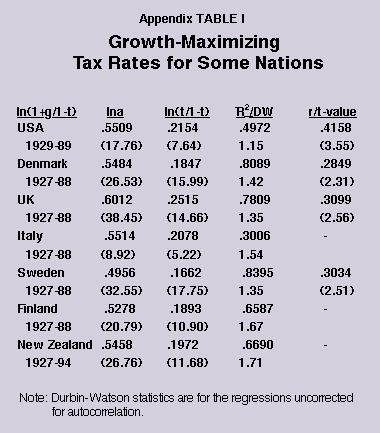
- Taxes collected for both purposes are also redistributed to rent-seekers – those who use the political process for gain they could not get in the free marketplace.
- Until the 1980s national production of goods and services, or gross national product (GNP), included some items that represented foreign wealth. This was altered to gross domestic product (GDP) to reflect more accurately wealth generated domestically. GNP and GDP figures differ slightly, but not enough to create a serious distortion.
- Calculated from data in Economic Report of the President, pp. 280, 372.
- Let the public goods in the previous period be designated as Gt-1 and the tax rate as . The balanced budget constraint means that G =Y, where Y is national output. The government collects taxes equal to Y, which leaves (1 – t)Y for private production. The production function that relates current national output to past output of public and private goods, then, is:
(1) Yt = a(Gt-1)b[(1 – t)Yt- 1]1-b
= a(tYt-1)b[(1 – t)Yt-1]1-b.One might wish to recognize that not all government services are public goods and that some of the previous period's output is consumed. One can multiply G and (1 – t)Y by constants, such as a and b. This will make no difference to the results obtained in the paper. If one treats a and b as varying over time (e.g., the fraction of government expenditures devoted to public goods has declined relative to redistribution expenditures; saving has declined relative to consumption), we would have atb and btc in the expression. The growth-maximizing tax rate remains unaffected. For further details about the development of this model, see Gerald W. Scully, "Taxation and Economic Growth in New Zealand," Pacific Economic Review, vol. 1, no. 2, September 1996, pp. 169-77; also see "The 'Growth Tax' in the United States," Public Choice, 85, 1995, pp. 71-90, and "What Is the Optimal Size of Government in the United States?" National Center for Policy Analysis, NCPA Policy Report No. 188, November 1994.
- Dividing equation (1) in note 1 by Yt- 1 yields:
(2) Yt/Yt-1 = 1 + g = atb(1 – t)1-b.
- Differentiating g with respect to t in equation (2) in note 2 yields:
(3) dg/dt = atb-1(1 – t)-b (b – t).
The evaluation of this expression is quite simple. The first three terms of the expression — a,tb-1 and (1 – t)-b — are positive. Designate the product of those terms as A. Thus:
(3') dg/dt = A(b – t).
The sign of dg/dt depends on whether the actual tax rate,t , is less than or greater than the growth-maximizing tax rate, b.
- A constant, rather than a variable, growth rate.
- In the public finance literature, the "deadweight loss of taxation" arises from tax-induced distortions in allocative efficiency. This literature ignores technical inefficiency or output loss arising from taxation that causes actual output to be less than potential output. In this paper, deadweight loss is used in the latter sense.
- Two aspects of taxation cause deadweight loss. One is the gap between potential and actual output. The other arises from allocative inefficiency caused by the distortion of treating different income streams or assets differently for tax purposes. For example, interest deductibility of home mortgages induces more investment in housing than would otherwise have occurred. Deadweight loss from allocative inefficiency is not considered here.
- From the Economic Report of the President, pp. 280, 283, 371 (Washington, DC: USGPO, 1996); for years prior to 1959, Historical Statistics of the United States. For statistical reasons, the estimating equation (see note 4) is divided on both sides by one minus the tax rate and logarithms are taken.
- The explanatory variables are the tax rate and one minus the tax rate. But by definition these variables are not independent of each other. This high degree of intercorrelation may produce unreliable parameter estimates. More efficient estimates can be obtained by dividing both sides of the equation by one minus the tax rate. Thus we have a dependent variable that is one plus the growth rate divided by one minus the tax rate and an independent variable that is the tax rate divided by one minus the tax rate. The equation to be estimated is:
(1 + g)/(1 – t) = [a/(1 – t)][/(1 – t)]b.
This relationship is nonlinear. It may be made linear for the purpose of estimation by taking the logarithms of both sides of the equation.
Estimation produces sensible results. The parameter estimate is highly significant and the statistical fit is good. Estimation produces a parameter estimate of the growth-maximizing tax rate of .2101. The regression is:
ln[(1 + g)/(1 – t)] = .5614 + .2101 ln[t/(1 – t)], R2= .50.
(19.04) (6.74)
Various tests for heteroskedasticity and autocorrelation were conducted. Nothing of statistical significance was found.
- The solution is straightforward. We have 1.327 = 1.753(.2101/.7899).2101. Multiplying [(1 + g)/(1 – t)] by [(1 – t)=.7899] we obtain [(1 + g) = 1.0484]. Subtracting 1 and multiplying by 100, we obtain 4.8 percent.
- The deadweight loss also can be calculated mathematically, as follows. Potential real GDP, at the growth-maximizing tax rate of 21 percent, grows at the rate of 4.85 percent per annum. The path of potential real GDP, Y*t, is given by Y*t = Y0eg*t, where g* is the maximum rate of economic growth. The actual path of real GDP is given by Yt = Y0egt. The difference between potential and actual real GDP at each time period is: Y0eg*t – Y0egt. Integrating this difference over the interval from zero to infinity yields:
(1) (Y0eg*t/g*) – (Y0egt/g) + [Y0(-g* + g)/g*g].
The path of real taxes is given by Tt = T0emt, where m is the growth rate of real taxes, and is equal to 4.3 percent per annum. Integrating the tax function over the same interval yields:
(2) T0emt/m – T0/m.
Utilizing the initial values of Y0 and T0 and the respective growth rates and dividing (1) by (2) yields the average deadweight loss of $1.71.
- The marginal deadweight loss is the change in the difference between potential and actual GDP over time divided by the change in real taxes. Given equations (1) and (2) in the above note, the marginal deadweight loss at time t is:
(Y0eg*t – Y0egt)/T0emt.
- The marginal deadweight loss is found by regressing the difference between real potential and actual GDP on real taxes. The result is:
DWLOSS = -1935.5 + 3.4409 REAL TAXES R2= .93.
(11.40) (24.91) - V. Tanzi and L. Schuknecht, "The Growth of Government and the Reform of the State in Industrial Countries," IMF Working Paper (Washington, DC: International Monetary Fund, December 1995), p. 20.
- Ibid., p.18.
- Historical Statistics of the United States, vol. 1, p. 63.
- Ibid., p.58.
- Ibid., p.55.
- Statistical Abstract of the United States, 1995, p. 92.
- Assar Lindbeck, "Hazardous Welfare- State Dynamics," American Economic Review Papers and Proceedings, vol. 85, no. 2, May 1995, pp. 9-15.
- The reforms in New Zealand and the reduction in taxation there were precipitated by a foreign exchange crisis. New Zealand is the only OECD nation that has reduced the size and scope of government.
Gerald W. Scully is a Senior Fellow of the National Center for Policy Analysis and a professor of economics in the School of Management at the University of Texas at Dallas. His articles have appeared in the American Economic Review, the Journal of Political Economy, the Journal of Law and Economics, Public Choice and other scholarly journals. Dr. Scully is also an expert on the economics of sports. His most recent book is The Market Structure of Sports.