Congress has passed a 10-year $792 billion tax cut bill that President Clinton has criticized as "gargantuan" and has vowed to veto. Put in perspective, however, the tax cut is small, and is justified. It does not even offset the projected growth in federal taxes over the next decade, or use any of the $2 trillion of excess Social Security tax revenue to finance the cut. It is, in short, a very modest effort to give something back to those who are mainly responsible for the surplus: the taxpayers.
- The tax cut phases in very slowly and will not have any significant effect on revenues before 2002.
- It averages just 0.6 percent of Gross Domestic Product (GDP) over the 1999-2009 period, with a peak impact of 1.3 percent in 2008.
- In 2008, revenues will still be far above their postwar average at 19.8 percent of GDP.
- It will be at least 2003 before the 1999 tax cut and the tax cut of 1997 together offset the impact of the 1993 increase rammed through a Democratic Congress as Clinton's first major act in office.
In 1998 the federal government took more than 21.7 percent of the nation's entire output of goods and service – the highest percentage in history.
- The highest year ever previously recorded was 20.8 percent in 1981.
- The World War II peak was 19.9 percent in 1943.
Even with the tax cut, receipts will average 20.7 percent of GDP between 1999 and 2009 – higher than any single year in American history before this administration save one.
The tax cut bill remedies a number of existing inequities in the Tax Code.
Estate Tax. This bill would phase out the U.S. estate tax. The Treasury Department argues that the tax is necessary to maintain the overall progressivity of the Tax Code. But in reality, even liberal economists agree that it does nothing to break up large fortunes and promote a more egalitarian distribution of wealth. Careful estate planning is so effective at avoiding estate taxes that the effective tax rate on estates over $20 million is actually lower than on those between $2.5 million and $5 million. Those paying the highest effective estate tax rates are often family farms and businesses that must be sold to pay the tax collector.
The estate tax actually costs the government revenue because it reduces economic growth, investment, new business formations and employment. For example:
- A new survey of 365 family-owned businesses in New York found that they spent an average of $125,000 each on estate planning costs, reducing employment by more than 5,000 jobs.
- In those 365 companies alone, the estate tax itself is expected to destroy another 15,000 jobs over the next five years.
Capital Gains Indexing. The bill provides for indexing, another provision opposed by the Clinton Administration. The tax law has traditionally taxed nominal, or money, income. But for economists the concept of income has always meant real income; that is, nominal or money income adjusted for changes in the general price level by means of some appropriate index such as the Consumer Price Index.
In 1980 economist Robert Eisner looked at aggregate capital gains from 1946 through 1977 and found no real capital gains whatsoever over this entire period. Instead, households suffered a real loss of $231 billion on nominal gains of almost $3 trillion. Ironically, the main burden of the excess taxes actually falls more on those with low incomes than the wealthy. Consequently, indexing does more to help the middle class than the rich.
Marriage Penalty Relief. A marriage penalty exists when a two-earner couple pays more federal taxes than they would pay if each spouse could be taxed as a single. The tax tends to be greatest where each spouse has roughly the same income. The tax bill helps alleviate this problem by widening the 15 percent bracket and increasing the standard deduction for married couples.
According to the Treasury Department, this year alone couples will pay $28.3 billion more in federal taxes than if there were no marriage penalty. The Treasury study also found that increasing the standard deduction for couples would reduce the marriage penalty for three million of the 25 million couples affected, with the benefits mainly accruing to couples making between $15,000 and $30,000 per year.
Saving and Investment. One of the most remarkable economic developments during the Clinton Administration has been the virtual collapse of saving. The savings rate has fallen from 5.7 percent in 1992 to just 0.5 percent last year – in tandem with the rise in personal taxes.
- If Americans had saved in 1998 at their 1992 rate, saving would have been $277 billion higher.
- If they had been taxed at the 1992 rate, their taxes would have been $215 billion lower.
- Assuming they saved these taxes, the saving rate would have been a healthy 4.5 percent.
The tax bill proposes to encourage additional saving. In particular, individual retirement account limits would rise from $2,000 per year to $5,000.
Alternative Minimum Tax. Basically, taxpayers take taxable income from their 1040 form, figure their taxes, then add back a long list of so-called tax preferences, including deductions for state and local taxes, charitable contributions and the standard deduction, and use a new set of exemptions and tax rates to figure their taxes again, paying whichever tax is higher. The problem is that the personal exemption, standard deduction and individual income tax brackets are indexed to inflation, whereas the AMT exemption is not. It is estimated that unless action is taken, the number of individual tax returns required to pay the AMT will rise from about 800,000 this year to over nine million by 2009. The congressional tax bill phases out the AMT for individuals and abolishes it in 2008. The bill also reforms the AMT for corporations.
Research and Development Credit. In 1981 Congress enacted a tax provision designed to stimulate private research and development. A 1995 report from Congress's Office of Technology Assessment found that the credit stimulated $1 of new R&D for every $1 of revenue loss. A Commerce Department study that same year found an even higher response: $2 of R&D for every $1 of revenue loss. Unfortunately, Congress has been unwilling to make a long-term commitment to the R&D credit. The tax bill extends the credit for five years, less than optimum but better than the year-to-year extensions of the past.
In the end, the main justification for a tax cut is that the money belongs to the people and not the government. Experience shows that only when the government's allowance is cut off will it make a serious effort to restrain its profligacy. Throughout history, governments have taken taxpayers for granted, only to be shocked when they rise up in revolt. Although taxpayers today may not yet be in a revolutionary mood, it should be remembered that in the past, tax burdens far below those we have today have triggered tax revolts.
[page]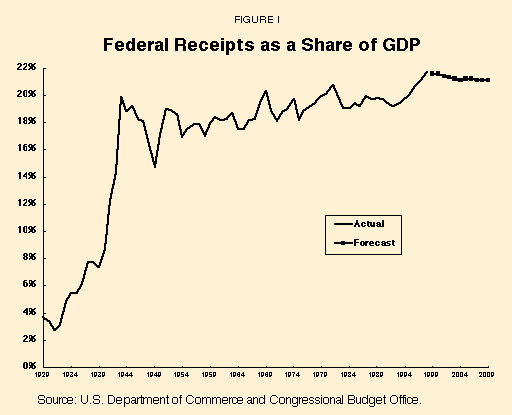
For more than two decades, Congress and the White House have been struggling to get control of federal budget deficits. In 1998, those deficits finally disappeared and the federal government ran a surplus of $69.2 billion, the first since 1969. Both the Congressional Budget Office and the Office of Management and Budget now project surpluses as far as the eye can see – roughly $3 trillion over the next decade.
This greatly improved fiscal situation is due largely to higher federal taxes. Taxes have grown by 58 percent since 1992, while the gross domestic product (GDP) has grown just 36 percent. This results from many factors, including the 1993 tax increase, one of the largest ever enacted in peacetime. But the major factor is the steeply progressive nature of our tax system, which causes people to pay more taxes as their incomes rise. Because of this, taxes rise automatically unless offset by a tax cut from time to time.
"A strong case could be made for a tax cut considerable larger than $792 billion over 10 years."
In early August, Congress took the first step toward relieving the unprecedented tax burden – a peace dividend from victory in the war against deficits. It passed a 10-year $792 billion tax cut that does not even offset the projected growth in federal taxes over the next decade. Nor does it use any of the $2 trillion of excess revenue from Social Security taxes to finance the tax cut. It is, in short, a very modest effort to give something back to those who are mainly responsible for the surplus: the taxpayers.
Nevertheless, the Clinton Administration has strenuously attacked the congressional tax bill. "Huge tax cuts aimed disproportionately at the wealthy…that break the bank," said White House spokesman Barry Toiv. President Bill Clinton has vowed to veto it as soon as it reaches his desk.
This study argues that the administration is wrong. There is ample justification for the congressional tax cut – indeed a strong case could be made for a tax cut considerably larger than $792 billion over 10 years.
Taxes at an All-Time High. Federal receipts are now at the highest level in history as a share of GDP, and have been for more than two years. Indeed, average federal receipts as a share of GDP during the first six years of the Clinton Administration exceeded those of every year in American history except one, including World War II. And unless taxes are cut, revenues as a share of GDP will continue to rise. As Figure I illustrates:
- Federal receipts as a share of GDP have risen every year of the Clinton Administration, increasing from 19.2 percent in 1992 to 21.7 percent in 1998.
- The highest year ever previously recorded was 20.8 percent in 1981.
- The World War II peak was 19.9 percent in 1943.
Receipts are forecast to remain above 21 percent of GDP for the foreseeable future, according to the Congressional Budget Office (CBO). Even with the tax cut that has passed Congress, revenues will remain well above their postwar average. If federal revenues were to average the same percentage of GDP as existed before President Clinton took office, Congress would have to cut taxes by $3.4 trillion between 1999 and 2009 – more than four times greater than the $792 billion its tax bill contemplates.
"Federal receipts are at the highest level in history as a share of gross domestic product."
According to the U.S. Census Bureau, federal income taxes have risen from 12.1 percent of the average household's income in 1992 to 14.9 percent in 1997. Reducing such taxes to their 1992 level would have given the average family a tax cut of $1,775 in 1997, or 19 percent of its income tax burden.1
"Even with the tax cut, federal revenue will average 20.7 percent of GDP."
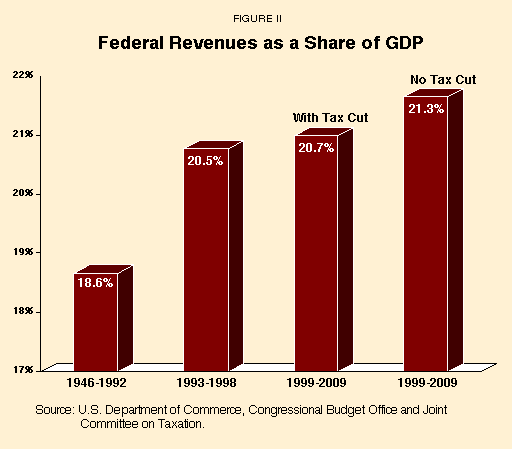
The Tax Cut Won't Even Stop Taxes from Rising. As Figure II indicates, federal receipts as a share of GDP averaged 18.6 percent during the postwar period until Bill Clinton became president. During the first six years of his administration, receipts have averaged 20.5 percent. The CBO estimates that they will average 21.3 percent over the next 10 years in the absence of a tax cut. Even with the $792 billion tax cut that has passed Congress, receipts will average 20.7 percent of GDP between 1999 and 2009 – again, higher than any single year in American history before this administration save one.
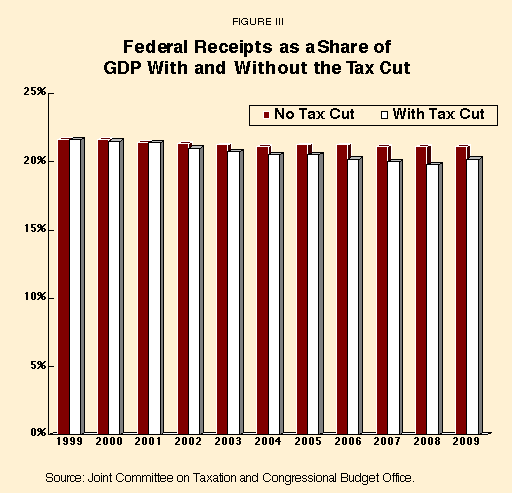
The Clinton Administration labels the tax cut as gargantuan and some economists fret that it will overstimulate the economy. In fact, as Figure III shows:
- The tax cut phases in very slowly and will not have any significant effect on revenues before 2002.
- It averages just 0.6 percent of GDP over the 1999-2009 period, with a peak impact of 1.3 percent in 2008.
- In 2008, revenues will still be far above their postwar average at 19.8 percent of GDP.
"The tax cut phases in very slowly and will not have any significant effect on revenues before 2002."
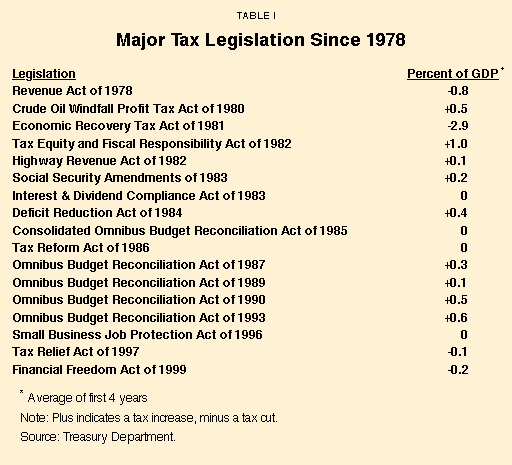
Moreover, the proposed tax cut will actually be among the smallest major tax cuts ever enacted. And if, for some reason, it should turn out to be too large, it will be a simple matter for Congress to undo it. As Table I indicates, Congress has proven itself more than willing to pass tax increases when fiscal conditions demanded it. For example, it reversed one-third of the 1981 tax cut just one year later. However, it has shown itself much less willing to reverse itself on tax increases – even when their purpose no longer exists. If passed, the 1999 tax cut and the 1997 tax cut together will not even offset the impact of the 1993 tax increase, rammed through a Democratic Congress as Clinton's first major act in office, until at least 2003.2 And the 1999 tax cut that the president has labeled "huge" is actually smaller than the 1993 tax increase: 0.6 percent of GDP for the former and 0.7 percent of GDP for the latter.
"The 1999 tax cut the president labeled 'huge' is actually smaller than his 1993 tax increase."
Tax Cut Distributionally Fair. In addition to the size of the tax cut, the Clinton Administration also opposes the tax bill passed by the House and Senate as unbalanced distributionally. It alleges that too much of the benefits accrue to the wealthy and not enough to those with low incomes. This is misleading at best. Even the Clinton Administration's own figures show that Americans receive tax cuts roughly in proportion to the taxes they pay.
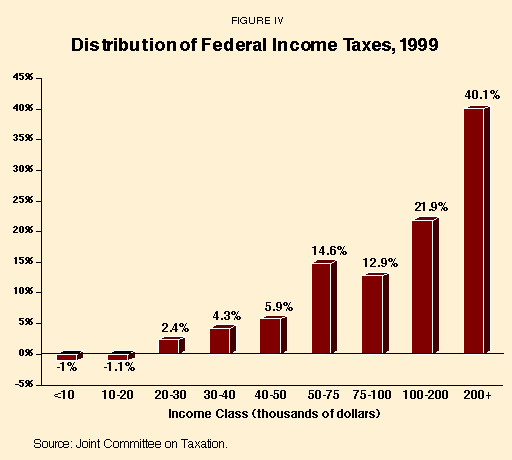
Tax cuts by definition only benefit those who pay them. And the fact is that those with low incomes basically pay no income taxes. Of the 65 million tax filers with incomes below $30,000 in 1998, only 22 million paid any federal income taxes at all. Overall, 48 million of the nation's 134 million tax filers paid no income taxes last year. The vast bulk of all federal income taxes are paid by those with high incomes.3 As Figure IV indicates, 62 percent of all federal income taxes this year will be paid by those with incomes above $100,000. That is why they necessarily benefit the most from an income tax cut.
According to the Internal Revenue Service:
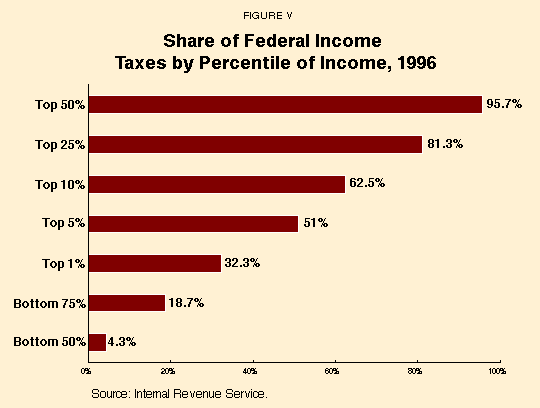
- The top 5 percent of taxpayers now pay a majority of all income taxes and the top 25 percent – those with incomes above $45,833 in 1996 – pay more than 80 percent of all such taxes.
- By contrast, those in the bottom 50 percent of the income distribution – with incomes below $23,160 – pay a mere 4.3 percent of all federal income taxes. [See Figure V.]
"The top 25 percent of taxpayers now pay more than 80 percent of all income taxes."
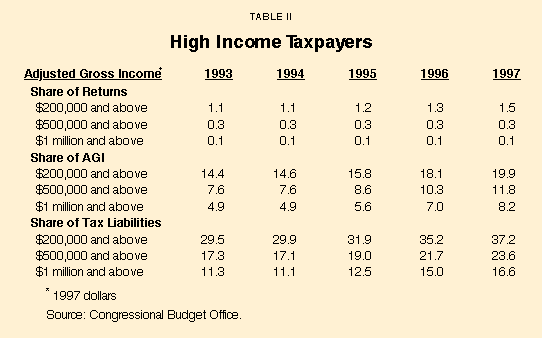
As Table II indicates, the greatest contribution to deficit reduction in recent years has been made by the wealthy, who have greatly increased their tax payments to the Treasury. Their taxes have increased much more sharply than their incomes.
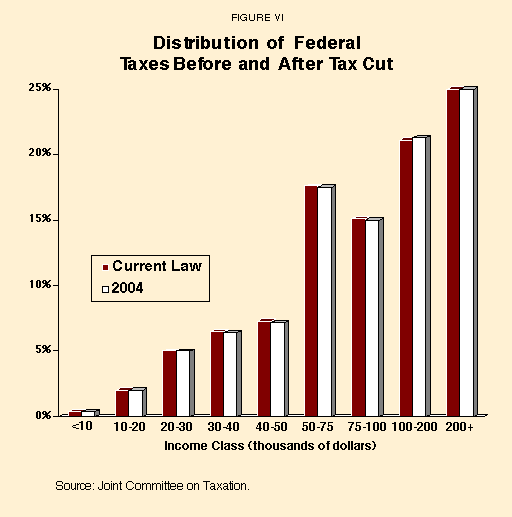
Despite these figures, the Clinton Administration maintains that the benefits of the tax bill are skewed too much toward the wealthy. According to the Treasury Department, 45.3 percent of the benefits of the tax cut would go to just the top 5 percent of taxpayers. But as noted above, the top 5 percent of taxpayers now pay 51 percent of all federal income taxes. Those who pay a lot of taxes, therefore, get a bigger tax cut in dollar terms than those who pay little. The fact is that the tax bill's benefits are roughly proportional to the taxes that each taxpayer pays. As a consequence, the tax bill does virtually nothing to change the existing distribution of taxes, as shown in Figure VI. This conclusion is supported by the Clinton Administration's own analysis of the tax bill.4 As economist Martin Sullivan recently wrote in the respected journal Tax Notes:5
It may be surprising to most that even using Treasury's distributional analysis, the conference bill is not that far away from an equal percentage reduction in taxes for all income classes….This is possible because most federal taxes are paid by high-income taxpayers.
The Clinton Administration will, no doubt, continue to label the tax cut as unfair, but to most people a tax cut that is proportional to the taxes that they pay is about as fair as one can get.
"Each tax rate would fall by one percentage point."
The congressional tax bill would deliver the bulk of its tax relief in the form of an across-the-board reduction in statutory tax rates. Each rate, from 15 percent at the bottom to 39.6 percent at the top, would fall by one percentage point. This means that the new rate structure would go from 14 percent at the bottom to 38.6 percent at the top. It also means that those in the bottom bracket get a larger percentage reduction, almost 7 percent versus a 2.5 percent reduction for those at the top.
While one might have hoped for an equal percentage reduction in each tax rate, as Ronald Reagan's tax plan provided back in 1981, nevertheless it is significant that all tax rates will fall under the congressional plan. This means that every taxpayer will get some relief regardless of his or her circumstances. In recent years too much of tax policy has involved gimmicky tax credits that give big rewards to some taxpayers, while giving nothing to others. Cutting each bracket by 1 percentage point is at least a welcome move back in Reagan's direction and away from the tax gimmick approach that characterized the 1997 tax bill.6
Tax rate reduction is not only the fairest way to give tax relief, it is also the one that promises the most "bang for the buck." Economic theory is clear that high marginal tax rates are very costly in terms of reduced labor, saving and investment, ultimately leading to lost output and lower government revenues.7
"The tax bill leaves the existing distribution of taxes virtually unchanged."
The Clinton Administration, however, maintains that tax rates are not that high and that it is inappropriate to give the wealthiest Americans – those in the top bracket – a tax cut. Also, it contends, reductions in statutory tax rates do nothing to help those at the very bottom of the economic scale because they pay no taxes. There are several responses to this charge.
- In 1986, the federal government struck a deal with taxpayers. Deductions and other tax preferences, many of which were used primarily by the wealthy, were curtailed in return for lower tax rates. This led to a reduction in the top rate from 50 percent to 28 percent. In 1993, however, Clinton reneged on the deal and raised the top rate back up to 39.6 percent without restoring any of the deductions that were lost in 1986.
- Mr. Clinton justified the higher tax rates exclusively on the need to get the budget deficit under control. Higher revenues from those most able to pay them were essential, he argued. However, in 1998 the budget moved into surplus and is expected to remain in surplus for some time to come. Therefore, it is appropriate to begin rolling back the Clinton tax increase, since its basic justification no longer exists.
- Historically, higher tax rates on the rich have led to higher taxes on the middle class. When the top rate goes up, it is often easier to raise rates on those well below the top. Also, inflation and real growth push taxpayers up into higher brackets once reserved exclusively for the rich. Therefore, a reduction in the top rate helps ensure that those below that rate are protected from tax increases.8
"Clinton justified higher tax rates exclusively on the need to get the budget deficit under control."
Finally, it is important to remember that tax policy cannot help everyone, at least not directly. The only way a tax cut can help someone who pays no taxes is to send that person a government check and call it a tax cut, even though it is really government spending.9 However, keeping the tax burden down ultimately benefits everyone because it leads to higher growth and more jobs in the long run. In the end, full employment and high wages are the best way to help those at the bottom of society. It is short-sighted and counterproductive to oppose a tax cut that contributes to this end simply because it does not directly put more dollars into the pockets of those who pay no taxes now.
[page]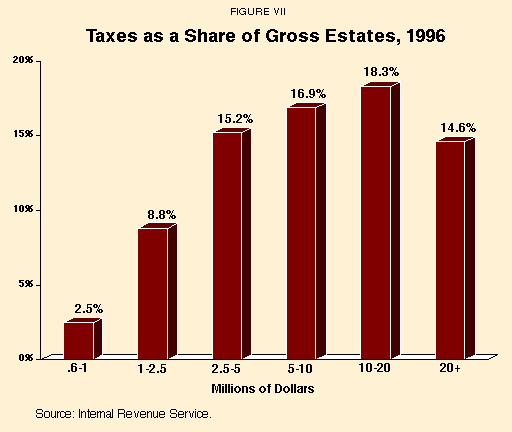
One of the main targets of the Clinton Administration's charge that the tax bill is unfair is its proposed elimination of the estate and gift tax – often called death taxes.10 The Treasury Department argues that the estate tax is necessary to maintain the overall progressivity of the tax code.11
But in reality, the estate tax does nothing to break up large fortunes and promote a more egalitarian distribution of wealth. Even liberal economists agree. Says Alan Blinder, a former member of Clinton's Council of Economic Advisers, "The reformer eyeing the estate tax as a means to reduce inequality had best look elsewhere."12 Indeed, despite the fact that the United States has one of the highest estate tax rates in the world, some economists believe that wealth has never been more unequally distributed than it is now.13
Ironically, the estate tax actually contributes to this maldistribution of wealth, rather than minimizing it. The reason is that careful estate planning can virtually eliminate the burden of the tax. So effective are these methods of avoiding estate taxes that Professor George Cooper of Columbia University says the estate tax essentially is a voluntary tax. As he wrote, "The fact that any substantial amount of tax is now being collected can be attributed only to taxpayer indifference to avoidance opportunities or a lack of aggressiveness on the part of estate planners in exploiting the loopholes that exist."14 Economists Henry Aaron and Alicia Munnell put it even more bluntly. In their view, estate taxes aren't even taxes at all, but "penalties imposed on those who neglect to plan ahead or who retain unskilled estate planners."15 (Munnell was a member of the Council of Economic Advisers under Clinton and Aaron served in the Carter Administration.)
Families with histories of great wealth are much more likely to engage in effective estate planning than those whose wealth is of more recent vintage. Also, many estate planning techniques require many years to implement, something more easily done by those born to wealth than those who made their own fortunes. As a consequence, the effective tax rate on estates over $20 million is actually lower than on those between $2.5 million and $5 million, as shown in Figure VII.
"The effective tax rate on estates over $20 million is lower than those between $2.5 million and $5 million."
Thus those who are paying the highest effective estate tax rates are not those with fortunes measured in nine, 10 or 11 digits, but those with modest wealth. These are often family farms and businesses that must be sold to pay the tax collector. Forcing such sales does nothing to equalize the distribution of wealth. Indeed, it fosters greater inequality by making it harder for those with small businesses to grow and become large. As a result, large, established firms are protected from competition and those who own them have an easier time maintaining their wealth.16
The economy as a whole and even the government also pay a price for the estate tax. According to economist B. Douglas Bernheim, the federal government raises no net revenue from the estate tax because many estate planning techniques also have the effect of reducing one's income tax liability. This loss of income tax revenue may offset all of the revenue the government gets from the estate tax.17
The government also loses revenue because the estate tax reduces economic growth, investment, new business formations and employment. For example:
- A new survey of 365 family-owned businesses in New York found that they spent an average of $125,000 each on estate planning costs, reducing employment by more than 5,000 jobs.
- In those 365 companies alone, the estate tax itself is expected to destroy ahan the business itself, which reduces growth and profitability.18
Surveys also indicate that many family-owned businesses devote more time to estate planning than the business itself, which reduces growth and profitability.19
"Those paying the highest rate often are family farms and businesses that must be sold to pay the tax collector."
A study by Congress's Joint Economic Committee concluded that the nation's capital stock is $497 billion smaller than it would be if there had been no estate tax over the last 20 years.20 Another study concluded that the estate tax is reducing economic growth by 0.4 percent and investment by 0.7 percent per year.21
For these reasons, leading economists and tax theorists have concluded that the estate tax has outlived its usefulness and should just be abolished. In the words of economist Douglas Holtz-Eakin of Syracuse University, "The direct empirical evidence to date suggests that the estate tax imposes a significant deadweight cost on the economy, fails to raise sufficient revenue to be considered a tool for income-distribution goals, and engenders considerable administrative and compliance costs. In short, the standard criteria of tax policy evaluation suggest that there is no reason to defend the estate tax."22
In recent years a number of major countries such as Canada, Israel and Australia have abolished their estate taxes. The U.S. should join them.
[page]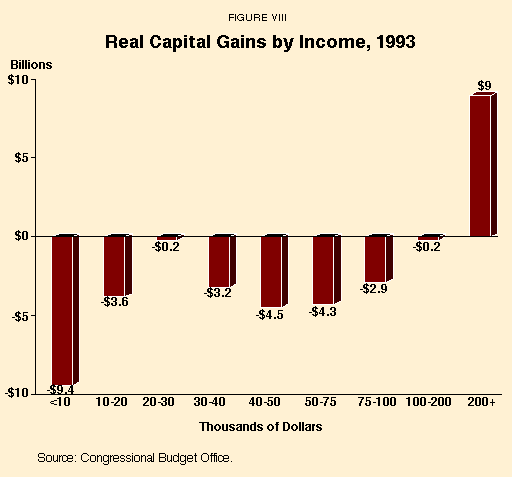
Another object of the Clinton Administration's ire is the tax bill's capital gains provisions. The bill would cut the tax rate on long-term capital gains to 18 percent, but this is not really a tax cut because current law already provides that the current 20 percent capital gains rate will fall to 18 percent after next year. The key provision is indexing capital gains for inflation.
For economists, the concept of income has always meant real income; that is, nominal or money income adjusted for changes in the general price level, by means of some appropriate index such as the Consumer Price Index. However, despite this universally held view among economists, the tax law has traditionally taxed nominal income as if it were real income. It was not until 1981 that the first provisions were added to the Tax Code partially adjusting automatically for inflation. However, much of the Code remains unindexed, resulting in economic distortion and unfairness. In particular, capital gains are not adjusted for inflation.
"The tax law has traditionally taxed nominal income as if it were real income, instead of adjusting for inflation."
The standard economic definition of income used by tax theorists for more than half a century was developed by Robert M. Haig and Henry Simons, both of whom strongly advocated inflation indexing of capital gains for tax purposes. Simons conceded that most capital gains are "largely fictitious" once inflation into taken into account. In principle, he said, tax law should adjust gains and losses for changes in the price level. "Considerations of justice demand that changes in monetary conditions be taken into account in the measurement of gain and loss," Simons wrote in 1938.23 A long line of major tax theorists have consistently held to the Haig-Simons view regarding the impact of inflation on capital gains down to the present day.24
Thus it is well established that as a fundamental matter of principle, capital gains ought to be adjusted or indexed to inflation. And a considerable amount of analysis has shown that the failure to do so has caused great harm to millions of taxpayers.
The first important empirical study of the impact of inflation on capital gains was done by economists Martin Feldstein and Joel Slemrod in 1978. They found that the $4.5 billion in nominal capital gains on corporate stock reported by taxpayers in 1973 would actually have been a $1 billion loss had capital gains been indexed to inflation. But because inflationary gains were taxed as though they were real, taxpayers paid almost $500 million more in taxes that year than they should have.25 Other studies have come to similar conclusions.
- In 1977, investors paid taxes on $5.7 billion of nominal capital gains on corporate stock. When adjusted for inflation, these gains were actually a $3.5 billion loss.26 This suggests that more than $1 billion in excess taxes were paid that year on fictitious gains.27
- In 1981, they paid taxes on $17.7 billion of nominal gains that were really a $5 billion loss when adjusted for inflation.28 The excess tax bill came to $2.8 billion.
- In 1993, gross gains on all assets except bonds were $81.4 billion. Under current law loss limits, real gains were $32.4 billion less. But with no loss limit, the nominal gains turned into a $19.4 billion loss.29 The excess tax bill was at least $7.7 billion.
"Indexing does more to help the middle class than the rich."
Perhaps the most remarkable study of the impact of inflation on capital gains, however, was done by economist Robert Eisner in 1980. He looked at aggregate capital gains from 1946 through 1977 and found that over this entire period there were no real capital gains whatsoever. On balance, Eisner found, households suffered a real loss of $231 billion on nominal gains of almost $3 trillion.30 Commenting on the Eisner study, Alan Blinder conceded that "most capital gains are not gains of real purchasing power, but simply represent maintenance (or rather partial maintenance) of principal in an inflationary world."31
The result of taxing inflationary gains as if they were real greatly increases the tax burden on capital. The effective tax rate can easily exceed 100 percent.32 Ironically, the main burden of the excess taxes actually falls more on those with low incomes than the wealthy. As Figure VIII indicates, in 1993 every income class except those at the very top suffered real losses on their capital gains realizations, and thus paid taxes on nonexistent gains.33 Consequently, indexing does more to help the middle class than the rich.
Finally, it is important to recognize that historically reductions in the capital gains tax rate have strongly stimulated growth. Indeed, according to a recent study, the 1997 reduction from 28 percent to 20 percent paid for itself. Taxes from stronger growth, higher asset prices and greater turnover raised more revenue than was lost due to the rate cut.34
Continuing to tax inflationary gains is unfair and harmful to the economy. Contrary to the Clinton Administration's assertions, the middle class will be the main beneficiaries of the congressional indexing plan.
[page]A marriage penalty exists when a two-earner couple pays more federal taxes than they would pay if each spouse could be taxed as a single.35 The tax tends to be greatest where each spouse has roughly the same income. The tax bill helps alleviate this problem by widening the 15 percent bracket and increasing the standard deduction for married couples.
According to the Treasury Department, this year alone couples will pay $28.3 billion more in federal taxes than if there were no marriage penalty. About 25 million couples will pay these higher taxes, which average $1,141 per couple. The Treasury study also found that increasing the standard deduction for couples would reduce the marriage penalty for three million of them, with the benefits mainly accruing to couples making between $15,000 and $30,000 per year.36 Among the other effects of the marriage penalty are these:
"Blacks and women suffer the most from the marriage penalty."
Blacks Suffer Most. Professor Dorothy Brown of the University of Cincinnati College of Law has argued that blacks are more likely to suffer a marriage penalty from the Tax Code.37 The reason is that among married couples, black women are more likely to work than white women. Furthermore, working black women on average provide a higher percentage of the couple's total income than working white women. In 1991, working married black women contributed 37.8 percent of the family income, while working married white women contributed 30.6 percent, according to the Bureau of Labor Statistics.38
Women Are Discouraged from Working. The marriage penalty mainly has an impact on women because they tend to be the lower-paid spouse. This means that a wife's income comes on top of her husband's and she pays taxes on her income at the couple's highest marginal tax rate. Many studies have shown that this effect causes many women to stay out of the labor force or work less than they would if the marriage penalty did not exist.39
Studies have also shown that efforts to mitigate the marriage penalty have had a strong impact on women's labor supply. A study of the 1981 tax act, which reduced the marriage penalty by instituting a secondary earner deduction, shows that married women's work expanded by almost enough to pay for the deduction's revenue loss.40 Analysis of the Tax Reform Act of 1986, which lowered the top marginal tax rate from 50 percent to 28 percent, shows that married women responded more strongly to the increased work incentive than men did.41
"Past efforts to mitigate the marriage penalty have had a strong impact on women's labor supply."
Another study estimated that if the marriage penalties remaining after the Tax Reform Act were eliminated, the average married woman would increase her labor supply by 46 hours per year. High-income and low-income women would respond even more strongly, increasing their work by 100 hours per year.42 The latest estimates by economists Martin Feldstein and Daniel Feenberg suggest that sharply cutting the tax rate on secondary workers could lead to an increase in earnings by such workers of as much as $66 billion per year.43
Marriage Penalties Discourage Marriage and Encourage Divorce. Several studies have looked at this question. They find that the marriage penalty has a small but significant impact on couples' decision to marry. When the marriage penalty rises, aggregate marriage rates fall. There is a much greater impact on the timing of marriage, with couples often delaying marriage from late in a year to the next year to minimize their marriage penalty.44 Finally, there is some evidence that taxes encourage divorce, especially on the part of women who are affected most by the marriage penalty.45
While the tax bill does not fully eliminate the marriage penalty, it takes an important step toward that goal.
[page]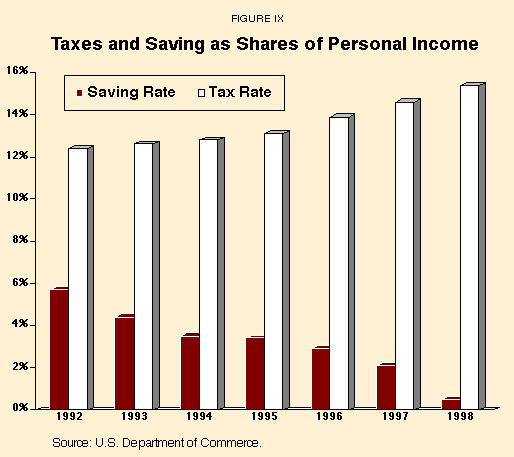
One of the most troubling economic developments during the Clinton Administration has been the virtual collapse of saving. The savings rate has fallen from 5.7 percent in 1992 to just 0.5 percent last year. When saving falls, it forces businesses to borrow abroad or to cut back on investment. All economists recognize that saving is critical to the growth of jobs and incomes.
The administration pooh-poohs the decline in saving and gives no indication that it knows why it has occurred.46 The answer, however, is obvious. The sharp increase in taxes as a share of personal income has deprived Americans of the extra income they used to save. As Figure IX shows, the savings rate has fallen in tandem with the rise in personal taxes. If Americans had saved in 1998 at their 1992 rate, saving would have been $277 billion higher. If they had been taxed at the 1992 rate, their taxes would have been $215 billion lower. Assuming they saved these taxes, the savings rate would have been a healthy 4.5 percent.
The tax bill proposes to encourage additional saving by lowering taxes on saving. In particular, individual retirement account limits would rise from $2,000 per year to $5,000. Based on historical experience, this should lead Americans to contribute more to IRAs, because such contributions are tax deductible and all returns to that saving grow tax-free.
"The nation's savings rate has fallen in tandem with the rise in personal taxes."
The administration opposes a general expansion of IRAs, arguing that it mainly leads people to shift assets out of taxable accounts into IRAs and hence, there is no increase in overall saving. Also, the administration believes that IRAs should be targeted for specific purposes deemed appropriate by government.
However, there is considerable evidence that IRAs lead to increases in saving. While the initial effect of an IRA expansion may be asset shifting, most families do not have enough liquid assets to shift assets indefinitely. After a short time, they must increase their saving to take advantage of the IRA benefit. Thus the latest research concludes that expanding IRAs and other retirement saving vehicles, such as 401(k) plans, does indeed lead to increased saving.47
Virtually every major country offers more incentives for saving than the U.S. does. This is a major reason why their saving rates are higher.48 Expanding IRAs is a small but necessary step toward increasing the U.S. savings rate.
[page]The alternative minimum tax is like a completely separate tax system, with its own rate structure and rules about deductions, exclusions and credits. Basically, taxpayers take taxable income from their 1040 form and add back a long list of so-called tax preferences, including deductions for state and local taxes, charitable contributions and the standard deduction. There is an exemption of $33,750 for singles and $45,000 for couples. The tax rate is 26 percent up to $175,000 and 28 percent above that. In essence, taxpayers calculate their taxes under the regular system and the AMT, paying whichever yields the higher tax.
The problem is that the personal exemption, standard deduction and individual income tax brackets are indexed to inflation, whereas the AMT exemption is not. Thus over time it becomes more and more likely that a taxpayer with a given income will owe more under the AMT than under the regular income tax. In effect, inflation is pushing the middle class up into the AMT.
It is estimated that unless action is taken, the number of individual tax returns required to pay the AMT will rise from about 800,000 this year to over 9 million by 2009. The government's tax take will rise from $3.6 billion to $19.8 billion.49 The main impact will be on taxpayers with incomes between $50,000 and $100,000. Of all taxpayers owing AMT, 40 percent will be in this income class by 2007, up from 26 percent today. Their share of AMT tax revenue will rise from 7 percent to 17 percent.50
"As the alternative minimum tax is now structured, many taxpayers with modest incomes end up paying it."
Ironically, the 1997 tax cut actually increased the number of taxpayers affected by the AMT. That is because the child credit and the education incentives will cause more taxpayers to have an AMT liability greater than their regular income tax, forcing them to pay the difference. As a consequence, many taxpayers with modest incomes will end up paying a tax that was originally enacted to ensure that the wealthy could not avoid taxes through excessive use of tax preferences.51
The congressional tax bill deals with this problem in a straightforward manner by phasing out the AMT and abolishing it for individuals in 2008.
The bill also reforms the AMT for corporations. The corporate AMT was enacted as part of the Tax Reform Act of 1986. Its purpose was to ensure that profitable corporations could not discharge their entire tax liability through the use of tax deductions. The AMT set up an alternative tax system in which many tax deductions are disallowed. Corporations calculate their tax liability under the regular corporate income tax and under the AMT. Under the former the tax rate is 35 percent, under the latter 20 percent. Companies pay whichever system yields the higher tax. In 1994, the Treasury collected $4.5 billion from the AMT.
According to the U.S. General Accounting Office, only about 28,000 firms – about 1.3 percent of all corporations – paid any AMT in 1992, although 400,000 were required to file AMT returns. However, just 2,000 large corporations paid 85 percent of all AMT collected. Public utilities paid the greatest amount, followed by chemicals, paper, transportation, mining and autos.52
One of the problems with the AMT is that liabilities can vary greatly from year to year. For example, in 1990 the auto industry paid almost $1 billion in AMT, but only $31 million the following year.53 The reason is that depreciation, the write-off firms get for the wearing out of their plant and equipment, is the single biggest business deduction covered by the AMT. In a recession year like 1990, when profits fall, capital-intensive firms like auto companies still have a lot of depreciation. That is what triggers a large AMT payment. Then in future years, when a company may not be covered by the AMT, it gets a credit for the AMT it paid in previous years. In 1994, corporations received a credit of $3.3 billion for AMT they had paid earlier, reducing the net yield of the tax to just $1.1 billion.
What all this means is that the AMT increases corporate taxes during recessions and reduces them during expansions – the opposite of what the tax system ought to do. It also is notoriously complex, makes corporate planning more difficult and discourages capital investment. Thus a study from DRI/McGraw-Hill predicts that repeal of the AMT would increase capital investment by 7.9 percent over the next 10 years. More investment translates into higher productivity, higher wages and more jobs.54
"The problems are now leading even many liberals to question the wisdom of having the AMT."
These problems with the AMT are now leading even many liberals to question the wisdom of this tax. For example, a new book from the Brookings Institution makes a strong case for repeal. In Cracking the Code, University of Maryland economics professor Andrew Lyon says that the AMT fails to achieve any notable equity objective. "There is little reason to believe that the distribution of taxes among corporations corresponds to a meaningful concept of equity among individuals," he writes.55
Economist Martin Sullivan of Tax Analysts is even more critical. He says the AMT "makes an economically unjustified corporate income tax even more cumbersome and inefficient." Moreover, it is all done for the sake of appearance. "There is no policy justification for the AMT," Sullivan writes. "It exists so there will be no bad press about large corporations not paying any tax."56
While the tax bill does not repeal the corporate AMT, as it does the AMT for individuals, it does reduce the burden of this tax significantly.
[page]Economists are unanimous in their belief that research and development is essential to economic growth. Technological progress is the key to productivity growth and, therefore, rising standards of living.57 However, businesses tend to underinvest in R&D because they cannot capture all of the benefits for themselves; much of the benefit accrues to society as a whole, rather than to the business that financed the R&D.58 For this reason, economic theory says that it is in the interest of the long-term welfare of society to subsidize R&D to some degree.59
In 1981, Congress enacted a tax provision designed to stimulate private R&D. Companies were allowed a tax credit of 25 percent on incremental R&D (currently 20 percent). That is, their taxes were reduced by 25 percent of the additional, not the total, amount of qualified R&D they did each year. By applying the credit only to the annual increase in R&D, Congress hoped to ensure that companies were not rewarded for what they would have done anyway, but only for doing more.
"Studies show the R&D credit stimulated from $1 to $2 of new research and development for every dollar of revenue loss."
Studies of the R&D credit generally have found that it has increased R&D exactly as it was supposed to. A 1995 report from Congress's Office of Technology Assessment found that the credit stimulated $1 of new R&D for every $1 of revenue loss.60 A Commerce Department study that same year found an even higher response: $2 of R&D for every $1 of revenue loss.61 When one considers that the social rate of return on R&D may be several times the private rate of return, one has to judge the R&D tax credit to be one of the most effective government programs ever enacted.
Unfortunately, Congress has been unwilling to make a long-term commitment to the R&D credit. It has never been enacted permanently and has expired on several occasions, most recently on June 30, 1998. Economist Ken Brown of the National Science Foundation believes that this on-again/off-again approach to the R&D credit has robbed it of much of its effectiveness. Firms often plan R&D projects years in advance. If they are not sure the credit will be available, they may scale back their plans.62
A new study from Coopers & Lybrand may help Congress overcome its reluctance and make the R&D credit permanent. It finds that over a 12-year period the dynamic revenue loss is just 35 percent of its static loss. That is, the additional productivity and economic growth stimulated by the credit raise federal revenue by almost enough to pay for itself.63
The Senate version of the tax bill would have extended the R&D credit permanently. The conference agreement extends it only for five years, until 2004. While a result less than optimum, a longer extension of the R&D credit is better than the year-to-year extensions that Congress has implemented in years past.
[page]There are other provisions of the tax bill that make it worthy of support. In the end, however, the main justification for a tax cut is that the money belongs to the people and not the government. Too many of those in government implicitly believe that taxpayers are just another special interest, and that tax cuts are morally equivalent to pork-barrel spending programs. This is false. The taxpayer is the foundation upon which the entire government rests, and government is entitled to take his or her hard-earned funds only for legitimate constitutional purposes.
"Experience shows the government will only restrain its profligacy if its allowance is cut."
Today, a great deal of what the government spends the taxpayer's money on is neither legitimate nor constitutional. This is a sufficient reason to reduce taxes, for experience shows that only when the government's allowance is cut off will it make a serious effort to restrain its profligacy. Throughout history, governments have taken taxpayers for granted, only to be shocked when they rise up in revolt. Although taxpayers today may not yet be in a revolutionary mood, it should be remembered that in the past, tax burdens far below those we have today have triggered tax revolts.64
The Congress has passed a good tax bill that addresses many pressing problems in taxation. On balance, if it becomes law, it will have a beneficial effect on the nation's economy in addition to reducing the tax burden and forcing some fiscal restraint.
NOTE: Nothing written here should be construed as necessarily reflecting the views of the National Center for Policy Analysis or as an attempt to aid or hinder the passage of any bill before Congress.
[page]- These are unpublished data from the Census Bureau web site.
- The long-term impact of the 1993 tax increase was to raise federal revenues by 0.7 percent of GDP per year. The long-term impact of the 1997 tax cut was to lower revenues by 0.2 percent per year. The 1999 tax cut phases in very slowly and will not reach 0.5 percent of GDP until 2003. Thus it will not be until 2003 that the combined effect of the 1997 and 1999 tax cuts will have offset 100 percent of the 1993 tax increase, which was enacted for the sole purpose of balancing the budget. The budget came into balance in 1998, but the Clinton Administration did not then suggest repeal of the 1993 tax increase.
- Data from Joint Committee on Taxation, Estimates of Federal Tax Expenditures for Fiscal Years 1999-2003, JCS-7-98 (Washington: U.S. Government Printing Office, 1998), p. 25.
- The Treasury Department's analysis is contained in a letter from Linda L. Robertson, Assistant Secretary for Legislative Affairs, to Sen. William Roth on August 5, 1999. There are serious problems with the way the Treasury distributes the impact of tax cuts, which tend to make them appear skewed much more to the rich than they actually are. For a discussion, see Bruce Bartlett, "Why Treasury's Numbers Don't Add Up," National Center for Policy Analysis, Brief Analysis No. 234, June 27, 1997; and "Income Distribution," National Center for Policy Analysis, Brief Analysis No. 303, August 10, 1999.
- Martin Sullivan, "Keeping Score on Class Warfare: JCT and Treasury Are Miles Apart," Tax Notes (August 16, 1999), p. 968. Emphasis in original.
- For a discussion of the deficiencies of the 1997 legislation, see Bruce Bartlett, "Tax Aspects of the 1997 Budget Deal," National Tax Journal, Vol. 51, No. 1 (March 1998), pp. 127-141.
- For a thorough review of the latest research, see Willi Leibfritz, John Thornton and Alexandra Bibbee, "Taxation and Economic Performance," OECD Economics Department Working Paper No. 176 (1997).
- For elaboration of this point, see Bruce Bartlett, "The Futility of Raising Tax Rates," Cato Institute, Policy Analysis No. 192, April 8, 1993.
- The government already does this with the Earned Income Tax Credit.
- Treasury Secretary Lawrence Summers has dismissed efforts to abolish the estate tax as motivated by nothing but "selfishness." He later retracted the comment, but there is no reason to believe that this isn't the basic view of the Clinton Administration on this matter. Clay Chandler, "Treasury Official Slams Estate Tax Rollback Efforts," Washington Post (April 22, 1997).
- David Joulfaian, "The Federal Estate and Gift Tax: Description, Profile of Taxpayers, and Economic Consequences," Office of Tax Analysis Paper 80 (December 1998), . The Treasury also makes distribution of the tax cut appear more weighted toward the wealthy by attributing the estate tax to the incomes of decedents. This is wrong for two reasons. First, the tax is paid out of assets, not income. Attributing the tax to incomes, therefore, is like comparing apples and oranges. Second, most economists believe that the ultimate burden of the tax is on heirs, who tend to have lower incomes than decedents. Attributing the tax to them, therefore, would reduce the share of the tax cut going to the wealthy and increase the share going to those with more modest incomes. See Ryan Donmoyer, "Estimating Estate Tax Burden Is Troubling Issue for JCT," Tax Notes (August 2, 1999), pp. 651-2.
- Alan Blinder, "Inequality and Mobility in the Distribution of Wealth," Kyklos, Vol. 29, No. 4 (1976), p. 619.
- The top federal estate tax rate is 55 percent on estates over $3 million. Among major countries, only Japan has a higher top rate and it doesn't hit until an estate reaches more than $15 million. See American Council for Capital Formation, An International Comparison of Death Tax Rates, (June 1999), at .
- George Cooper, A Voluntary Tax? New Perspectives on Sophisticated Estate Tax Avoidance (Washington: Brookings Institution, 1979), p. 4.
- Henry J. Aaron and Alicia H. Munnell, "Reassessing the Role for Wealth Transfer Taxes," National Tax Journal, Vol. 45, No. 2 (June 1992), p. 138. For some methods whereby estate taxes can be sharply reduced or eliminated through careful planning, see Lynn Asinof, "Estate-Planning Techniques for the Rich," Wall Street Journal (January 11, 1995); Christopher Drew and David Cay Johnston, "For Wealthy Americans, Death Is More Certain Than Taxes," New York Times (December 22, 1996); Janet Novak, "Cut Your Estate Tax in Half," Forbes (October 19, 1998), pp. 160-62; Ruth Simon, "How to Pass Assets to Heirs and Save Taxes," Wall Street Journal (December 21, 1998).
- Again, this is a point that even liberal economists now agree with. For example, Joseph Stiglitz, chairman of the Council of Economic Advisers under Bill Clinton, has written that because of its effects on capital accumulation the estate tax "may actually increase inequality." Joseph Stiglitz, "Notes on Estate Taxes, Redistribution, and the Concept of Balanced Growth Path Incidence," Journal of Political Economy, Vol. 86, No. 2, pt. 2 (April 1978), p. S137.
- B. Douglas Bernheim, "Does the Estate Tax Raise Revenue?" in Lawrence H. Summers, ed., Tax Policy and the Economy, Vol. 1 (Cambridge: MIT Press, 1987), pp. 113-38. Incidentally, the editor is the same Lawrence Summers who is now Secretary of the Treasury.
- Travis Research Associates, Survey of the Impact of the Federal Estate Tax on Family Business Employment Levels in Upstate New York (Albany: Public Policy Institute of New York State, 1999).
- Robert Johnson, "Family Businesses Fret About Taxes and Estate Planning," Wall Street Journal (February 16, 1999); Jeff A. Taylor, "Planning for Death and Taxes," Investor's Business Daily (January 29, 1997).
- Dan Miller, The Economics of the Estate Tax (Washington: Joint Economic Committee, 1998), p. 21, available on the web at . This conclusion is based on methodology developed in Laurence J. Kotlikoff and Lawrence H. Summers, "The Role of Intergenerational Transfers in Aggregate Capital Formation," Journal of Political Economy, Vol. 89, No. 4 (August 1981), pp. 706-32. Again, it should be noted that the author of this study is the same Lawrence Summers who is now Secretary of the Treasury.
- Richard F. Fullenbaum and Mariana A. McNeill, The Effects of the Federal Estate and Gift Tax on the Aggregate Economy (Washington: Research Institute for Small & Emerging Business, 1998).
- Douglas Holtz-Eakin, "The Death Tax: Investments, Employment, and Entrepreneurs," Tax Notes, Vol. 84, No. 5 (August 2, 1999), p. 782. See also Gerald P. Moran, "Estate and Gift Taxation: The Case for Repeal," Tax Notes, Vol. 13, No. 7 (August 17, 1981), pp. 339-343; David M. Hudson, "Tax Policy and the Federal Taxation of the Transfer of Wealth," Willamette Law Review, Vol. 19, No. 1 (Winter 1983), pp. 1-60; Joel C. Dobris, "A Brief for the Abolition of All Transfer Taxes," Syracuse Law Review, Vol. 35, No. 4 (1984), pp. 1215-1234; Charles O. Galvin, "To Bury the Estate Tax, Not To Praise It," Tax Notes, Vol. 52, No. 12 (September 16, 1991), pp. 1413-19; John E. Donaldson, "The Future of Transfer Taxation: Repeal, Restructuring and Refinement, or Replacement," Washington and Lee Law Review, Vol. 50, No. 2 (Spring 1993), pp. 539-64; Christopher E. Erblich, "To Bury Federal Transfer Taxes Without Further Adieu," Seton Hall Law Review, Vol. 24, No. 4 (1994), pp. 1931-68; Edward J. McCaffery, "The Political Liberal Case Against the Estate Tax," Philosophy & Public Affairs, Vol. 23, No. 4 (Fall 1994), pp. 281-312; Edward J. McCaffery, "The Uneasy Case for Wealth Transfer Taxation," Yale Law Journal, Vol. 104, No. 2 (November 1994), pp. 283-365; N. Gregory Mankiw, "Why Shouldn't We Die Tax-Free?" Fortune (September 6, 1999), pp. 54, 56.
- Henry C. Simons, Personal Income Taxation (Chicago: University of Chicago Press, 1938), p. 155; Robert M. Haig, "The Concept of Income – Economic and Legal Aspects," in Robert M. Haig, ed., The Federal Income Tax (New York: Columbia University Press, 1921), reprinted in Richard A. Musgrave and Carl Shoup, eds., Readings in the Economics of Taxation (Homewood, Ill.: Richard D. Irwin, 1959), p. 67.
- Jacob Viner, "Taxation and Changes in Price Levels," Journal of Political Economy, Vol. 31 (August 1923), p. 498; Richard A. Musgrave, The Theory of Public Finance (New York: McGraw-Hill, 1959), p. 169; Richard Goode, The Individual Income Tax, revised ed. (Washington: Brookings Institution, 1976), p. 184; Joseph A. Pechman, Federal Tax Policy, 5th ed. (Washington: Brookings Institution, 1987), p. 120.
- Martin Feldstein and Joel Slemrod, "Inflation and the Excess Taxation of Capital Gains on Corporate Stock," National Tax Journal, Vol. 31, No. 2 (June 1978), pp. 107-118
- U.S. Treasury Department, Report to Congress on the Capital Gains Reductions of 1978 (Washington: U.S. Government Printing Office, 1985), p. 11.
- Taxes calculated by multiplying nominal gains by the effective tax rate on capital gains that year. Data on effective rates obtained from the Treasury Department.
- Congressional Budget Office, Indexing Capital Gains (Washington: U.S. Government Printing Office, 1990), p. 24.
- Congressional Budget Office, "Perspectives on the Ownership of Capital Assets and the Realization of Capital Gains," CBO Papers (May 1997), p. 29, available on the Internet at .
- Robert Eisner, "Capital Gains and Income: Real Changes in the Value of Capital in the United States, 1946-77," in Dan Usher, ed., The Measurement of Capital (Chicago: University of Chicago Press, 1980), pp. 202-203.
- Alan Blinder, "The Level and Distribution of Economic Well-Being," in Martin Feldstein, ed., The American Economy in Transition (Chicago: University of Chicago Press, 1980), p. 447.
- Victor Canto, "Index Capital Gains – Now," Wall Street Journal (July 27, 1999).
- This may be due to the fact that investors with modest assets tend to hold them longer than those with larger assets. Since the impact of inflation is greater the longer an asset is held, this causes those with modest wealth to suffer more. See Joint Committee on Taxation, Tax Treatment of Capital Gains and Losses, JCS-4-97 (Washington: U.S. Government Printing Office, 1997), p. 38.
- Standard & Poor's DRI, Capital Gains Taxes and the Economy: A Retrospective Look (Washington: American Council for Capital Formation, 1999).
- Bruce Bartlett, "The Marriage Penalty: Origins, Effects, and Solutions," Tax Notes, Vol. 80, no. 11 (September 14, 1998), pp. 1341-57; Congressional Budget Office, For Better or For Worse: Marriage and the Federal Income Tax (Washington: U.S. Government Printing Office, 1997); U.S. General Accounting Office, Income Tax Treatment of Married and Single Individuals, GAO/GGD-96-175 (September 1996).
- Nicholas Bull and Janet Holtzblatt, "Defining and Measuring Marriage Penalties and Bonuses," Office of Tax Analysis Paper 82 (April 1999), at .
- Dorothy A. Brown, "The Marriage Bonus/Penalty in Black and White," University of Cincinnati Law Review, Vol. 65, No. 3 (Spring 1997), pp. 787-798; idem, "Race, Class, and Gender Essentialism in Tax Literature: The Joint Return," Washington and Lee Law Review, Vol. 54, No. 4 (Fall 1997), pp. 1469-1512.
- Howard V. Hayghe, "Working Wives' Contributions to Family Incomes," Monthly Labor Review, Vol. 116, No. 8 (August 1993), pp. 39-43. See also U.S. Commission on Civil Rights, The Economic Status of Black Women: An Exploratory Investigation (Washington: U.S. Government Printing Office, 1990), pp. 100, 105; Maria Cancian, Sheldon Danziger and Peter Gottschalk, "Working Wives and Family Income Inequality Among Married Couples," in Sheldon Danziger and Peter Gottschalk, eds., Uneven Tides: Rising Inequality in America (New York: Russell Sage Foundation, 1993), pp. 205-207; Families and Work Institute, Women: The New Providers (Benton Harbor, Mid.: Whirlpool Foundation, 1995), p. 33.
- Jane H. Leuthold, "The Effect of Taxation on the Probability of Labor Force Participation by Married Women," Public Finance, Vol. 33, No. 3 (1978), pp. 280-293; idem, "Taxes and the Two-Earner Family: Impact on the Work Decision," Public Finance Quarterly, Vol. 7, No. 2 (April 1979), pp. 147-161; idem, "Income Splitting and Women's Labor-Force Participation," Industrial and Labor Relations Review, Vol. 38, No. 1 (October 1984), pp. 98-105; Aline O. Quester, "The Effect of the Tax Structure on the Labor Market Behavior of Wives," Journal of Economics and Business, Vol. 29, No. 3 (Spring/ Summer 1977), pp. 171-180; idem, "Women's Behavior and the Tax Code," Social Science Quarterly, Vol. 59, No. 4 (March 1979), pp. 665-680.
- Daniel Feenberg, "The Tax Treatment of Married Couples and the 1981 Tax Law," National Bureau of Economic Research Working Paper No. 872 (April 1982).
- Nada Eissa, "Taxation and Labor Supply of Married Women: The Tax Reform Act of 1986 as a Natural Experiment," National Bureau of Economic Research Working Paper No. 5023 (February 1995); idem, "Tax Reforms and Labor Supply," in James M. Poterba, ed., Tax Policy and the Economy, Vol. 10 (Cambridge, MA: MIT Press, 1996), pp. 119-151.
- Deenie K. Neff, "Married Women's Labor Supply and the Marriage Penalty," Public Finance Quarterly, Vol. 18, No. 4 (October 1990), pp. 420-432.
- Martin Feldstein and Daniel Feenberg, "The Taxation of Two- Earner Families," in Martin Feldstein and James M. Poterba, eds., Empirical Foundations of Household Taxation (Chicago: University of Chicago Press, 1996), pp. 39-73.
- James Alm and Leslie A. Whittington, "Income Taxes and the Marriage Decision," Applied Economics, Vol. 27, No. 1 (January 1995), pp. 25-31; idem, "Does the Income Tax Affect Marital Decisions?" National Tax Journal, Vol. 48, No. 4 (December 1995), pp. 565-572; idem, "Income Taxes and the Timing of Marital Decisions," Journal of Public Economics, Vol. 64, No. 2 (May 1997), pp. 219-240; David L. Sjoquist and Mary Beth Walker, "The Marriage Tax and the Rate and Timing of Marriage," National Tax Journal, Vol. 48, No. 4 (December 1995), pp. 547-548; Alexander Gelardi, "The Influence of Tax Law Changes on the Timing of Marriages: A Two-Country Analysis," National Tax Journal, Vol. 49, No. 1 (March 1996), pp. 17-30.
- Leslie A. Whittington and James Alm, "'Til Death or Taxes Do Us Part: The Effect of Income Taxation on Divorce," Journal of Human Resources, Vol. 32, No. 2 (Spring 1997), pp. 388-412; Stacy Dickert-Conlin, "Taxes and Transfers: Their Correlation with Marital Separation," 1996 Proceedings of the 89th Annual Conference on Taxation (Washington: National Tax Association, 1997), pp. 299-305.
- Robert Shapiro, "Piggy Banks, Then and Now," New York Times (August 19, 1999). Mr. Shapiro is Under Secretary for Economic Affairs at the Commerce Department.
- John Sabelhaus and Ken Ayotte, "The Effect of Tax-Deferred Savings Plans on Household Wealth Accumulation: Evidence from the Survey of Consumer Finances," Congressional Budget Office Technical Paper 1999-4 (March 1998); R. Glenn Hubbard and Jonathan Skinner, Assessing the Effectiveness of Saving Incentives (Washington: American Enterprise Institute, 1996); James Poterba, Steven Venti and David Wise, "The Effects of Special saving Programs on Saving and Wealth," National Bureau of Economic Research Working Paper No. 5287 (October 1995); Jonathan Skinner, "Individual Retirement Accounts: A Review of the Evidence," Tax Notes, Vol. 54, No. 2 (January 13, 1992), pp. 201-212.
- Tim Callen and Christian Thimann, "Empirical Determinants of Household Saving: Evidence from OECD Countries," International Monetary Fund Working Paper WP/97/181 (December 1997).
- Joint Committee on Taxation, Present Law and Background Relating to the Marriage Tax Penalty, Education Tax Incentives, the Alternative Minimum Tax, and Expiring Tax Provisions, JCX-39-99 (June 22, 1999), p. 46.
- Robert Harvey and Jerry Tempalski, "The Individual AMT: Why It Matters," National Tax Journal, Vol. 50, No. 3 (September 1997), pp. 453-73.
- Robert Rebelein and Jerry Tempalski, "Effect of TRA '97 on the Individual AMT," Tax Notes, Vol. 80, No. 6 (August 10, 1998), pp. 717-26; Albert B. Crenshaw, "Alternative-Tax Law Starting to Go Awry," Washington Post (December 6, 1998); Karen Hube and Tom Herman, "You May Be Richer Than You Thought (And Poorer, Thanks to a 'Stealth Tax')," Wall Street Journal (December 17, 1998).
- U.S. General Accounting Office, Experience With the Corporate Alternative Minimum Tax, GAO/GGD-95-88 (April 1995).
- Ibid., p. 41.
- American Council for Capital Formation, The Case for Corporate AMT Repeal (August 1996).
- Andrew B. Lyon, Cracking the Code: Making Sense of the Corporate Alternative Minimum Tax (Washington: Brookings Institution, 1997), p. 4.
- Martin Sullivan, "Business Versus Business at Ways and Means Markup," Tax Notes, Vol. 75, No. 11 (June 16, 1997), p. 1447.
- The classic statement of this is Robert M. Solow, "A Contribution to the Theory of Economic Growth," Quarterly Journal of Economics, Vol. 70, No. 1 (February 1956), pp. 65-94. Solow was later awarded the Nobel Prize in economics for this work.
- A recent estimate concluded that society gets less the one fourth of the R&D that is socially optimal. Charles I. Jones and John C. Williams, "Measuring the Social Return to R&D," Federal Reserve Board, Finance and Economics Discussion Series 1997-12 (February 1997).
- It is sometimes argued that businesses engage in less R&D than is socially desirable because the stock market undervalues it. However, recent research shows that the market does value R&D appropriately, although investors may not be as informed on this matter as they should be. See Louis K.C. Chan, Josef Lakonishok and Theodore Sougiannis, "The Stock Market Valuation of Research and Development Expenditures," National Bureau of Economic Research Working Paper No. 7223 (July 1999).
- Office of Technology Assessment, The Effectiveness of Research and Experimentation Tax Credits (September 1995). This estimate is confirmed in Bronwyn Hall and John van Reenen, "How Effective Are Fiscal Incentives for R&D? A Review of the Evidence," National Bureau of Economic Research Working Paper No. 7098 (April 1999).
- Jesus C. Dumagan, "Re-examining the Cost-Effectiveness of the Research and Experimentation Tax Credit," Office of Business and Industrial Analysis, Office of Policy Development, Economics and Statistics Administration, U.S. Department of Commerce, Paper ESA/OPD 95-1 (June 1995). This estimate is the same as in Bronwyn H. Hall, "R&D Tax Policy During the 1980s: Success or Failure?" in James M. Poterba, ed., Tax Policy and the Economy, Vol. 7 (Cambridge: MIT Press, 1993), pp. 1-35.
- Ken Brown, ed., The R&D Tax Credit: Issues in Tax Policy and Industrial Innovation (Washington: American Enterprise Institute, 1984), pp. 39-47.
- Economics Benefits of the R&D Tax Credit (Washington: Coopers & Lybrand, 1998).
- See Charles Adams, Those Dirty Rotten Taxes: The Tax Revolts that Built America (New York: Free Press, 1998).
Figures I, II and III. These data come from the National Income and Product Accounts published by the Department of Commerce. They are a more accurate measure of federal receipts because they include many revenues excluded from the more familiar budget data published by the Office of Management and Budget. For details, see Budget of the United States Government, Fiscal Year 2000: Analytical Perspectives (Washington: U.S. Government Printing Office, 1999), pp. 351-355.
The historical GDP and federal receipts data are from U.S. Department of Commerce, National Income and Product Accounts of the United States, 1929-94: Volume 1 (Washington: U.S. Government Printing Office, 1998). More recent data are from the Joint Economic Committee's Economic Indicators. Forecast data are from Congressional Budget Office, The Federal Sector of the National Income and Product Accounts (July 30, 1999), and The Economic and Budget Outlook: An Update (July 1, 1999).
Data on the effects of the tax bill on revenues are from Joint Committee on Taxation, Estimated Budget Effects of the Conference Agreement for H.R. 2488, JCX-61-99 (August 5, 1999), available at: http://www.house.gov/jct/x-61-99r.pdf.
Figure IV. Data are from the Joint Committee on Taxation from a House Ways & Means Committee press release on February 16, 1999.
Figure V. Data are from Internal Revenue Service, Statistics of Income Bulletin (Spring 1999), pp. 33-35.
Figure VI. From Joint Committee on Taxation, Distributional Effects of the Conference Agreement for H.R. 2488, JCX-62-99 (August 5, 1999), available at: http://www.house.gov/jct/x-63-99.pdf. These data differ from those in Figure IV because they include all federal taxes, whereas Figure IV is for income taxes only.
Figure VII. Calculated from unpublished Internal Revenue Service data at:
Figure VIII. From Congressional Budget Office, "Perspectives on the Ownership of Capital Assets and the Realization of Capital Gains," CBO Papers (May 1997), p. 29, available on the Internet at . The data assume no loss limits.
Figure IX. From the Department of Commerce's personal income data, as published in Economic Indicators.
Table I. Based on Jerry Tempalski, "Revenue Effects of Major Tax Bills," Office of Tax Analysis Paper 81 (December 1998), available at: http://www.ustreas.gov/ota/ota81.pdf, plus the data in Figure III.
Table II. Data are from Congressional Budget Office, The Economic and Budget Outlook: Fiscal Years 2000-2009 (Washington: U.S. Government Printing Office, 1999), p. 50.
[page]Bruce Bartlett is a Senior Fellow with the National Center for Policy Analysis. He was Deputy Assistant Secretary for Economic Policy at the U.S. Treasury Department from September 1988 to January 1993, and a Senior Policy Analysis in the White House Office of Policy Development in 1987 and 1988. Bartlett joined the staff of the Joint Economic Committee of Congress as Deputy Director in 1981, becoming Executive Director in 1983. Prior to joining the JEC staff, he served on the staffs of Reps. Ron Paul and Jack Kemp and was chief legislative assistant to Sen. Roger Jepsen. While with Rep. Kemp, he
helped draft the Kemp-Roth tax bill. Bartlett has published more than 700 articles in national publications including the Wall Street Journal, New York Times, Los Angeles Times and Washington Post, and prominent magazines such as Fortune. His twice-weekly column on economic policy is published in the Washington Times and Detroit News and is nationally syndicated by Creators Syndicate. In 1996 one of Bartlett's columns inspired Bob Dole to propose a 15-percent tax reduction plan when he ran for president. Bartlett has also written for academic journals and published four books, including Reaganomics: Supply-Side Economics in Action, published in 1981. From 1985 through 1987 he was a Senior Fellow at the Heritage Foundation in Washington, D.C.