This study uses a simulation model to evaluate a number of proposals to reform the Social Security system. Our analysis is sufficiently broad to allow us to form some general conclusions about the process of Social Security reform:
- According to the latest Trustees Report, our Social Security system will require (a) increasing the payroll tax by more than one-half (b) cutting benefits by one-third or (c) some combination of the two sometime during the next century.
- Any major increase in taxes is likely to lower productivity and lower incomes for future generations, and any substantial cut in benefits will lower the standard of living of future retirees unless other policies are adopted to encourage Americans to increase their savings during their working years.
- It is possible to secure currently promised Social Security benefits indefinitely into the future without increasing tax rates or increasing government debt.
- However, achieving this goal requires at least partially replacing our current system of pay-as-you-go finance with a funded system that makes investments in income-earning assets.
- Partial funding of future Social Security benefits can also eliminate Social Security's unfunded liability – currently estimated at $4.5 trillion over the next 75 years.
- Although the cost of transition to the new system is high – requiring almost all of the projected budget surpluses – changing the system now will more than pay for itself in future years.
- If the funding mechanism is personal retirement accounts (PRAs), it is possible to design the transition so the generation currently entering the labor market – and each succeeding generation – can fully fund its retirement benefits from its PRAs.
- Beyond that point, it will be possible to completely eliminate the regressive payroll tax that currently funds Social Security.
- The federal government can guarantee that every retiree will receive a pension at least as great as that promised by the current system and can do so at a fraction of the current system's cost; however, in the face of such a guarantee PRA funds must be invested conservatively in broadly diversified portfolios.
- The new, fully funded system can have progressive features, including (a) guaranteeing the current system's progressive schedule of benefits, (b) enabling those with shorter life expectancies to leave their PRA accumulations to their heirs, prior to retirement, and (c) allowing policymakers to eventually use the income tax rather than the payroll tax to pay minimum benefits to low-income retirees with insufficient savings.
Recognition is growing in Congress among both Democrats and Republicans that Social Security reform needs to be an urgent national priority. To help think through this process, we have completed a detailed analysis of four specific reform plans using a computer simulation model developed by the Private Enterprise Research Center (PERC) and the National Center for Policy Analysis (NCPA). This model differs from the one used by the Social Security Administration (SSA) in three important ways. First, our projections of Social Security revenues and expenditures are more conservative (pessimistic) than SSA's. Second, we do not treat the government bonds held by the Social Security trust funds, nor the interest paid thereon, as real assets that can fund future spending. Since the government cannot pay benefits with IOUs it has written to itself, any reform plan must be funded from real tax revenues. Finally, our model predicts that an increase in privately invested funds will increase the capital stock, which will in turn increase future government revenue at existing tax rates. We treat this new revenue as a potential funding source to pay Social Security benefits to the baby boomer generation as well as later generations of retirees.
Sens. Phil Gramm (R-Texas) and Pete Domenici (R-N.M.) propose to allow workers to divert a portion of their payroll taxes into personal retirement accounts, invested in professionally managed funds holding diversified portfolios (60 percent equities, 40 percent bonds). Since the plan promises no new taxes and no benefit cuts, initial deposits must be limited to the amount that can be funded from projected budget surpluses – about 2.5 percent of wages. Over time the deposits made to PRAs, which reflect additions to the nation's capital stock, would lead to a larger economy, producing more tax revenues at existing tax rates. This extra revenue would fund larger deposits, eventually rising to 4.85 percent of wages – the amount needed to fund all promised benefits plus a 20 percent bonus for the average worker.
The benefits workers receive on retirement would be guaranteed to equal the benefits scheduled under the current system, plus an amount equal to 20 percent of the annuity they can purchase with their private account. At the time of retirement, the balance in a worker's PRA would be turned into an annuity and Social Security would pay the difference between the annuity and the guaranteed benefit. Under the plan, we project that:
- By 2030 new retirees would receive one-fourth of their monthly benefit from private annuities, and by 2050 the annuities would fund one-half of promised benefits.
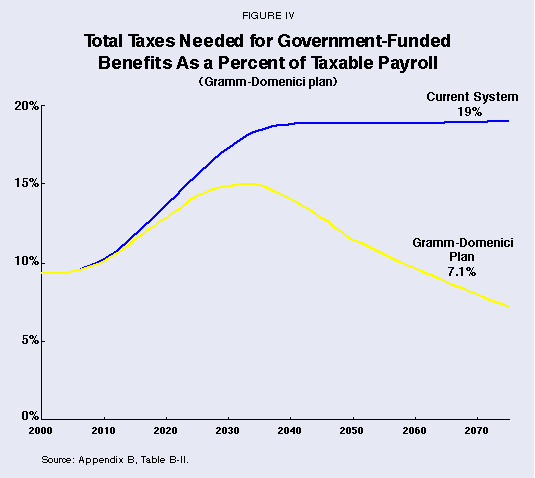
- By the year 2075 government funded benefits would equal only 7.1 percent of payroll, compared to a 19 percent payroll tax that would be needed if no reforms are adopted.
Reps. Bill Archer (R-Texas) and Clay Shaw (R-Fla.) propose that workers receive an annual refundable income tax credit equal to 2 percent of wages for deposits to PRAs. Although the mechanism for funding PRA accounts appears substantially different from the Gramm plan, the initial funding source is the same – projected budget surpluses. In contrast to the Gramm plan, however, Archer-Shaw would have the Social Security Administration, rather than private firms, administer the annuities during a worker's retirement years. Retirees are guaranteed they will receive at least as much as currently scheduled benefits. We estimate that:
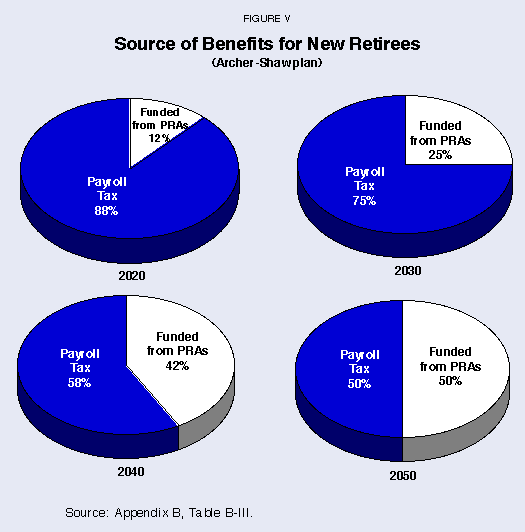
- Like the Gramm plan, the Archer-Shaw plan would allow annuities funded from PRA accumulations to replace one-fourth of promised benefits by 2030 and one-half of benefits by 2050.
- Beyond that point, however, the Archer-Shaw plan continues this division – with PRAs and tax-supported payments each sharing roughly half the burden indefinitely into the future.
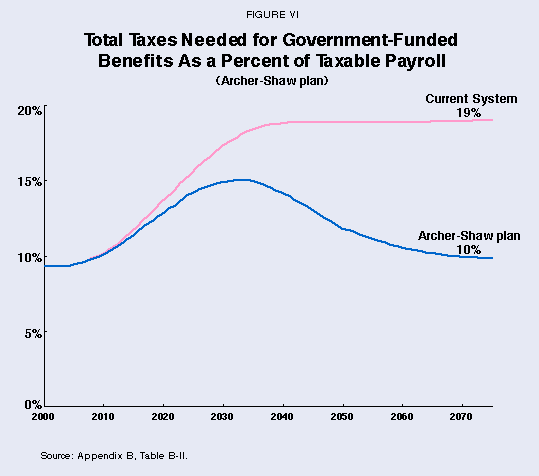
- Even so, by 2075 Archer-Shaw requires taxes equal to only 10 percent of payroll, compared to a needed tax of 19 percent with no reform.
A bipartisan proposal sponsored by members of both houses of Congress and both parties would eliminate Social Security's unfunded liability by raising taxes (one-third) and reducing benefits (the other two-thirds). After 75 years, Social Security benefits would only be about 78 percent of what is promised under current law. Under the plan, workers would be allowed to divert 2 percent of their earnings into private accounts, with low-income workers receiving federal matching funds to bolster their contributions. At retirement, a portion of the accounts would be used to offset Social Security benefits.
The bipartisan plan has no explicit guarantee of monthly pension benefits, other than a minimum guaranteed income. For this reason, the plan can afford to allow PRA holders more investment choices than the other plans. If workers invest their PRA funds in U.S. government bonds, they will be assured of getting a private annuity payment equal to what the current system would have paid. If they make riskier investments (i.e., stocks and corporate bonds), they could receive a higher or lower monthly pension.
Because the bipartisan plan substantially reduces promised benefits, the fraction of benefits funded by PRAs is greater than under Gramm-Domenici or Archer-Shaw. We estimate that:
- By 2030 private annuities would pay 28 percent of promised benefits, rising to 70 percent by 2050.
- The savings to the government are comparable to the other two plans: government-funded benefits would equal only 8.2 percent of taxable payroll by 2075.
Like the Gramm-Domenici and Archer-Shaw plans, a plan developed by the National Center for Policy Analysis (NCPA) and the Private Enterprise Research Center (PERC) at Texas A&M proposes to reform Social Security without raising taxes or lowering benefits. However, under this plan, younger workers would contribute at a higher rate, and older workers at a lower rate. This would insure that the current generation entering the labor market, and every succeeding generation, is able to completely fund its promised benefits from its PRA accounts. Benefits would be guaranteed to equal currently projected Social Security benefits plus a bonus of 10 percent of PRA accumulations.
In the early years of the transition, the proportion of retirement benefits funded from PRAs would be lower than under the other plans. However, the higher contribution rate of younger workers would add to the nation's stock of capital more quickly, allowing a shorter transition to a system funded by individually owned PRAs rather than payroll taxes. Specifically:
- By 2030 only 26 percent of new retiree benefits would be funded by private annuities.
- By 2050 new retirees would rely on their PRAs for 100 percent of their benefits.
- By 2070 the payroll tax funding Social Security retirement benefits could be completely eliminated.
While transition to a funded system would be costly, the current era of budget surpluses presents a unique opportunity to do so without raising taxes or cutting benefits. Among the benefits of reform are providing a more secure retirement for all workers, allowing workers to own their own retirement savings, giving workers the right to bequeath the buildup to their heirs, increasing national savings and ultimately increasing in national income. The cost of not making necessary reforms now is the growing certainty that taxes will be raised and benefits will be cut in the future.
So let me say to you tonight, I reach out my hand to all of you in both houses, in both parties, and ask that we join together in saying to the American people: We will save Social Security now.
President William Jefferson Clinton
State of The Union Address, January 19, 1999
[page]We can't wait until next year to start saving Social Security.
Senator Phil Gramm, April 28, 1998
….the time for action is now upon us. If Congress is to reach agreement in 1999 on needed changes to the Social Security system, we must begin consideration immediately of legislative options to address the long-run solvency of this vitally important program.
Bipartisan Social Security Coalition. Founding members include Senators Daniel Patrick Moynihan, Judd Gregg, J. Robert Kerrey, John B. Breaux, Dan Coats, Charles S. Robb, Craig Thomas and Fred Thompson, September 24, 1998
"The current Social Security system is on an unsustainable path."
As is clear from the above quotations, politicians across the ideological spectrum agree that Social Security needs to be reformed now. Yet they disagree about how it should be done. The 1994-96 Advisory Council on Social Security was formed to review annual forecasts made by the Social Security and Medicare trustees concerning the long-term actuarial soundness of the Social Security system and to make policy recommendations. While the council members agreed that Social Security must be reformed, in large part because of the changing demographics in the United States, they could not reach consensus. Instead, they issued a final report that included three different options.1 Since then, there have been a number of reform proposals – including plans put forth by President Clinton and members of Congress.
[page]The case for radical reform of Social Security is strong. And with each passing year it gets stronger.
Argument No. 1: The Current System Is on an Unsustainable Path. The 1999 Trustees Report2 predicts that by 2014 expenditures will begin to exceed revenues and will continue to exceed revenues in every year there after. In general, the further we look into the future, the worse the imbalance becomes.
- Based on the Social Security Trustees "intermediate assumptions," the amount of revenue needed to pay benefits already promised under current law will rise from 12.4 percent of taxable payroll today to 17 percent by 2030 and almost 19 percent by 2070.
- Based on the "pessimistic assumptions," the needed payroll tax will reach almost 20 percent by 2030 and almost 27 percent by 2070.
- This implies that 70 years from now workers will have to pay almost one out of every five dollars they earn – and possibly more than one out of every four – just to fund Social Security.
As the Trustees Report indicates, sometime in the next century we will be forced to (a) double the payroll tax rate or (b) cut every benefit in half or (c) some combination of the two. This dire eventuality will arise in large part because people are expected to live longer and have fewer children than they did in the past. Currently there are 3.4 workers per retiree. By 2030 the number will drop to about 2.1. Pay-as-you-go Social Security, which taxes the wages of today's workers to pay the benefits of today's retirees, is also susceptible to demographic shocks like the baby boom.
Argument No. 2: The Current System Is a Bad Deal for Young Workers. Even if Social Security keeps all of its promises, the vast majority of working taxpayers will get a return on their contributions far below what they could have earned by investing some of those tax dollars in the private capital market. For example, Laurence Kotlikoff and his colleagues have calculated that under the current system:3
- Baby boomers will get a real rate of return of less than 2 percent.
- Generation Xers will get less than 1 percent.
- Today's newborns will get a rate of return close to zero.
"Today's young workers will receive only about 50 cents in benefits for every dollar paid in Social Security taxes."
Even with no change in the law, today's young workers will receive only about 50 cents in retirement benefits for every dollar they pay in Social Security taxes during their working lives.4 Cutting benefits or raising taxes will reduce the expected return even more.5
Argument No. 3: The Current System Lowers Saving and Investment and Reduces Economic Growth. The unfunded liabilities of the system (that is, the benefits already accrued by workers and retirees minus expected tax revenues) are twice the explicit national debt – which has already crowded out a significant amount of private investment relative to a prefunded system. Less investment, in turn, means less income and growth.
In addition, both theoretical analysis and empirical evidence show that national saving is lower under Social Security than it would have been if the system had originally been set up as a funded system. The reason is that when young workers in the current system expect a retirement subsidy, and at the same time pay an earmarked payroll tax that lowers disposable income, their ability and incentive to save are reduced.6
Switching to a defined contribution system under which each generation makes deposits to private accounts to fund its own retirement benefits would reduce the distortion.
Argument No. 4: The Current System Penalizes Work and Lowers National Output. Economic theory teaches that if you tax something, you will get less of it. Since the Social Security payroll tax is a tax on income from work, it discourages people from working more hours and earning more income.7 In 1995, economist Martin Feldstein estimated that the economic loss due to the Social Security tax was $68 billion, or 2.35 percent of the tax base. He and Andrew Samwick also estimate that once a prepaid system matures, the economic gains resulting from the reduced cost of financing are more than enough to pay for the contributions to private retirement accounts.8 In other words, privatization pays for itself.
As outlined in Laurence Kotlikoff's approach, the first step of fundamental reform is eliminating Social Security payroll taxes.9 Indeed, much of the gain identified in several privatization plans is associated with switching from a tax on production to a tax on consumption. For example, this could be accomplished by replacing the payroll tax with a national sales tax.10
[page]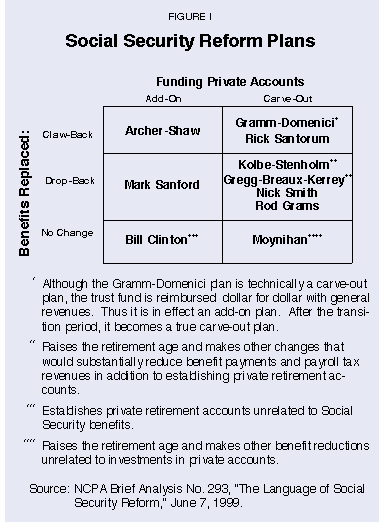
There are two fundamental approaches to reforming Social Security. One maintains the current system of pay-as-you-go finance and solves the system's unfunded liability by cutting benefits and/or raising taxes. The other replaces pay-as-you-go financing with a system in which each generation saves and invests in order to pay for its own retirement benefits.
"Most reform plans provide for the creation of personal retirement accounts."
Given the problems inherent in cutting benefits or raising taxes, most reform proposals provide for the creation of personal retirement accounts, with proceeds from the accounts used to reduce the government's obligation to pay benefits. Most reform plans that create personal retirement accounts propose to fund those accounts by using the budget surplus, but the mechanism differs from plan to plan, as Figure I shows.
Carve-Out Option. Under a "carve-out," some portion of a worker's Social Security payroll tax is redirected into a personal retirement account. Funds in these accounts are invested in stocks and bonds, and the accounts are owned by the individual worker.
For example, under the proposal of Sens. Phil Gramm (R-Texas) and Pete Domenici (R-N.M.),11 workers who choose the private sector option redirect 2.5 percentage points12 from their payroll taxes into their personal retirement account, with the remaining 9.9 percentage points continuing to go to the Social Security Trust Fund.
Examples of 2 percent carve-out plans include a bipartisan proposal by Sens. Judd Gregg (R-N.H.), John Breaux (D-La.), Bob Kerrey (D-Neb.) and others and a House version by Reps. Jim Kolbe (R-Ariz.) and Charlie Stenholm (D-Texas). In addition, Sen. Rick Santorum (R-Pa.) has proposed a carve-out option that varies the allowed deposit by income level – ranging from 4 percent for low-income workers to 3 percent for high-income workers. A proposal by Sen. Pat Moynihan (D-N.Y.) contains a 2 percent carve-out as a way of reducing the Social Security surplus, but it does not require that the money be saved and invested.
Add-On Option. As an alternative to carve-outs, "add-on" proposals fund private retirement accounts in some way other than by diverting the payroll tax. During his State of the Union address, President Clinton proposed Universal Savings Accounts (USA accounts). Under this proposal, workers automatically receive a tax credit of up to $600 per couple per year, deposited in their USA account. The couple can save up to $700 per year more in the account, and the government will match their savings dollar-for-dollar. With the automatic tax credit of $600 plus the matched tax credit of $700, the family will add $2,000, including the $1,300 tax credit, to their retirement savings each year. At retirement, seniors can draw on their USA accounts in addition to drawing Social Security. Thus the president's add-on proposal has no impact on the financial obligations of the existing Social Security system.
An add-on plan that does reduce Social Security's long-term liability has been proposed by Reps. Bill Archer (R-Texas) and Clay Shaw (R-Fla.). Their plan creates private retirement accounts financed by a 2 percent refundable income tax credit. At retirement each worker's monthly benefit would be paid from two sources: the funds that accumulate in a private retirement account and traditional Social Security.
Despite the apparent difference between the funding source of add-on plans and carve-out plans, the practical difference is small. In all cases, deposits to private accounts would be funded from projected budget surpluses.
The Claw-Back Option. All reform proposals that seek to replace the current pay-as-you-go system with a system funded by personal retirement accounts have a mechanism for reducing the government's obligation to pay benefits. One such mechanism is known as a "claw-back."
"Under a 'claw-back' approach, the benefit paid by Social Security is reduced by the amount funded from the private account."
Under this approach, each individual's monthly retirement benefit paid by Social Security is reduced by the amount funded from that individual's private account. For example, if the private retirement account is able to fund 60 percent of a retiree's monthly benefit, the government pays the other 40 percent. As private accounts accumulate, Social Security's financial obligation declines.
Some claw-back proposals permit workers who participate in the private system to receive a "bonus" at retirement over and above what they would have gotten under the current Social Security system. This bonus is a percent of their private retirement account that does not trigger a dollar-for-dollar claw-back of government-paid benefits.
A criticism of claw-back plans is that workers gain little from their private investments, since each dollar they save reduces the monthly pension they receive from the government. The same criticism, however, applies to one degree or another to all plans that replace pay-as-you-go Social Security with a funded system. The primary purpose of these proposals is first to achieve retirement security and then, if possible, to increase retirement benefits. Retiree benefits become more secure because they are funded with real assets rather than depending on the willingness of future taxpayers to pay high taxes.
An advantage of claw-back proposals is that they come with a government guarantee that every retiree will receive at least the same benefits as those promised under the current Social Security system. As a result, individuals making private investments face few of the risks that critics of change warn about. Because of the full integration of benefits and investments, no one can be worse off than under the current system – regardless of what happens in financial markets.
This guarantee means that claw-back proposals must narrow the range of individuals' investment options. Since everyone knows that he or she will get the promised benefits, many will be tempted to make risky investments. For this reason, claw-back proposals limit investment choices to conservative, diversified portfolios.
"The 'drop-back' option offers more investment choices, but individuals risk getting lower benefits."
The Drop-Back Option. As in the case of the claw-back, "drop-back" plans reduce the government's financial obligation as private account balances grow. But with the drop-back plan, a person can benefit from the internal growth of the private account by taking a little more risk. An advantage of the drop-back option is that individuals have more investment options, and they benefit from wise choices. A disadvantage is that individuals can do worse than they would have done under the current system if their investments perform poorly.
For example, under the bipartisan plan, at retirement government-paid benefits are reduced by the amount that could have been funded from private funds had they been invested in Treasury bonds. A stock or corporate bond fund is likely to earn a higher return than government bonds, thus workers who choose investments that outperform the Treasury bill rate will in effect receive a bonus. But they risk being penalized if their funds earn less than Treasury bills.
[page]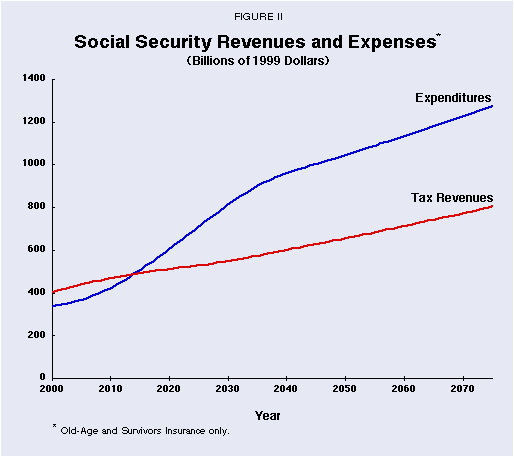
Using a computer simulation model developed by the Private Enterprise Research Center (PERC) at Texas A&M University and the National Center for Policy Analysis (NCPA),13 this study analyzes four reform proposals: (1) the Gramm-Domenici plan, (2) the Archer-Shaw plan, (3) the bipartisan plan and (4) the alternative developed by the NCPA and PERC.
All of the proposals analyzed here have in common: contributions to personal retirement accounts, annuities funded by the private accounts that partially or fully replace government-paid Social Security benefits and the promise that the current payroll tax rate will not be increased (although the bipartisan proposal increases the maximum income subject to taxation and, as a result, increases tax revenues). The plans differ on other provisions, such as how money is put into the private accounts and how the funds are invested. However, the simulations below use a common set of assumptions to make a comparison of the reform proposals more feasible.
Program Changes. Our analysis considers only the Old-Age and Survivors Insurance (OASI) part of the Social Security system, the program designed specifically to provide old age pensions. The OASI and Disability Insurance programs have separate trust funds and dedicated tax sources, so they are easily separated. The current payroll tax of 15.3 percent (employer and employee combined) funds OASI (10.7 percent), Disability Insurance (1.7 percent) and Medicare (2.9 percent). OASDI expenditures currently equal 12.4 percent of payroll.
"It is reasonable to assume a 5.3 percent real rate of return after administrative costs."
Rate of Return on Personal Retirement Accounts (PRAs). We assume that the private accounts will be invested in a portfolio made up of 60 percent stocks and 40 percent corporate bonds, with an annual real rate of return of 5.5 percent. This rate is quite reasonable given the historic rates of return on portfolios held over long periods. Before corporations pay federal corporate income taxes and state and local taxes, the real rate of return is 8.5 percent.14 Further we assume that of the 5.5 percent after-tax rate of return, 0.2 percent (20 basis points) goes to administrative costs for managing the private accounts, leaving a net annual rate of return of 5.3 percent. We assume that the annuities based on the private accounts will also pay a net annual real rate of return of 5.3 percent.
Balanced Budget Restriction. We assume that all program changes must be paid for. If taxes are not to be increased or benefits reduced (as is the case in three of the four plans analyzed), additional funds must come from one of two sources: (1) the federal budget surplus and (2) taxes collected as a result of the increased economic activity made possible by the private accounts. For the purpose of this analysis, the budget surplus is the unified budget surplus minus Medicare taxes and expenditures.15 Additional revenue will become available to the extent that the investment of the private accounts increases the nation's capital stock. This additional capital will produce taxable income that otherwise would not exist. We assume that the federal government can recapture 85 percent of these new revenues.16 Of the 8.5 percent rate of return earned by new capital, federal and state and local taxes take 3 percent.
Promises Made to the Baby Boomers. Most reform proposals are focused on securing retirement benefits for young people entering the labor market today. Yet well before today's young workers reach the retirement age we will face the crisis of funding retirement benefits for the baby boom generation. As part of our general balanced budget constraint, we require each plan not only to fund deposits made to PRAs but also to meet all future obligations to each retiree cohort.
Real Accounting. The Social Security Administration treats the nonnegotiable bonds in the OASI Trust Fund as real assets that can be used to pay benefits as they come due. Yet every asset of the Trust Fund is a liability of the Treasury. So the sum of the assets and liabilities equals zero. Similarly, any interest earned on Trust Fund bonds is simply a promise by one government agency to pay another government agency and is not a source of real funds. By contrast, our model relies on real accounting. Every expenditure must be paid for by a real funding source – not by IOUs the government writes to itself.17
"Under the current system, expenses exceed revenues beginning in 2014."
Retirement Age and Benefits. For three of the proposals, we assume that the retirement age, promised Social Security benefits and the tax on Social Security benefits continue to be determined by current law. The exception is the bipartisan proposal, which makes specific changes in these parameters.
Forecasts of Taxes and Expenditures. The economic forecasts of future income – on which taxes are paid and benefits are calculated – were developed by the Private Enterprise Research Center based on historical economic data. The life expectancy assumptions are the intermediate assumptions of the Census Bureau. Figure II shows the current projected OASI revenues and expenses between 1999 and 2075. (All values in the analysis are in constant 1999 dollars.) As noted above, the OASI payroll tax rate is 10.7 percent of earnings up to a taxable maximum of $72,600. In future years the tax rate is scheduled to drop to 10.6 percent, and the taxable maximum will rise at the same rate as average earnings. As Figure II shows, expenses begin to exceed revenues in 2014 and do so in all subsequent years.18
"The net effect of eliminating the earnings penalty will be small."
The Social Security Earnings Penalty. All the proposals except the Gramm-Domenici plan repeal the earnings penalty,19 under which retirees ages 62 through 69 are limited to a modest amount of earned income and penalized if they earn more. Specifically, in 1999 seniors ages 62 through 64 will lose one dollar in benefits for every two dollars earned above $9,600 and those ages 65 through 69 will lose one dollar in benefits for every three dollars earned above $15,500.20 Both Social Security Administration and private sector estimates agree that the net effect of eliminating the earnings test will be small, so we do not explicitly model it in the simulations.21 However, the earnings test does have an effect on seniors' work effort, and eliminating the penalty entirely for the age 65 to 69 group would increase the aggregate labor output of affected seniors by an estimated 5.3 percent.22
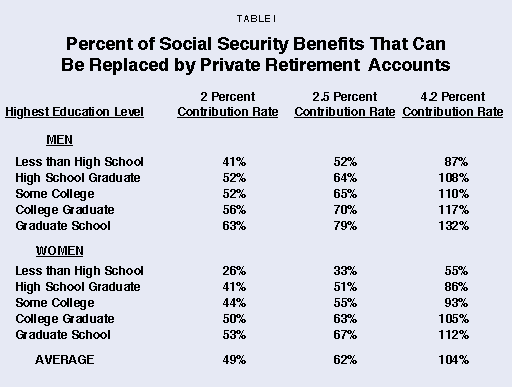
Required Contribution Rate. Is it possible to fully fund young workers' Social Security benefits with PRA deposits? As Table I shows:23
- With a 2.0 percent contribution rate, about half of an average individual's estimated benefits can be paid by a PRA-funded annuity.
- With a 2.5 percent contribution rate, about 62 percent can be paid from the annuity.
- Fully funding Social Security benefits requires a 4.2 percent contribution rate.
Most workers are not average, however. Owing to Social Security's progressive benefit structure, benefits equal a higher percent of preretirement income for low-income workers than for those with higher incomes. Our model identifies lifetime income with the level of education. The benefit paid to those with more years of schooling replaces a smaller percent of preretirement earnings. Those with less schooling have a higher replacement rate. As a result, a percentage point of wages deposited in a PRA replaces more of promised Social Security benefits, the higher the education level. For example,
- At a contribution rate of 2.5 percent, a male worker who enters the labor force after high school in 1999 can expect his PRA to purchase an annuity equal to $8,575 at the time of his retirement in 2048. This annuity will replace only 64 percent of his promised Social Security benefits.
- By contrast, a male worker with a graduate school degree can expect his PRA annuity to be $18,335 – about 79 percent of his promised Social Security benefit.
"Higher-earning individuals can replace more of their benefits with annuities than can those with lower lifetime earnings."
For women, the story is the same: higher-earning women, those with higher levels of education, can replace more of their expected Social Security benefits with their annuities than can those with lower lifetime earnings. Moreover, the magnitude of these differences remains at higher contribution levels as well. For example:
- With a 2.5 percent contribution rate, the amount of Social Security benefits PRAs can replace ranges from 52 to 79 percent for men.
- For women, the range is 33 to 67 percent.
As Table I shows, a contribution rate of 4.2 percent over the work life of an average worker is sufficient to replace Social Security completely. But here again, most people are not average:
- With a 4.2 percent contribution rate, PRAs can replace from 87 percent to 132 percent of expected Social Security benefits for men.
- The replacement rate ranges between 55 percent and 112 percent of the benefits for women.
"Social Security redistributes income."
Thus, even with a contribution rate that ultimately produces an average annuity equal to the average benefit, tax revenues will continue to be required to bring some workers' annuities up to the level of benefits they would have received under Social Security. The alternative is to construct a higher contribution rate at lower levels of earnings and a lower rate at higher levels of earnings. A consequence of such action is that once the program is fully phased in, lower-income individuals would be contributing a greater percentage of their earnings to their PRAs than would those with higher incomes.
Again, these problems arise because of Social Security's requirement that lower-income retirees have a higher replacement rate than higher-income retirees. In effect, Social Security redistributes income among members of each cohort. The question is when to do the redistribution – during the years in the labor force or during retirement? These alternatives are explored below.
[page]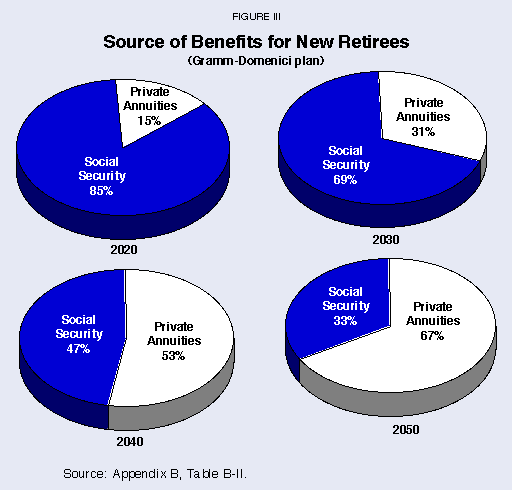
"The Gramm-Domenici proposal provides a 20 percent bonus over currently scheduled benefits."
24Sens. Gramm and Domenici's Investment-Based Social Security plan would gradually replace the pay-as-you-go Social Security system with a fully funded investment-based system, using personal retirement accounts (PRAs).25 By their estimate, the total transition would take about 50 years. Workers would invest an increasing portion of their payroll taxes (from three percentage points in 2000 to an eventual eight percentage points) in investment funds managed by professional money managers, certified for safety and soundness and regulated by a new Social Security Investment Board. There would be no increase in the payroll tax, and the government would guarantee that everyone would fare no worse under the investment-based system than under the current system.26
On retirement, retirees would receive the scheduled benefits from the current system plus an amount equal to 20 percent of the annuity they can purchase with their private account. If the account contains more than the amount needed for the annuity, the retiree could withdraw the remainder. If the accumulated balance is insufficient to pay for the guaranteed benefit, as would be true for those workers who are closer to retirement at the beginning of the transition, the entire balance would be turned into an annuity and Social Security would pay the difference between the annuity and the guaranteed benefit. Over time, with an increasing portion of wage earnings invested in the individual accounts, and a lengthening period of investment, new retirees would obtain a greater proportion of their after-retirement income from their private annuities.
"After 20 years of transition, private accounts will fund 15 percent of new retirees' benefits."
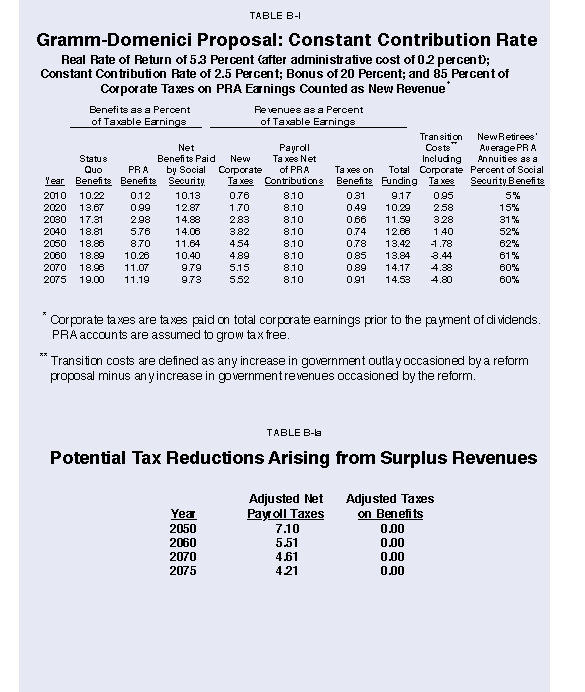
Contributions to PRAs under the Gramm-Domenici plan are funded in two ways: (1) by using all current and projected budget surpluses,27 and (2) by "recapturing" new government revenue generated by the PRAs.28 Using the budget surplus to finance the PRA deposits is equivalent to the government making contributions on behalf of individuals to their private accounts, and we estimate that the budget surplus could fund PRA contributions equal to 2.5 percent of taxable payroll. As the recaptured corporate taxes as a percent of taxable payroll begin to exceed 2.5 percent in 2028, they are able to fund a gradually rising contribution rate – reaching 4.85 percent by 2058. [See Appendix B, Table B-II.] The result:
- After 20 years of transition (in 2020), private accounts will fund 15 percent of new retirees' Social Security benefits (including the 20 percent bonus). [See Figure III.]
- The fraction of retirement income paid from private accounts rises to 31 percent in 2030, to 53 percent in 2040 and to 67 percent by 2050.
These percentages refer to the average retiree, however. For reasons given above, higher-income retirees will replace more of their benefits with PRA investments; lower-income retirees will replace less.
By 2058 the average individual entering the workforce will contribute at the rate necessary to prefund an annuity equal in value to promised Social Security benefits plus a 20 percent bonus (4.85 percent). Beyond that point, a dramatic reduction in government funding will be possible [see Figure IV and Appendix B, Table B-IIa] and, accordingly, the payroll tax can be substantially reduced. Specifically:
- The payroll tax is kept at 8.10 percent under this plan until the year 2050.
- Beyond that point, it is possible to eliminate the Social Security benefits tax and gradually reduce the payroll tax – relying on increased revenues from a larger economy to fund the remaining government obligations.
- By the year 2075, the payroll tax rate can be reduced to less than 1 percent.
- This compares to a 19 percent payroll tax that will be needed without reform.
"The Archer-Shaw plan promises to maintain currently scheduled benefits — but does not promise a bonus."
Under the Social Security Guarantee plan outlined by Reps. Archer and Shaw, workers will receive an annual refundable income tax credit equal to 2 percent of wages for deposits to private retirement accounts.29 Like the Gramm-Domenici plan, the Archer-Shaw plan promises to maintain currently scheduled benefits – though with no promise of a bonus. However, at retirement the accumulated balance in the private retirement account is turned over to the Social Security Administration and is annuitized at the market rate of return. Our simulation of the Archer-Shaw reform is shown in Appendix B, Table B-III.30
The Archer-Shaw plan uses roughly 80 percent of the on-budget surplus to fund the PRA contributions. Even so, additional revenues are needed to fund Social Security obligations during the years of the baby boomers' retirement. We assume these needed revenues are generated by higher economic growth induced by a larger capital stock.31
As in the case of the Gramm-Domenici plan, under the Archer-Shaw plan PRA-funded annuities gradually replace Social Security benefits over time:
- After 20 years, the annuity from the private account would replace 12 percent of scheduled Social Security benefits for the average new retiree. [See Figure V.]
- The percent of retirement benefits funded from PRA accounts would rise to 25 percent by 2030 and to 50 percent by 2050.
"Archer-Shaw leads to a substantial tax reduction over time."
The Social Security Administration has evaluated the Archer-Shaw Plan and has suggested that under the plan it is possible to reduce the payroll tax by 2.5 percentage points in 2050 and by another 1 percentage point in 2060. To investigate this finding, we ran a separate simulation that ignores the increased revenues from a larger capital stock and uses the same rate of return assumption used by the Social Security Administration. We found that a 0.91 percentage point reduction in payroll is possible in 2060 rather than 3.5 percentage points.32 Nonetheless, relative to the status quo, Archer-Shaw leads to a substantial reduction in taxes needed to fund benefits over time. [See Figure VI.]
[page]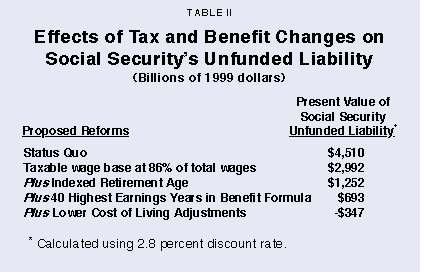
"The bipartisan proposal does lower scheduled benefits and raise taxes."
33Unlike the other proposals analyzed here, the bipartisan proposal includes measures that lower scheduled benefits and raise taxes. Workers would be allowed to divert 2 percent of their earnings into private accounts, and at retirement a portion of the accounts would be used to offset Social Security benefits. Other provisions would allow lower-income workers to receive federal matching funds to bolster their contributions.
Reducing Benefits. The three reforms that have the largest effects on promised benefits are: (1) indexing the retirement age, (2) a change in the method of calculating preretirement earnings and (3) a change in the method of indexing benefits for inflation.
Since Social Security's inception in 1935, life expectancy at birth and at all ages has risen significantly. Life expectancy for a person who has survived to age 65 has risen almost four years for men and six years for women over the last 60 years. Since the trend is expected to continue, the retirement period relative to the years in the labor force will rise. Under the bipartisan proposal, the normal retirement age (the age at which a beneficiary can receive full benefits) will increase to 67 by 2011, the year in which the oldest baby boomers reach 65 years of age. Under current law, the normal retirement age is not scheduled to rise to 67 until 2037. By speeding up the increase, the proposal effectively lowers the total benefits that will be paid out relative to those that are scheduled. But the proposal does not stop there. The life expectancy index will be used to continuously scale up the retirement age if longevity increases.
How that index would be calculated is not clear in the proposal. In our simulation, we adopt an indexation method that holds steady the ratio of retirement years to working years as life expectancy increases, based on life expectancy data from the Census Bureau. [For a discussion of indexation methods, see Appendix C.]
"The four proposed reforms in the bipartisan proposal will eliminate the unfunded Social Security liability."
Currently an individual's Average Indexed Monthly Earnings (AIME), which determines the size of a worker's initial monthly benefit, is based on the highest 35 earnings years. The bipartisan proposal would average over the highest 40 earnings years instead. This will have the effect of lowering the calculation of preretirement income and thus lowering benefit payments.34
The third change is "an adjustment of 0.5 percent in the Cost-of-Living Adjustment (COLA) to maintain more accurate cost-of-living indexes." We interpret this to mean that rather than the Social Security Trustees' ultimate assumption of a 3.5 percent annual increase in prices, the COLA would rise by 3 percent annually. Individuals who are 62 and older in 1999 would be unaffected by this change.
Raising Taxes. The bipartisan proposal maintains the taxable wage base at 86 percent of total wages. The effects of this change are subtle and their magnitudes are contingent on future changes in the distribution of wages. Under current law the maximum taxable wage, currently $72,600, is scheduled to rise at the same rate as average wages. If the earnings distribution does not change over time, the earnings under the taxable maximum would represent a constant proportion of total earnings. However, if the distribution is widening, as it has been over the last several decades, then increasing the taxable maximum at the same rate as the growth in average wages will result in a declining ratio of taxable earnings to total earnings. The bipartisan proposal increases the maximum taxable wage at a faster rate and this produces greater future tax revenues at the existing tax rate. Individuals with high earnings throughout their work years would, at retirement, have higher AIMEs, but because of the redistributive nature of the benefit formula, their benefits would grow less than the increase in taxes they would pay into the system. The result is that the system's revenues would rise by more than its expenditures in the long run.
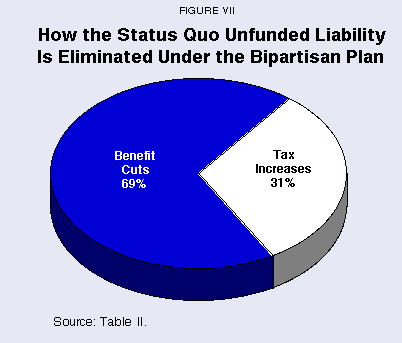
The Impact of Tax and Benefit Changes. These tax and benefit changes get quite close to achieving actuarial balance, even without contributions to PRAs. As Table II shows, the four proposed reforms will eliminate the nation's unfunded $4.5 trillion Social Security liability in the following way:
- Maintaining the taxable wage base at 86 percent of total wages – broadening the tax base but not increasing the tax rate – will reduce the unfunded liability by one-third, to just under $3 trillion;35
- Indexing the retirement age in addition will reduce the liability by another third, to $1.25 trillion;
- Using the 40 highest earnings years instead of the 35 highest will further reduce the liability to $693 billion;
- Reducing the COLA on top of the above changes will create a $347 billion surplus.
The cumulative effect of the bipartisan proposal's reforms is to raise the present value of the system's revenues by 8.9 percent and lower the present value of aggregate benefits by 19.8 percent relative to the current system. As Figure VII shows, about one-third of the change is produced by tax increases and two-thirds by benefit cuts.36
"The bipartisan proposal has several provisions that encourage savings."
Individual Retirement Accounts. The bipartisan proposal has several provisions that encourage savings. Workers can divert 2 percent of their taxable earnings into individual accounts. The individual accounts would be privately managed. The way in which the accumulated savings offset an individual's expected Social Security benefits differs from both the Gramm proposal and the Archer-Shaw proposal. Here Social Security benefits are offset in an amount equal to the annuitized value of the contributions had they grown over the retiree's work life at the rate of return on government Treasury bills. Social Security is responsible for the remainder of the benefits. If the actual PRA return is higher than the Treasury bill rate, the individual gets to pocket the difference. Alternatively, if the actual return is less than the Treasury bill rate, the individual receives less than currently scheduled Social Security benefits. For example:
- If a worker 45 years old today earns $30,000 per year between now and retirement at age 67, the accumulated value of his or her 2 percent annual contributions would be $17,912 if the Treasury bill rate is 2.8 percent; this amount would be annuitized and the annuity would offset the expected annual Social Security payments dollar for dollar.
- However, the accumulated value of the contributions would be worth $23,941 if the savings were invested in a balanced portfolio and earned the market rate of 5.3 percent.
- The worker would then have $6,029 saved for retirement in addition to the Social Security benefits.
"The annuity from the private account would pay 70 percent of the average retiree's benefits by 2050."
Other Savings Incentives. The bipartisan proposal also includes incentives that encourage lower-income workers to save more. Workers whose 2 percent contribution is less than 1 percent of the taxable maximum in any year would receive $100 from the federal government when they make additional contributions to their individual account. The government further matches the lower income worker's contributions up to an amount equal to 1 percent of the taxable maximum. In our analysis, we do not attempt to estimate the degree to which lower-income individuals would pursue this option, and for the simulation results we limit the contribution to 2 percent for all workers.
"The payroll tax rate could be reduced to 8.2 percent by 2075."
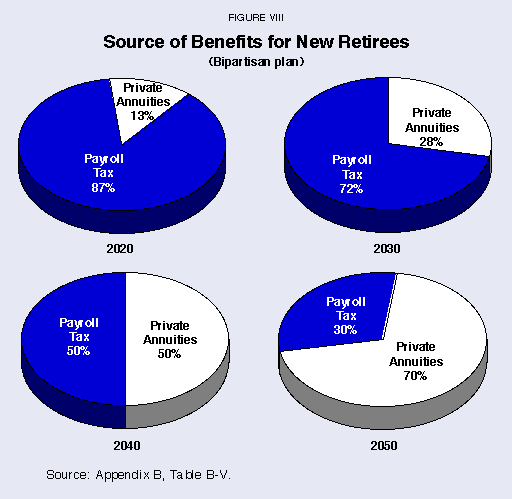
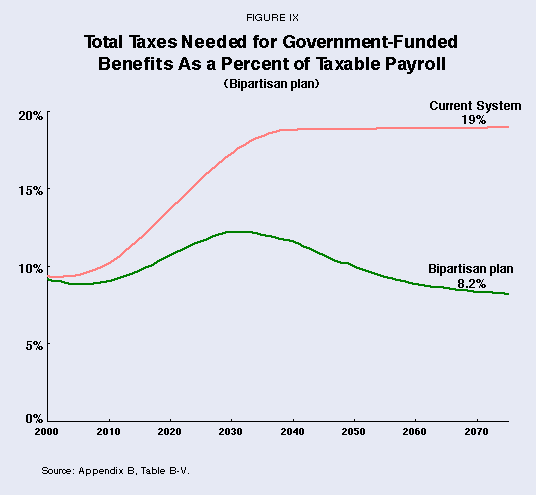
Simulation Results. Under the Bipartisan proposal the tax revenues and expenditures change dramatically compared to current law. [See Appendix B, Table IV.] Bearing in mind that benefits are reduced under the Bipartisan plan, the effects of PRA investments are substantial [see Appendix B, Table V]:
- The annuity from the private account would replace 13 percent of Social Security benefits for the average new retiree in 2020, rising to 70 percent of benefits by 2050. [See Figure VIII.]
- The payroll tax rate could be reduced to 8.2 percent by 2075, compared to the 19 percent the current system requires.37 [See Figure IX.]
The National Center for Policy Analysis (NCPA) and the Private Enterprise Research Center (PERC) have developed a proposal that resembles several of the plans currently before Congress. Like the Gramm-Domenici and Archer-Shaw proposals, this plan works within the constraints of the projected budget surplus and seeks to replace projected Social Security benefits without lowering those benefits or raising taxes. However, rather than having all workers contribute a constant percentage of their earnings into private accounts, we suggest that younger workers contribute at a higher rate than older workers.
There are two reasons for proposing the different contribution rates. First, the first generation that spends its entire work life under the plan will for the most part replace its Social Security with private savings during retirement. Of the three other proposals studied here, only the Gramm-Domenici plan provides for workers eventually to fully fund their retirement, and even under that plan full funding takes place in the distant future. Second, the nation's capital stock will grow more rapidly in the early years of the transition if withdrawals from the private accounts are postponed until the current young retire. As a consequence, national income and taxes will grow more rapidly.
Accordingly, our final simulation assumes that beginning in 1999, 4.5 percent of the taxable earnings of individuals born in 1981 (today's 18-year-olds) and later goes into PRAs. The 4.5 percent contribution rate is chosen because on average it will replace Social Security benefits and provide a 10 percent bonus.38 We also continue to impose a constraint equal to 2.5 percent of aggregate taxable earnings during the transition – the maximum that can go into PRAs from the budget surplus. The budget surplus thus in effect is a transition tax.
"The higher contribution rate to PRAs of younger workers creates a capital stock that grows more rapidly."
To determine the contribution rate for workers born in 1980 and earlier, we subtract the aggregate of the 4.5 percent contributed by those born in 1981 and later from an amount equal to 2.5 percent of aggregate earnings for all workers. Between 1999 and 2026, this difference – an ever-declining amount as an increasing portion of the labor force is made up of workers born in 1981 and later – can be used to partially fund the accounts of those born in 1980 and earlier. The difference is divided in such a way that the private accounts replace a gradually increasing proportion of each cohort's Social Security benefits, so there is no "notch generation" in the future.
The higher contribution rate to PRAs of younger workers creates a capital stock that grows more rapidly and produces larger earnings from that capital stock. The incremental earnings exceed the budget constraint in 2026 – the same year the aggregate contributions of the younger-worker cohorts exceed the constraint. Beyond 2026, the gradual increase in aggregate PRA contributions to 4.5 percent of taxable earnings is funded by recaptured corporate taxes.
"By 2050, average new retirees draw their entire benefits from the private accounts."of taxable payroll."
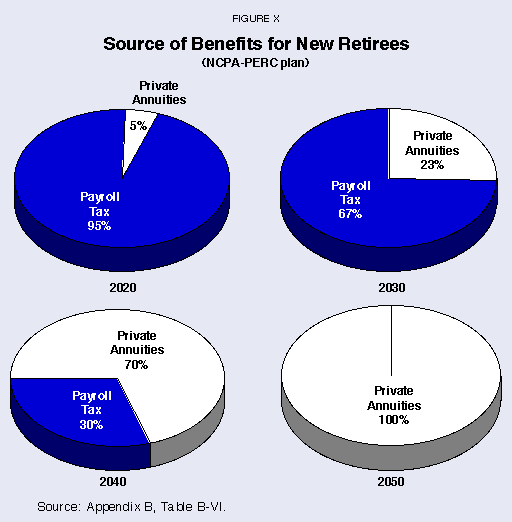
The results of a simulation structured in this way are presented in Appendix B, Table B-V. As Figure X shows, the percentage of new workers' benefits paid from private accounts lags behind those of the other plans examined in the early years because the relatively older workers are contributing at a lower rate. For example:
- Individual PRAs provide only 23 percent of the benefits of new retirees in 2030 but rise to provide 70 percent of benefits by 2040.
- By 2050, average new retirees draw their entire benefits from the private accounts.
"By 2050, average new retirees draw their entire benefits from the private accounts."of taxable payroll."
Changing the contribution rate from one that is constant over time and across individuals to one that is higher for young workers and is allowed to rise over time, as this plan is doing, results in a more rapid increase in capital stock because the young, who are contributing at the higher rate, do not draw benefits until 2048. As a result of the more rapid growth of national income and thus of tax revenues:
- By 2050 the tax on Social Security benefits can be eliminated and the net payroll tax reduced to 1.97 percent.
- By 2060, all payroll taxes can be eliminated and corporate taxes reduced.
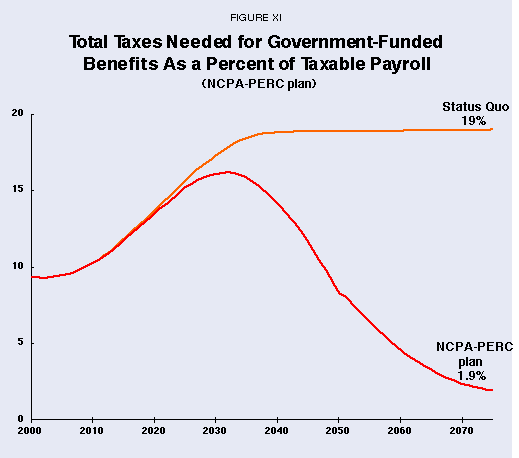
- By 2075, the end of the simulation horizon, the only tax required is a corporate tax equal to 1.93 percent of taxable payroll, the amount required to maintain the redistributive nature of the Social Security benefit formula.39 [See Figure XI.]
We have completed an extensive analysis of four major reform proposals. The analysis has been sufficiently broad to allow us to make some generalizations about an entire class of proposals to reform Social Security by moving from pay-as-you-go finance to a partially or fully funded system.
"The solution requires most of the projected budget surplus — investing those funds in income-earning assets."
Benefits Can Be Secured without New Taxes. In principle, it is possible to secure the benefits promised by the current system without any increase in tax rates or in government borrowing. However, accomplishing this goal requires moving to a funded system (either in part or in whole) under which each generation saves for its own retirement benefits. This solution, in turn, requires that we dedicate most of the projected budget surpluses – investing those funds in income-earning assets.
"The tax burden needed to guarantee benefits is less than the current payroll tax."
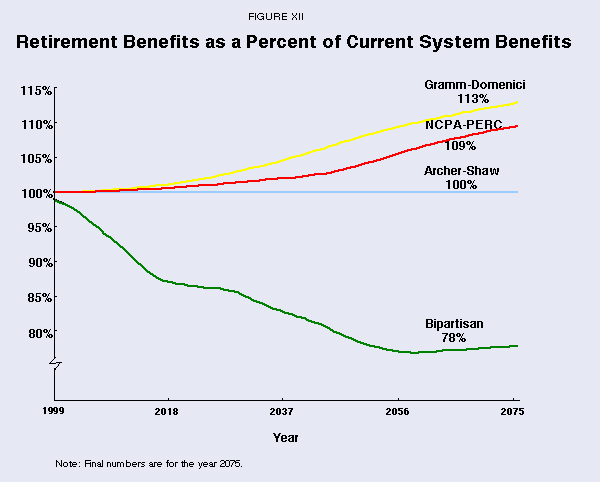
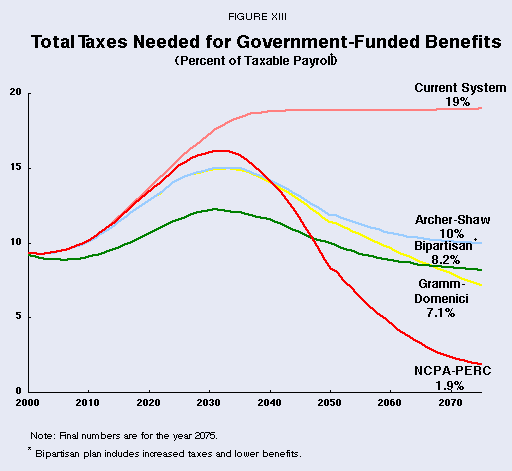
Under three plans considered here (Gramm-Domenici, Archer-Shaw and the NCPA-PERC plan), retirees receive at least as much as or more than Social Security benefits promised by law by the year 2075. [See Figure XII.] Yet in all three cases, the tax burden needed to guarantee those benefits to all workers is less than the current payroll tax, and in the case of Gramm-Domenici and NCPA-PERC, it is significantly less. [See Figure XIII.]
Figure XIII also reveals two other important features designed to secure future benefits. First, note that:
- Whereas the bipartisan plan ultimately reduces benefits by 22 percent, the Gramm-Domenici plan increases them by 20 percent.
- Yet the burden for taxpayers is very similar under the two plans.
This comparison shows that investing in income-earning assets and taking advantage of compounding is far more powerful than reducing benefits.
Note also that the longer funds stay in the PRA accounts, the more they gain through compounding. The NCPA-PERC plan is able to accomplish much more than the other plans over the same time period because it skews contributions toward younger workers who must leave their funds invested for more years before they qualify for retirement. For example:
- Both the Gramm-Domenici plan and the NCPA-PERC plan commit about the same number of dollars to PRA accounts for the first 40 years.
- Yet in the year 2075, the burden for taxpayers under the NCPA-PERC plan is little more than one-third of the burden under the Gramm-Domenici plan.40
"Skewing account deposits toward young workers has a huge effect after only one generation moves through the workforce."
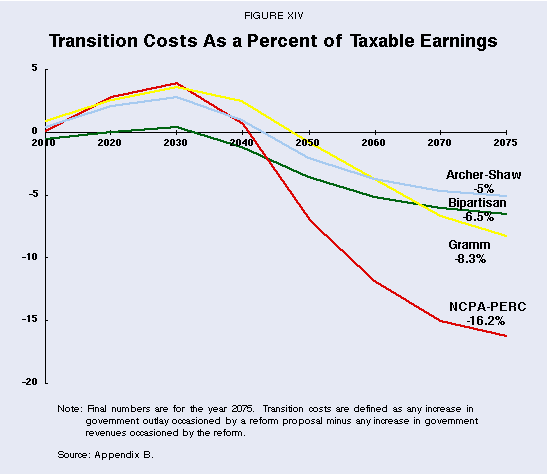
There Are No Long-Term Transition Costs. We define transition costs as any increase in government outlays occasioned by a reform proposal minus any increase in government revenues occasioned by the reform. As Figure XIV shows, under all four reform plans, these costs are positive and large in the early years. In the later years, as PRA accumulations stimulate a larger economy, the transition costs become negative and more than offset the initial positive costs.
We conclude that moving from a pay-as-you-go system to a funded system imposes no long-term costs. Put a different way, the government – and the people – profit from the transition. Figure XIV reaffirms the conclusions of the previous section, although from a different perspective.
- The Gramm-Domenici plan is less costly (society "profits" more) than the bipartisan plan even though Gramm-Domenici ultimately promises a 20 percent increase in benefits, while the bipartisan plan promises a 20 percent cut.
- At the same time, the Gramm-Domenici plan is twice as costly (society "profits" 50 percent less) as the NCPA-PERC plan.
- These results are another reflection of the fact that compounding is a far more powerful tool than cutting benefits and that skewing PRA deposits toward young workers has a huge effect after just one generation moves through the workforce.
Benefits Can Be Fully Funded. Social Security has a large unfunded liability because, from the beginning, it has operated on a pay-as-you-go basis. Therefore, any reform plan that retains pay-as-you-go financing – even if only on a partial basis – risks carrying the current problems into the future. For that reason, it is interesting to ask how easy or difficult it is to move to a fully funded system.
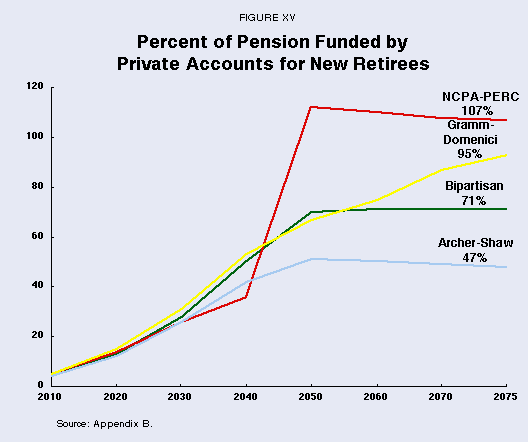
Figure XV shows the results of the four plans as they are currently structured:
- The NCPA-PERC plan moves to full funding for each group of new retirees by mid-century, and the Gramm-Domenici plan achieves full funding by the end of the century.
- The bipartisan plan achieves slightly more than two-thirds funding by mid-century, but retains that feature indefinitely.
- The Archer-Shaw plan achieves funding for about half of promised benefits for new retirees by mid-century and also retains that structure indefinitely.
- Both the bipartisan and the Archer-Shaw plans could easily achieve full funding in the next century by using extra revenues generated by a larger capital stock to fund larger deposits to PRA accounts.
"Current economic and budgetary conditions present a unique opportunity for reform."
There is no easy fix for the Social Security system. A conservative estimate of its unfunded liability, the present value of the difference between projected revenues and expenses, is more than $4.5 trillion. We estimate that maintaining the scheduled benefits under the current system will require a future payroll tax rate in excess of 19 percent for the retirement portion of Social Security alone. The trustees estimate that with no change in the current system, we will either have to increase taxes by more than one-half, cut benefits by one-third or adopt some combination of revenue enhancement and benefit reduction in the next century. Reforms like increasing the retirement age effectively lower benefits, while increasing the maximum taxable wages effectively raises taxes. However, current economic and budgetary conditions present a unique opportunity to guarantee that scheduled retirement benefits are paid with no new taxes and no increase in government debt. By using the projected budget surplus to help fund a transition to a system in which individuals make deposits to their own private retirement accounts, several of the competing proposals in the 106th Congress take advantage of this unique opportunity. They promise to eliminate the unfunded liability without cutting benefits or raising tax rates. Under these plans, future benefits are paid for with a combination of privately funded annuities and tax revenues.
"The alternatives to using the budget surplus are a transitional tax or added payroll taxes."
While the budget surplus could be returned to taxpayers through a tax cut, the unfunded liability of the Social Security system is a real obligation. Using the surplus to establish the private accounts now and funding them sufficiently produces a fully funded private system in the long run. The alternatives to using the budget surplus to achieve a fully funded system are a transitional tax or mandatory contributions in addition to current payroll taxes.
The NCPA-PERC proposal we offer is similar in spirit to those currently before the Congress. However, it shortens the length of transition to a fully funded system by allowing younger workers to contribute more than older workers to private accounts. Doing so guarantees that today's young will for the most part replace their Social Security with private savings and greatly expands the nation's capital stock. As a consequence, national income and taxes grow most rapidly under the NCPA-PERC plan.
Politicians in both major political parties have recognized the importance of reforming Social Security now rather than later. We must embrace this recognition by adopting reforms that provide a real solution to the problem. Moving to a system of personal retirement accounts is such a solution and produces many collateral benefits, including giving workers ownership of their retirement pensions, raising the national savings level and ultimately increasing national income.
NOTE: Nothing written here should be construed as necessarily reflecting the views of the National Center for Policy Analysis or as an attempt to aid or hinder the passage of any bill before Congress.
[page]- Report of the 1994-1996 Advisory Council on Social Security, Advisory Council on Social Security, Washington, D.C., 1997.
- 1999 Annual Report of the Board of Trustees of the Federal Old-Age and Survivors Insurance and Disability Insurance Trust Funds, Washington, D.C., March 1999.
- Laurence Kotlikoff, "Privatizing Social Security," NCPA Policy Report No. 217, July 1998.
- Kevin M. Murphy and Finis Welch, "Real Wage Growth and OASDI Trust Fund Solvency," working paper, 1996.
- How good a deal one can get from one's Social Security contributions can be measured either by the (internal) rate of return or by the money's worth ratio, defined as the ratio of discounted benefits to discounted taxes paid by both employees and employers, with the discount rate being the real rate of return. If the internal rate of return is larger than the real rate of return, or equivalently, the money's worth ratio is larger than one, then Social Security participation is a better deal than private savings. Otherwise, it is a worse deal.
- However, this does not mean that national saving will rise by simply replacing the unfunded system with mandatory individual savings accounts. The debt management policy can be such that the additional private saving in the form of the mandatory savings accounts is fully absorbed by an increase in the government debt with no increase in capital stock. This can occur if the newly added explicit debt after privatization has exactly the same schedule as the old unfunded liabilities. National saving would increase only if fiscal policy were changed to make the debt shrink over time relative to the old liability.
- For a thorough analysis of the deadweight loss due to reduced saving and work efforts, as well as other negative incentive effects caused by the current pay-as-you-go system, see Martin Feldstein, "The Missing Piece in Policy Analysis: Social Security Reform," American Economic Review, May 1996, Vol. 86, pp. 1-4.
- Martin Feldstein and Andrew Samwick, "The Economics of Prefunding Social Security and Medicare Benefits," National Bureau of Economic Research, NBER Working Paper No. 6055, June 1997. The authors estimate that the reduced deadweight loss associated with the lower cost of financing is 3.75 percent of wages at the end of their simulation period. This amount exceeds the 2.23 percent of wages needed to finance retirement benefits.
- For example, in Kotlikoff, the switching of tax bases is achieved by eliminating the payroll tax and financing the transition with a consumption tax. See Laurence J. Kotlikoff, "Privatizing Social Security at Home and Abroad," American Economic Review, Vol. 86, No. 2, pp. 368-72; and Kotlikoff, "Privatization of Social Security: How It Works and Why It Matters," in James Poterba, ed., Tax Policy and the Economy, Vol. 10, Cambridge, Mass.: MIT Press, 1996).
- Many economists argue that the efficiency gains from changing tax bases can be realized without privatization, by simply changing the financing tax (say from the payroll tax to a consumption tax) within the pay-as-you-go system.
- Phil Gramm, "Investment-Based Social Security," NCPA Policy Report No. 220, December 1998.
- Sens. Gramm and Domenici have proposed a 3 percent carve-out. However, under the balanced budget restriction imposed in this paper and under assumptions made about capital market returns, only a 2.5 percent carve-out can be allowed initially. See the analysis below.
- While recognizing that even a slight change to Social Security can have a dramatic effect throughout the rest of the economy, we analyze the proposals using an actuarial model similar to that of the Social Security Administration. In this approach, some economic effects, such as labor supply responses, are ignored. We have two reasons for taking this approach. First, such models are well accepted among policy makers and are ultimately used to evaluate any reform proposal. Second, the proposals themselves were developed within the context of such a model. A description of the model and further explanation of some of the assumptions used can be found in Appendix A.
- James M. Poterba estimates that the pretax rate on nonfinancial corporate sector capital averaged 8.5 percent between 1959 and 1996. See James M. Poterba, "The Rate of Return to Corporate Capital and Factor Shares: New Estimates Using Revised National Income and Product Accounts and Capital Stock Data," NBER Working Paper 6263, National Bureau of Economic Research, Cambridge, Mass., April 1999.
- We ignore the Medicare program on the theory that it is a separate program with similar problems that also require a long-term solution.
- Specifically, we assume that the federal government can capture the additional revenues collected by state and local governments by reducing match grants and other payments to the states by a like amount.
- The simulation results for each proposal are presented in Appendix B. All of the proposals are treated in the same way. The Gramm-Domenici plan identifies the degree to which recaptured corporate taxes impact the system's future financial status. The Archer-Shaw and bipartisan plans do not, but for consistency across evaluations, recaptured corporate taxes are included in each table. It is appropriate to count these revenues, as long as the contributions to PRAs reflect additions to the capital stock; that is, if they are either implicitly funded by a budget surplus, mandatory contributions, or a transitional tax. While the proposals differ in how they would fund contributions to the PRAs, we subtract the contributions from the payroll tax. Doing so recognizes the contributions within the summary tables.
- The revenues and expenditures depicted in the graph are based on our simulation model. See Appendix A for a description.
- Although the Gramm-Domenici plan does not include a provision for repeal of the earnings penalty, Sen. Gramm has introduced other legislation that does provide for repeal.
- Under a 1996 change in the law, the earnings limit for 65-to-69-year-olds will increase by a set amount each year until it reaches $30,000 in 2002. The limit for 62-to-64-year-olds is automatically adjusted each year for increases in the national average wage index.
- Stephen C. Goss, "Long-Range OASDI Financial Effects of the Social Security Guarantee Plan," memorandum to Harry C. Ballantyne, Chief Actuary, Social Security Administration, April 29, 1999.
- See Leora Friedberg, "The Labor Supply Effects of the Social Security Earnings Test," NBER Working Paper No. W7200, National Bureau of Economic Research, Cambridge, Mass., June 1999.
- The earnings in each year between now and retirement for each education category are based on our forecasts of participation in the work force, annual hours of work and hourly wages. The Social Security benefits are calculated using the projected rules in place in 2048. The replacement rates are calculated assuming a constant 5.3 percent real rate of return.
- The simulation results in the Gramm-Domenici proposal are based on an adaptation of a model developed by Feldstein and Samwick in "The Economics of Prefunding Social Security and Medicare Benefits." The Feldstein-Samwick work has been widely cited and is one of the leading Social Security privatization plans. As a result of our independent estimates of earnings and benefits, our model will produce results that differ in magnitude from those produced by Gramm-Domenici's adaptation of the Feldstein and Samwick model. However, our estimates in large part confirm those suggested by Gramm-Domenici.
- The term PRA, for personal retirement account, is used here; Gramm termed the accounts Social Security Individual Investment Accounts or SI accounts.
- The Gramm-Domenici plan is detailed in Phil Gramm, "Investment-Based Social Security: Saving Social Security for Our Parents, for Our Children, Forever," National Center for Policy Analysis, NCPA Policy Report No. 220, December 1998.
- Our discussion of the transition cost differs from Gramm and Domenici's in the way a budget surplus is counted. We define the transition cost as the difference between net revenues and expenses and thus the surplus must be identified net of the Social Security system, whereas with Gramm and Domenici's treatment the full budget surplus is counted against the transition cost because they present aggregate costs. The difference is a matter of presentation only.
- The Gramm-Domenici proposal calculates corporate tax recapture thus: First, annual aggregate PRA balances net of annuity payments are determined. Gramm and Domenici assume that 80 percent of the aggregate PRA balances are net additions to the capital stock, given that the PRAs may displace private saving. They further assume that 15 percent of the investments will not be subject to corporate taxes because they are held in foreign securities of sub-chapter S corporations. Based on these assumptions, they adjust the corporate tax rate downward from 35 percent to 23.8 percent (.35 x .8 x .85). The recaptured corporate taxes are then the aggregate PRA balances times the 8.5 percent rate of return times the adjusted corporate tax rate.
- Although the Archer-Shaw proposal would reduce federal tax collections by an amount equal to 2 percent of taxable payroll, we identify the effect in the simulation as a reduction in the payroll tax. Doing so results in payroll taxes net of PRA contributions equal to 8.6 percent in all years. Identifying the effect in this way allows us to more conveniently compare this proposal with the other proposals.
- The Social Security Administration used a 5.35 percent rate of return in its evaluation of the Archer-Shaw proposal. There are three primary differences between the Social Security Administration's approach and ours. First, we limit the analysis to the OASI program; they include the DI program. Second, we count the recaptured corporate taxes as revenue; they do not. Third, they count interest on the Trust Fund balance as a revenue source, but we do not, for reasons explained in the text. Thus our findings differ from those of the Social Security Administration, although both show that the Archer-Shaw plan is workable.
- In our simulation, corporate income taxes arising from the additional national savings are used to help finance the transition. The Archer-Shaw proposal does not mention recaptured corporate taxes nor does the evaluation of the Archer-Shaw proposal that was performed by the Social Security Administration. As the transition progresses there is less need for this alternate funding source. Recaptured corporate taxes are identified here for consistency with the evaluations of the other proposals. The taxes can be used to reduce the payroll tax or returned to the Treasury as general revenues. The consequences of both treatments are presented in Appendix B, Table B-IIIa and Table B-IIIb.
- The difference between our results and those of the SSA are a consequence of using our own revenue forecasts and benefits forecasts and our focus on the retirement and survivors portion of the program. [See Appendix B, Table B-IV for a comparison of our results and the Social Security Administration's evaluation.] Our forecasts of OASI revenues and expenditures produce estimates that are more conservative than the SSA actuaries' intermediate assumptions. For example, in 2010 we estimate that revenues will exceed expenditures by an amount equal to 0.69 percent of taxable income, while the actuaries' intermediate and high cost assumptions are equal to 1.10 and 0.28 percent, respectively. In 2075, we estimate that expenditures will exceed revenues by an amount equal to 7.49 percent of taxable income. The SSA actuaries' intermediate estimate in that year is 5.79 percent and the high cost estimate is 13.57 percent.
- The Bipartisan Social Security Reform Plan is sponsored by members of both houses including Sens. Judd Gregg of New Hampshire, John Breaux of Louisiana, Bob Kerrey of Nebraska, Charles Grassley of Iowa, Charles Robb of Virginia, Fred Thompson of Tennessee and Craig Thomas of Wyoming. Congressmen Jim Kolbe of Arizona and Charles Stenholm of Texas have introduced a similar proposal in the House.
- Another provision allows the lower-earning partner in a two-earner couple to drop the five lowest earnings years from his or her benefit calculation. Thus for each couple the benefit calculation for the higher earner will be based on the highest 40 earnings years, and the benefit calculation for the lower earner will continue to be based on the 35 highest earnings years.
- Recall that our simulation model uses historical data from the 1964 to 1998 March Supplements to the Current Population Survey as the basis for predicted future wages. To allow for a changing distribution of wages, we predicted earnings within age by sex by education categories. Thus the historical spreading in the distribution of earnings persists in our predictions of future earnings. We estimate that the present value of the system's revenues when the ratio of taxable to total wages is set at .86 is 9 percent higher than the present value of the system's revenues under current law.
- The Social Security Administration has evaluated the effects of reform measures that are quite similar to those suggested in the Bipartisan Proposal. The separate effects of each reform are presented in "Distributional Effect of Social Security Options by Gender and Income," memorandum from Keith Fontenot, Assistant Deputy Commissioner for Policy, to Jane Ross, Deputy Commissioner for Policy, May 18, 1999. In that study, the effect of each reform is treated separately. Since we look at the cumulative effects of the bipartisan reforms, the closest comparison between our results and theirs is the first reform we consider: the effect of maintaining the tax base at 86 percent of total wages. They find that maintaining a tax base of 90 percent of total wages reduces the long-term deficit by 29 percent. We find that maintaining a tax base of 86 percent of total wages reduces the unfunded liability by 34 percent. There are two primary reasons for the difference between the results. First, the unfunded liability we calculated is the present value of the difference between future expenditures and tax revenues. Their revenue stream includes Trust Fund interest revenues as well. Second, our result maybe higher than the SSA's because of the degree to which the wage distribution is expected to widen in the future. For more detail on how we forecast future wages, see Rettenmaier and Saving, The Economics of Medicare Reform, forthcoming.
- Recall that the tax rate is based on a higher level of taxable earnings under the Bipartisan Proposal than under the other plans.
- A 10 percent bonus is used because a 20 percent bonus requires a higher contribution rate, and the aggregate contributions of the young would grow faster than is justified under the 2.5 percent budget constraint.
- As mentioned earlier, the redistribution could occur at retirement, as is shown here, or the contributions of low-income workers could be enhanced in such a way that their savings produce an annuity that replaces Social Security benefits. The point is that some tax revenues will be required regardless of how the redistribution is realized.
- Part of the reason for the difference is the lower bonus under the NCPA-PERC plan.
APPENDIX A
The Simulation Model
The simulation model developed at the Private Enterprise Research Center at Texas A&M University under a research grant by the National Center for Policy Analysis is a substantial adaptation of the one previously developed to analyze prefunding the Medicare program (Rettenmaier and Saving, 1999). The building blocks for this type of simulation model are population and earnings forecasts. Applying expected future tax rates to the aggregate earnings forecast, which combines the demographic and earnings forecasts, identifies the system's revenue stream. When considering privatization of the system, the contribution rate as a percent of our forecasted earnings also identifies the funds flowing into individual accounts. The age-by-sex population distribution in future years is the Census Bureau's intermediate projections for 1995 to 2050. The data are extended to 2075 by continuing the trends that exist in the later years of the forecast. To estimate future earnings we calculate growth rates within detailed age by education categories for both men and women. The historical data used to calculate the various growth rates are the 1964 to 1998 March Demographic Supplements to the Current Population Survey (CPS). Because the survey questions refer to the previous year, the data run from 1963 to 1997. The growth rates within age by education by sex categories are applied to the most recent data to produce the earnings forecast.
Once earnings are forecast, the system's future benefit payments can be estimated. A worker's Social Security benefit is calculated based on a formula that translates past earnings into a monthly payment. In light of the benefit formula, tracking and forecasting taxable earnings within detailed categories is important for several reasons. First, unlike the Medicare tax which is applied to all labor earnings, the Social Security tax is limited to earnings up to a maximum. The taxable maximum is scheduled to grow at the same rate as average earnings. However, over the last 25 years the distribution of earnings has widened, resulting in an increasing proportion of workers whose earnings will exceed the taxable maximum. Also, the benefit formula is redistributive in nature in that the replacement rate for workers with low lifetime earnings is higher than the replacement rate for workers who had high lifetime earnings. Because Sens. Gramm and Domenici's proposal guarantees that retirees will receive at least their expected Social Security payment, plus a bonus based on the size of the private account, the distribution of workers across lifetime income classes matters when estimating the proportion of benefit payments that remain the government's responsibility in future years.
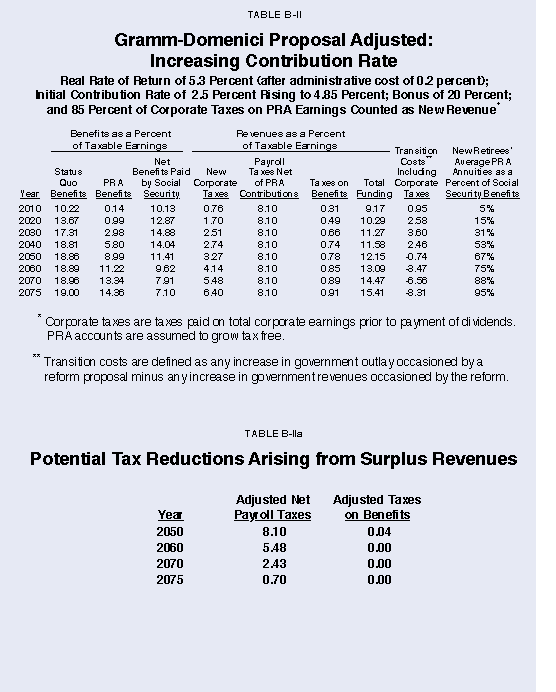
Building the simulation model proceeds through the following steps. Earnings are forecast for each age by sex and by education category. Thus for the years from 1999 to 2075, we have an estimate of real taxable annual earnings in each category. Next, for each of the categories of workers born in a given year, we calculate the expected Social Security benefit. Given that the earnings histories go back to 1963, and that Social Security benefits are based on workers' highest 35 years of earnings, it is possible to estimate benefits at retirement for all retirees born in 1933 and later. Assuming all individuals retire at the normal retirement age, currently 65 with scheduled increases to 67 over the next 28 years, we calculate the expected Social Security benefit for all categories of individuals born between 1933 and 2008 – those retiring in 1998 to 2075. The benefits are calculated using projected values of the parameters in the benefit formula. The projected values for average earnings, maximum earnings, the inflation rate and the bend points in the formula used to convert average monthly earnings into workers' expected benefits are all based on the intermediate assumptions in the 1998 Trustees Report. For these new beneficiaries we adjust spousal benefits to account for both the survivor benefit and the dependency benefit. We further adjust aggregate benefit payments for non-spouse dependents and survivors in all future years.1 Individuals born in 1932 and earlier are given the average current benefits by age and sex. We assume these will grow at the projected growth in the cost of living. Summing across all new and existing retirees in each future year we have an estimate of the system's annual expenditures.
The Old Age and Survivors Insurance (OASI) program is the focus of our analysis. To determine how closely our estimates match the Social Security Administration's, we identify the year in which expenditures will exceed revenues and the year in which the trust fund is exhausted before we proceed with the simulation of the privatization proposal. In aggregate, our model produces simulation results quite similar to the Social Security Administration's estimates. Using our estimates of future taxable earnings and benefit payments, we identify 2014 as the first year in which OASI expenditures exceed tax revenues and 2034 the year the trust fund will be exhausted. These dates were 2015 and 2035, respectively, based on the intermediate estimates in the 1998 Trustees Report.
- Total non-spouse survivor and dependent benefits have been declining over time and accounted for less than 5 percent of total benefit payments under the OASI program in 1995. These benefits as a proportion of the total are expected to further decline in the future. Thus the adjustment we make to the aggregate benefit payment declines in future years.
APPENDIX B
The Simulation Tables
All of the benefits and revenues in the simulations are measured relative to taxable payroll. The first column indicates the percent of taxable payroll required to pay Social Security benefits if they were funded with contemporaneous taxes. The next column shows benefit payments coming from PRA annuities. The third column shows net benefits that continue to be paid by Social Security under the proposal being analyzed. (The 20 percent bonus in the Gramm-Domenici plan is reflected in the net benefits column, so it is more than the status quo benefits minus the PRA benefits. )
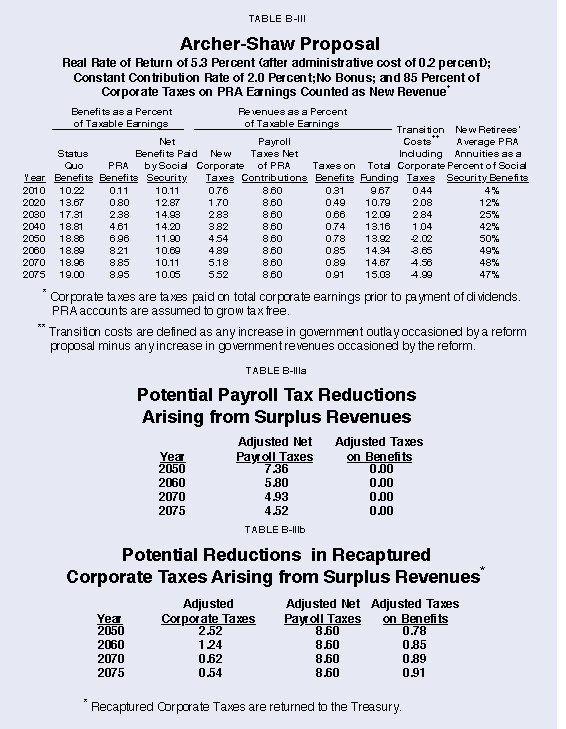
The next four columns identify the funding sources. Corporate taxes, presented as a percent of taxable payroll, rise continuously as the additions to the capital stock increase. The next column shows the payroll tax less the contribution rate, and the column after that shows the taxes collected on Social Security benefits as a percent of taxable payroll. The combination of the three revenue sources is presented in the column under "Total Funding." The difference between the net benefits and total funding produces the transition costs as a percent of taxable payroll. These transition costs now explicitly take into account the corporate tax revenues. The transition costs identified in Table I and the tables that follow are those costs not covered by payroll taxes and corporate taxes. These costs are met from the on-budget surpluses. The final column shows the percentage of average Social Security benefits that can be replaced by the PRA annuities for new retirees in each of the years. The smaller table below each simulation table shows the effects of using the surplus to reduce the payroll tax. Here the taxation on benefits is reduced or eliminated first, with the remainder used for payroll tax relief.
The calculation of aggregate PRA benefits as a percent of taxable earnings should be interpreted with care. Table B-I showed that a contribution rate of 4.2 percent would produce annuities for some groups that are in excess of their expected Social Security benefits and annuities for other groups that fall short of their expected Social Security benefits. Thus summing across all groups of workers would overstate the degree to which the annuities would replace aggregate Social Security benefits. For presentation in this table the aggregate PRA benefits are limited to PRA annuities up to an amount equal to Social Security benefits plus any bonus. If worker annuities exceed the amount they would expect from Social Security, they keep the full amount of excess funds. Only for the accounting in the table do we cap the PRA benefits within a group at the Social Security benefits plus the bonus.
APPENDIX C
Indexing Life Expectancy
One way to do the indexation proposed in the bipartisan proposal is to fix the number of expected retirement years at the level that exists for the age group retiring in 2011 at age 67. Men born in 1944 who reach age 67 in 2011 have a conditional life expectancy of 15.367 years and women have a conditional life expectancy of 18.962 years. Starting with the life expectancies for the age group retiring in 2011, it is then possible to find the youngest birth cohort for which the conditional life expectancy at age 68 is at least 15.367 for men and 18.962 for women. The same can be done for ages 69, 70 and 71. The life tables used in this study are from the Census Bureau and the last year in the data is 2050. From the Census data we calculate life tables for specific birth cohorts. The highest indexed retirement age based on maintaining a fixed number of retirement years is 71. The results are presented in Table C-I.
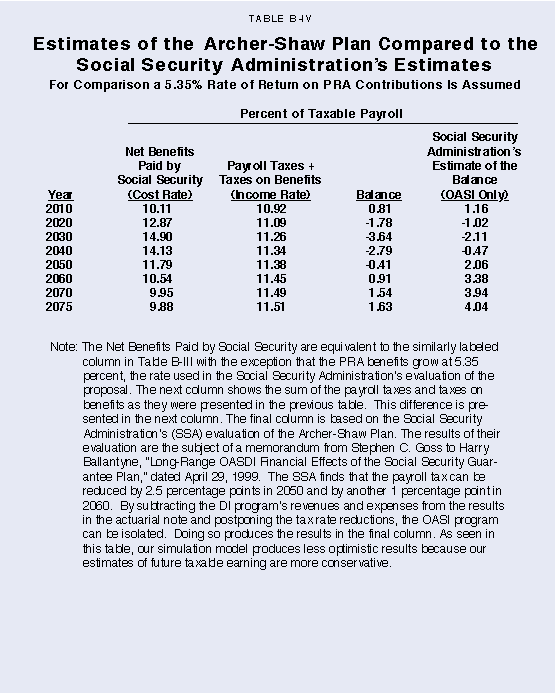
As the table indicates, the indexation based on women's longevity gains lags behind men's. A conservative indexation would use the women's timing. The effect of this choice would slightly extend the phase-in period relative to an indexing based on a gender-neutral index. A possible criticism of indexing the retirement age based on a fixed number of retirement years is that it would produce a falling average retirement period relative to potential work years. For example, assuming that an individual born in 1944 enters the labor force at age 22 and works until retirement at age 67, then for the average male the retirement period is equal to 34.15 percent of the working period (15.367 retirement years / 45 work years). By 2045 the ratio drops to 31.36 percent (15.367 retirement years / (71-22) work years).
An alternative is to fix the ratio of retirement years to work years at the ratio that exists for the individuals who turn 67 in 2011. Such indexation results in a smaller reduction in scheduled benefits than does setting the retirement period at a constant number of years. Indexing the retirement age so that the ratio of retirement to work years remains constant produces the results in Table C-II.
As before, indexation based on women's longevity gains lags behind men's. The first year in which the normal retirement age is fully increased to 66 is assumed to be 2006. Adopting the female experience results in a normal retirement age, indexed so the ratio of the retirement to work period is held constant, of 67 in 2011, 68 in 2028, 69 in 2040 and 70 in 2049. We adopt this latter indexation method in our simulation.
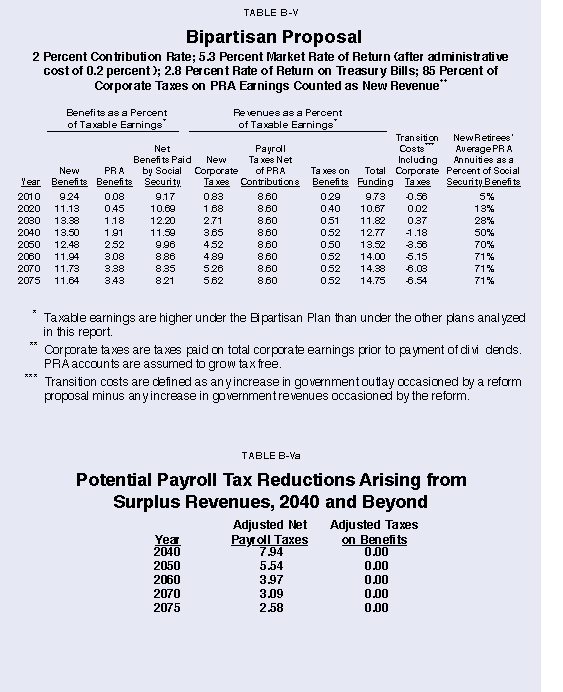
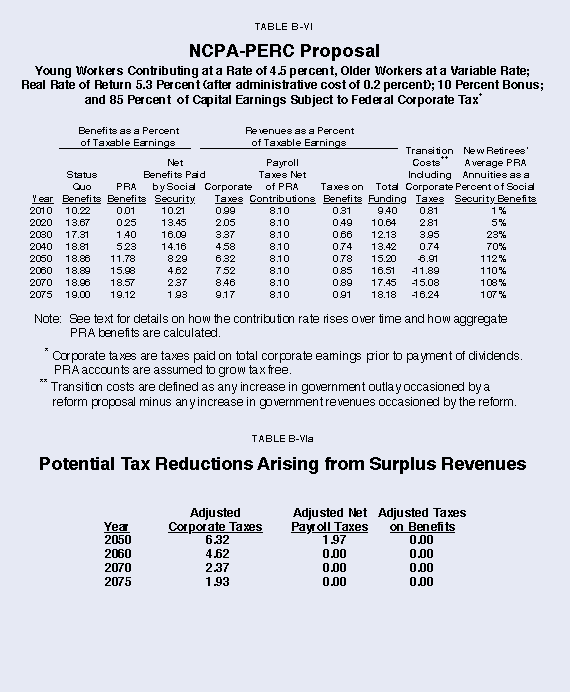
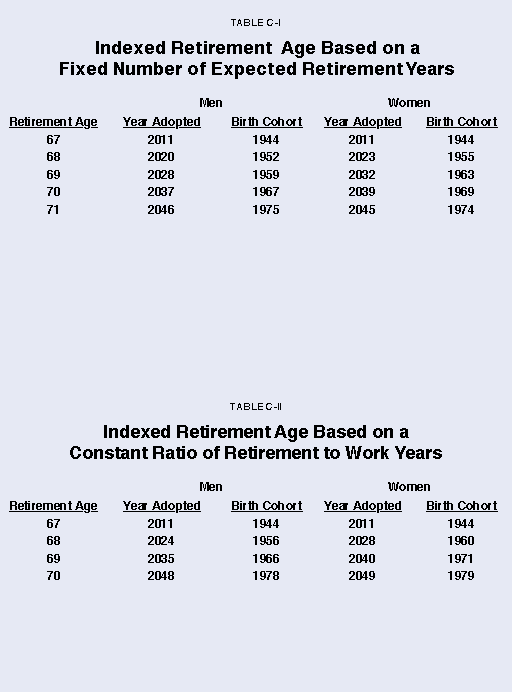
Dr. Andrew J. Rettenmaier is a Research Associate at the Private Enterprise Research Center at Texas A&M University. His primary research areas are labor economics and public policy economics. Dr. Rettenmaier and the Center's Director, Thomas R. Saving, have presented their Medicare Reform proposal to U.S. Senate Subcommittees and to the National Bipartisan Commission on the Future of Medicare. Their proposal has also been featured in the Wall Street Journal, New England Journal of Medicine, Houston Chronicle and Dallas Morning News. Dr. Rettenmaier is the co-principal investigator on several research grants and also serves as the editor of the Center's two newsletters, PERCspectives on POLICY and PERCspectives. He is co-author of a book on Medicare, The Economics of Medicare Reform, and is an editor of Medicare Reform: Issues and Answers, which is forthcoming from the University of Chicago Press.
Dr. Liqun Liu is an Assistant Research Scientist at the Private Enterprise Research Center. His primary research areas are taxation analysis and evaluation of government expenditures. His current focus is on the effects of reforming elderly entitlements. Dr. Liu serves as an investigator on several research grants at PERC. He has papers published or accepted for publication in National Tax Journal, Economic Inquiry, Journal of Institutional and Theoretical Economics, and Review of Economic Design. He has also served as a referee for Economic Inquiry and has presented his research at many academic and public policy conferences.