Serious crime in the United States continued to fall in 1998. Whether measured as a rate (number of crimes per capita) or in absolute terms, every category of violent crime and burglary decreased from 1997.
- The overall rate of serious crime fell to a 25-year low.
- The murder rate dropped by 8 percent from 1997 and finally slumped to the rates of the late 1960s, even falling below the average murder rate during this entire century.
- The rates for rape and aggravated assault fell by 5 percent each, for robbery by 11 percent and for burglary by 7 percent.
- The actual number of murders reported in 1998 was the lowest in more than two decades.
The National Crime Victimization Survey, conducted annually by the Justice Department since 1973, also found the lowest crime rates since the survey began. This survey – which measures crimes by asking randomly selected people whether they have been victims – usually finds a higher rate because fewer than four of every 10 crimes are reported to the police.
Not by coincidence, the likelihood that a criminal will be punished for a serious crime and the amount of time a criminal is likely to spend in prison are higher today than they have been since the 1970s.
What happened in 1998 continued a trend first evidenced in the 1980s, a trend that accelerated in the '90s: there is less crime in the United States, as measured by both the crime rate and the actual number of crimes. Following a fourfold jump in crimes of violence-murder, rape, robbery and serious assaults-and burglary during the 1960s and 1970s, serious crime reported to the police stabilized and then fell.
Over the period, wages have gone up and unemployment has gone down, which has had some impact in reducing crime, but a major reason for the reduction is that crime has become more costly to the perpetrators. The likelihood of going to prison for committing any type of major crime has increased substantially. In 1997, the latest year for which prison data are available, the probability of going to prison for murder rose 13 percent from 1996, for rape 1 percent, for robbery 7 percent and for aggravated assault 11 percent; the probability of going to prison for burglary remained the same. This also is the continuation of a trend. Since 1993:
- The murder rate has dropped 34 percent, as the probability of going to prison for murder has risen 54 percent.
- Rape has decreased 17 percent, as the probability of prison has increased 20 percent.
- Robbery has decreased 35 percent, as the probability of prison has increased 24 percent.
- Aggravated assault has decreased 18 percent, as the probability of prison has increased 26 percent.
- Burglary has decreased 22 percent, as the probability of prison has increased 21 percent.
Moreover, once in prison criminals are staying longer. Compared to the 1980s, the median prison sentence served by prisoners released in the 1990s has risen for every category of serious crime except aggravated assault.
The best overall measure of the potential cost to a criminal of committing crimes is "expected punishment." Roughly speaking, expected punishment is the number of days in prison a typical criminal can expect to serve per crime, as determined by the probabilities of being apprehended, prosecuted, convicted and going to prison, and the median months served for each crime. In 1997 expected punishment continued to increase, rising 20 percent for aggravated assault, 13 percent each for murder and robbery and negligible amounts for rape and burglary compared to 1996. Between 1980 and 1997, expected punishment:
- for murder nearly tripled from 14 months to 41 months.
- for rape tripled to 128 days.
- for robbery increased by 70 percent to 59 days.
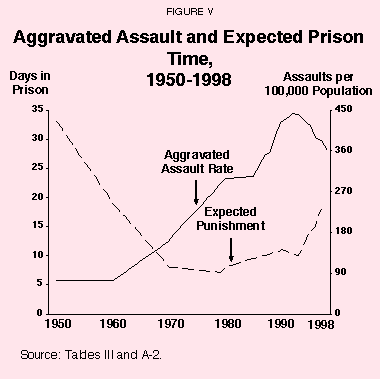
- for serious assault more than doubled to 18 days.
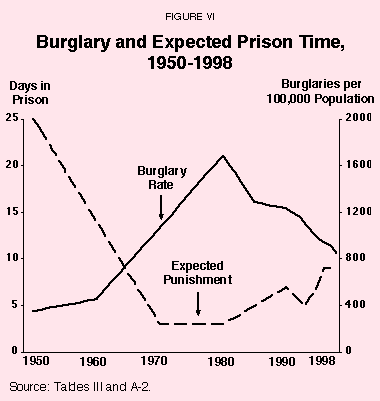
- for burglary more than doubled from 4 days to 9 days.
Despite these increases, it's still amazing how low expected punishment is. As prosecutors point out, it's hard to get to prison.
Evidence shows that potential criminals respond to incentives. Crime decreases when expected punishment increases, and vice versa. Between 1950 and 1980, expected punishment declined more or less continuously from an average of seven weeks for every serious crime committed to only 10 days – an 80 percent drop. In response, the serious crime rate more than quadrupled during those years. In the 1980s, expected punishment began to increase, accompanied by the leveling off and then decline in the serious crime rate. Between 1980 and 1997, expected punishment for serious crimes increased from 10 to 25 prison days, a 150 percent increase, and serious crime declined.
If we are to succeed in achieving an even lower crime rate, we must continue to make crime less profitable by further increasing expected punishment. To achieve that goal there are several options. Expected punishment will increase as we:
- increase the proportion of reported crimes cleared by arrest.
- increase the proportion of the accused who are prosecuted.
- increase the proportion of those prosecuted who are convicted.
- increase the fraction of those convicted who are sentenced to prison.
- increase the average prison time served.
All these options are expensive in the short run. A higher arrest rate requires more money for police staffing, equipment and procedures. Higher conviction and sentencing rates require more resources for prosecution and criminal courts. All three require more prison space. But a tough approach pays, especially over the long run. As the odds worsen for criminals, crimes decline and the same numbers of arrests and convictions begin to reduce the odds favoring criminals.
Although the cost of building and maintaining more prisons is high, the cost of not doing so appears to be higher. One study found that each additional prisoner incarcerated reduces the number of crimes by approximately 15 per year, and yields a social benefit of at least $53,900 annually. Thus, even at $25,000 a year, the cost of keeping the average criminal in prison is worthwhile.
[page]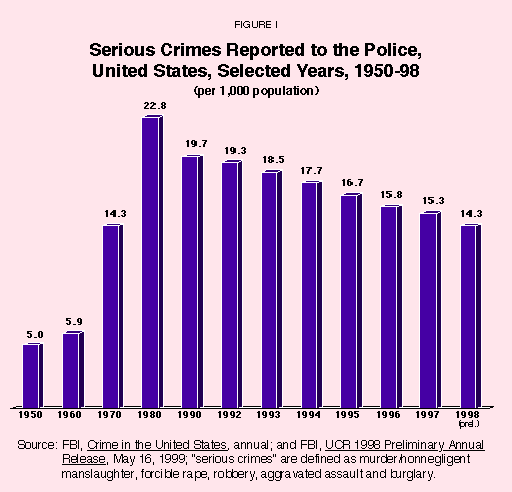
"The serious crime rate in the United States fell to a 25-year low in 1998."
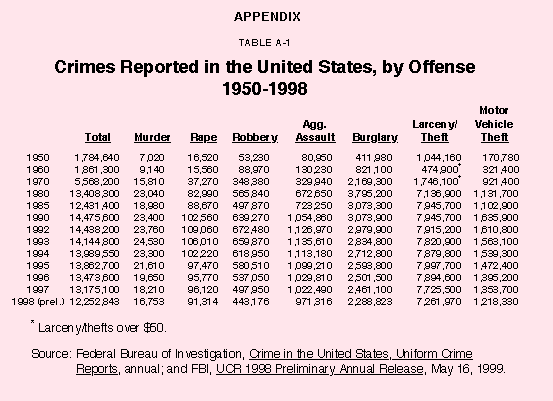
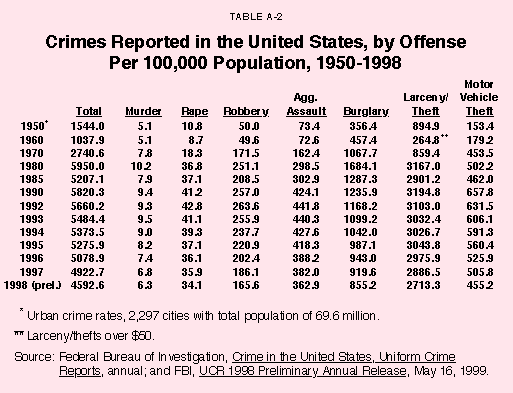
The overall rate of serious crime in the United States fell to a 25-year low in 1998. The murder rate – the number of murders per 100,000 population – dropped 8 percent from 1997 and finally slumped to the rates of the late 1960s, even falling below the average murder rate for the entire 20th century. Not only the murder rate, but also the actual number of murders reported in 1998 was the lowest in more than two decades. Other violent crimes and burglary also showed a decline in 1998. In addition, the National Crime Victimization Survey, conducted annually by the Justice Department since 1973, found the lowest crime rates since the survey began.1
What happened in 1998 continued a trend first evidenced in the 1980s, a trend that accelerated in the '90s: there is less crime in the United States, as measured by both the crime rate and the actual number of crimes. Following a fourfold jump in crimes of violence-murder, rape, robbery and serious assaults-and burglary during the 1960s and 1970s, shown in Figure I, serious crime reported to the police stabilized and then fell. For example, the burglary rate is down nearly 40 percent over the last 20 years.2 In 1997 violent crime rates fell by 4 percent, led by a decline of 8 percent each in murder and robbery.3 Last year violent crime and burglary fell even more than in 1997, by 7 percent, led by an 11 percent decline in robbery and another 8 percent drop in murder.4 Burglary was down 7 percent and rape and aggravated assault dropped 5 percent each.
Not by coincidence, the likelihood that a criminal will be punished for a serious crime and the amount of time a criminal is likely to spend in prison are higher today than they have been since the 1970s.
"Crime costs $4,500 per household each year."
Still, despite the falling crime rate, America continues to be burdened by crime and by the fear that it spawns. A 1998 Gallup Poll shows the public ranks crime and violence as the most important problem facing the country although that ranking is eroding with the decline in crime.5 Closely related problems like moral and family decline, quality of education and drug abuse follow. A 1997 NBC/Wall Street Journal opinion poll found that 57 percent of the public rank crime and education as the top policy concerns. The Justice Department estimates the annual cost of crime to victims at $450 billion (including $424 billion in violent crime), or an annual cost of $4,500 per household.6 The fear of crime is well founded:
- In 1998 an estimated 8.1 million Americans were victims of violent crimes.7
- Over a lifetime the average man in our society has an 89 percent probability of being a victim of an attempted crime of violence and the average woman has a 73 percent probability, although half of the attempts are not completed.8
- A murder is reported to the police every 29 minutes, a forcible rape every five minutes, a robbery every minute and an aggravated (serious) assault every 31 seconds.9
- A motor vehicle theft is reported to the police every 23 seconds, a burglary every 13 seconds and a larceny-theft every four seconds.10
Clearly, there is much more to be done. Why has the crime rate been falling in recent years? What can we do to make it go lower?
[page]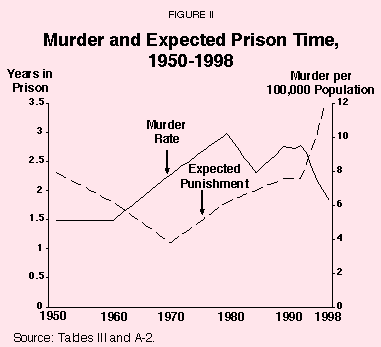
Most offenders are not deranged. And most crimes are not irrational. Instead, criminal acts are freely committed by people who often compare the expected benefits to the expected costs.11 The reason we have so much crime is that, for many people, the benefits outweigh the costs.12 But in recent years the likelihood of going to prison for committing any type of major crime has increased, as has the amount of prison time served. In 1997 alone (the latest year for which prison data are available), the probability of going to prison for murder rose 13 percent from 1996, for rape 1 percent, for robbery 7 percent and for aggravated assault 11 percent; the probability of going to prison for burglary remained the same. In addition, wages have gone up and unemployment has gone down. In response to these developments, people are committing fewer crimes. Since 1993:13
- The murder rate has dropped 34 percent, as the probability of going to prison for murder has risen 54 percent.
- Rape has decreased 17 percent, as the probability of prison has increased 20 percent.
- Robbery has decreased 35 percent, as the probability of prison has increased 24 percent.
- Aggravated assault has decreased 18 percent, as the probability of prison has increased 26 percent.
- Burglary has decreased 22 percent, as the probability of prison has increased 21 percent.
Moreover, once in prison criminals are staying longer. Compared to the 1980s, the median sentence served by prisoners released in the 1990s has risen for every category of serious crime except aggravated assault.
"The likelihood of going to prison for a crime has increased, as has the length of time likely to be spent there."
The best overall measure of the potential cost to a criminal of committing crimes is "expected punishment." Roughly speaking, expected punishment is the number of days in prison a criminal can expect to serve per crime, given the probabilities of being apprehended, prosecuted, convicted and going to prison, and the median months served for each crime. In 1997 expected punishment for murder increased 13.3 percent over 1996, for rape 2.4 percent, for robbery 13.5 percent and for aggravated assault 20 percent; there was no change in expected punishment for burglary. Between 1980 and 1997, expected punishment:
- for murder nearly tripled from 14 months to 41 months.
- for rape tripled to 128 days.
- for robbery increased by 70 percent to 59 days.
- for serious assault more than doubled to 18 days.
- for burglary more than doubled from 4 days to 9 days.
Evidence shows that potential criminals respond to incentives. Crime increases when expected punishment declines, and vice versa. Between 1950 and 1980, expected punishment for crimes of violence and burglary declined more or less continuously from an average of seven weeks for every serious crime committed to only 10 days – an 80 percent drop. In response, the serious crime rate more than quadrupled during those years. In the 1980s, expected punishment began to increase, accompanied by the leveling off and then a decline in the serious crime rate. Between 1980 and 1997, expected punishment for serious crimes more than doubled, increasing from 10 to 25 prison days. Over the same period, the crime rate fell nearly 40 percent.
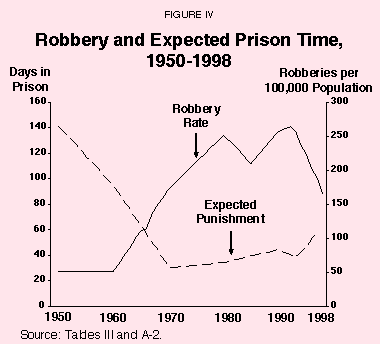
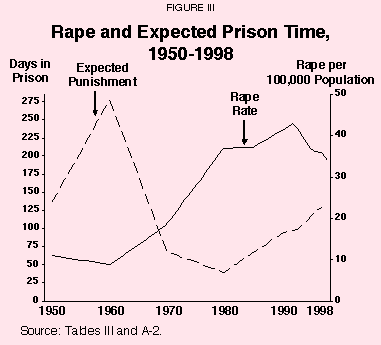
Figures II to VI [II, III, IV, V, VI] show the relationship between each type of violent crime and burglary and its respective expected punishment since 1950. While far from perfect, the negative association between the amount of each crime and its expected punishment is apparent.14
"Between 1990 and 1997, expected punishment for serious crimes more than doubled."
It is virtually impossible to prevent people outside of prison from committing crimes. Since criminals do not knowingly commit crimes in front of the police, the police rarely catch them in the act. The criminal justice system relies on punishments imposed afterward. In effect, the system constructs a list of prices (expected punishments) for various criminal acts, and criminals decide whether they are willing to pay, just as many of us decide whether to risk parking or speeding tickets.
Viewed this way, the expected prison sentences are the prices we charge for various crimes. Thus, the price of murder is three years in prison after we factor in the odds of getting away with it, the price of burglary is about nine days and the price of auto theft is two days.
Expected punishment as a measure of the cost of committing a crime also captures the effectiveness of the criminal justice system in a single number. Expected punishment is not the same as the length of time criminals stay in prison. Rather, expected punishment is calculated by multiplying four probabilities – of being arrested for a crime after it is committed, of being prosecuted if arrested, of being convicted if prosecuted and of going to prison if convicted – and then multiplying that product by the median prison time served for an offense.15
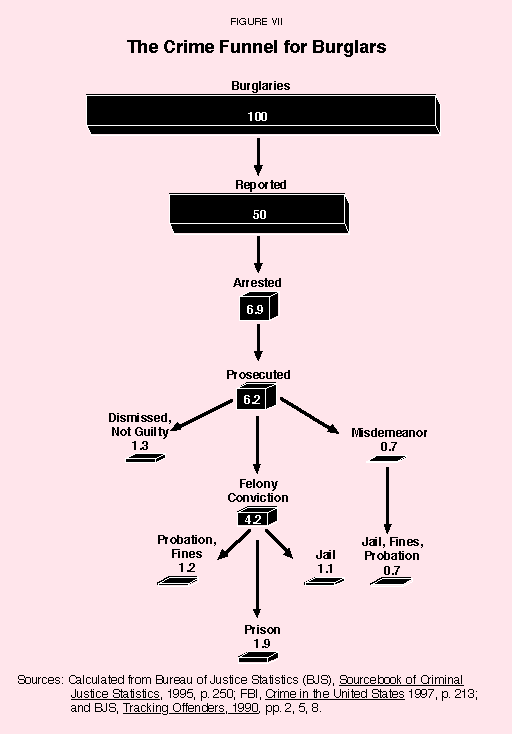
Example: Expected Punishment for Burglary. Consider the details for burglary. As shown in Figure VII:
- For every 100 burglaries committed, about 50 will be reported to the police.
- FBI data show that about 13.8 percent of reported burglaries will be cleared by arrest, or about 6.9 burglaries out of the 50 reported.
- The tracking data on offenders [see Table I] show that about nine out of every 10 arrests for burglary will be prosecuted, or 6.2 out of 6.9.
- Two-thirds of the resulting 6.2 prosecutions will result in felony convictions, or 4.2 felony convictions out of every 100 burglaries.16
- Of these convictions, 1.9 felons will be sent to prison while the remaining 2.3 will receive some combination of probation, fines or jail time.
Thus, this approach shows that the overall probability of doing any prison time for committing a burglary is only 1.9 percent.
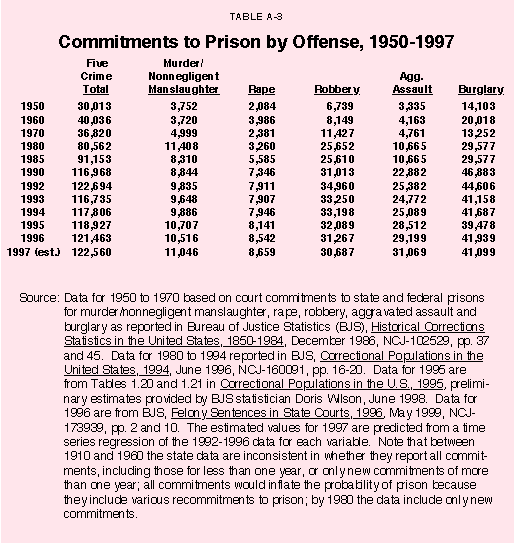
Once in prison, a burglar will stay there for a median time of about 18.5 months. In 1997 an estimated 1.7 of every 100 burglaries reported to the police resulted in prison time (41,099 court commitments to prison of 2,466,100 reported burglaries), so the median prison term per act of burglary is only 9.4 days (1.7 percent x 18.5 months x 30 days per month). While this may seem like a short time, it is a sharp increase over the expected punishment of 4.8 days in 1990.17
On average then, a potential criminal can expect to spend nine days in prison for an act of burglary. This expectation of prison time per crime is, of course, heavily influenced by the chances of getting away with it. However, on the average, a rational, risk-neutral criminal should find burglary profitable so long as what is stolen is worth more than nine days behind bars.18
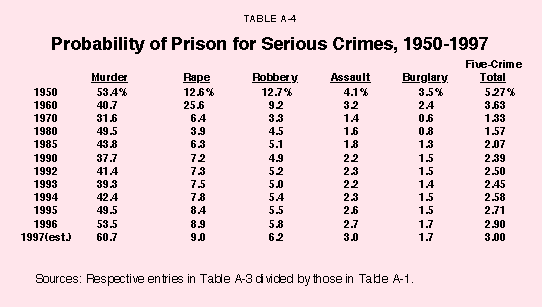
"There is a 39.9 percent probability of serving prison time for a murder."
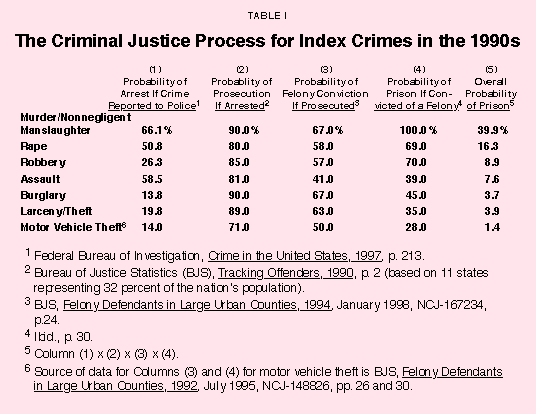
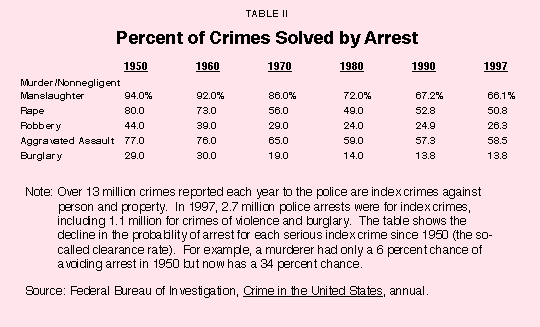
Expected Punishment for Other Crimes. Table I displays the 1997 probabilities of arrest, the 1990 probabilities of prosecution, and the 1994 probabilities of conviction and imprisonment for the other FBI index crimes as well.19 Multiplying these probabilities together results in probabilities of prison time ranging from 1.4 percent for motor vehicle theft to 39.9 percent for murder. Table II shows how the clearance (that is, the solving) of serious crimes by arrest has declined since 1950. In 1950, for example, 94 percent of murders were cleared by an arrest but only 66 percent of murders in 1997 were (i.e., the chance of getting away with murder rose from 6 percent to 34 percent). Similar declines in arrest clearance ratios occurred for the remaining crimes.
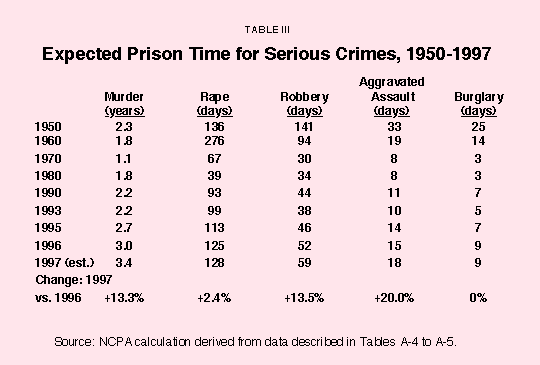
Expected punishment for five serious crimes for selected years is shown in Table III. In 1950 expected punishment for murder and nonnegligent manslaughter was 2.3 years. This had dropped to 1.1 years by 1970, but increased to 3.4 years by 1997. Capital punishment was a more serious concern for murderers in the late 1940s and early 1950s, when over 100 prisoners were executed each year after relatively short stays on death row. This compares to 39 executions per year in the 1990s after death row stays averaging nine to 10 years. In 1950 the chance of a murderer being executed was 1 in 67 murders and in 1997 only 1 in 246 murders, one-quarter of the 1950 risk. Eighteen states executed 68 prisoners in 1998, with Texas in the lead with 20 executions, followed by Virginia with 13 and South Carolina with 7. Executions in 1999 may top 100, the highest total since 1951.
As can be seen from Table III, expected punishments for the four crimes other than murder follow the same U-shaped pattern as murder over time, with punishment falling for the first few decades and then rising in the 1980s and 1990s. In 1997 expected punishment continued to increase, rising 20 percent for aggravated assault, 13 percent each for murder and robbery and negligible amounts for rape and burglary compared to 1996.
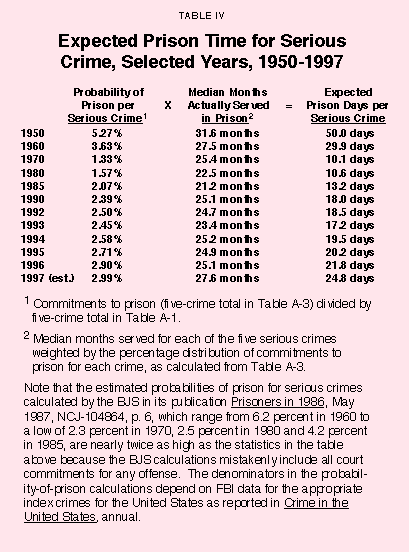
Table IV shows the probability of prison time and median months served for the five serious crimes combined. This is perhaps the best overall index of the effectiveness of the criminal justice system, as well as a measure of the threat posed by the system to criminals. The probability of prison declined steeply between 1950 and 1970 and then slowly recovered, yet it is only half that of 1950. Median months served have recovered to more than two years but still fall short of the 32 months served in 1950. Expected punishment has recovered to 83 percent of what it was in 1960 (25 days versus 30 days).
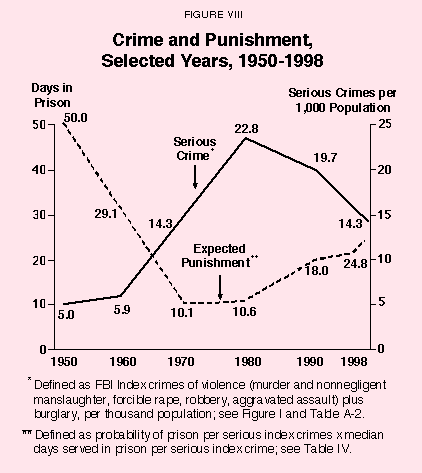
The serious crime rate exploded during the 1960s and 1970s, rising from only five per 1,000 population per year to more than 22, while the expected punishment per crime plunged from 50 prison days in 1950 to only 10 days in 1970 [see Figure VIII]. In the midst of the 1960s and 1970s crime explosion, the number of commitments by courts for serious predatory crimes actually fell from 40,000 in 1960 to 37,000 in 1970 as the number of serious crimes reported to police nearly tripled from 1 million to 2.9 million. As a result, the probability of imprisonment for committing a serious crime reported to the police nearly collapsed, plunging from 3.6 percent per crime in 1960 to 1.3 percent in 1970, as shown in Table IV.
"Since 1980 the serious crime rate has dropped by almost 40 percent, as expected punishment has more than doubled."
Expected punishment per reported serious crime remained low until the early 1980s because prison time fell while the probability of going to prison began to increase, leaving expected punishment essentially unchanged. Sentences served were shorter primarily because of court orders and prison capacity constraints that kept the criminal justice door revolving rapidly. Not until the mid-1980s did expected punishment begin to rise for predatory crimes. Yet expected punishment in the 1990s remains below the 30 days of 1960 and the 50 days of 1950.
Between 1985 and 1996, the overall probability of going to prison for all index crimes, including larceny/theft and motor vehicle theft, increased from 0.8 percent to 1.2 percent. The expected punishment for property crimes increased about 20 percent, for violent crimes about 30 percent. Yet criminals still can expect to spend only about two days in prison per property crime. The primary reason for the low expected punishment rate is that the vast majority of reported property crimes are not cleared by an arrest and/or do not result in any prison time served (although the latter fact may be consistent with justice for most property crimes).
Much of the recent increase in expected punishment results from an increase in the probability of going to prison, especially the higher odds of being prosecuted, convicted and sent to prison following an arrest. In the last 10 years, prisoners served longer sentences too. During that period, the median time for those serving a prison term for a violent index crime increased from 20 months to 25 months while the median time served for property offenders remained flat at 12 months.20
[page]"A tough approach pays, especially over the long run."
If we are to succeed in lowering the crime rate to, say, the level of the 1950s, we must create at least as much deterrence as existed then, especially since our society today has far more illegitimacy, single parenting and negative family conditions. Robbers, for example, served expected median prison terms of 140 days in 1950 vs. 59 days in 1997. Getting back to 1950 punishment for robbery would require more than doubling the expected punishment per robbery. The three ways of doing so are to:
- increase the proportion of reported robberies cleared by arrest from 26.3 to 62.4 percent.
- increase the proportion of the accused who are prosecuted, convicted and imprisoned from 34 to 81 percent.
- increase the median prison time served by robbers from 31.5 to 74.7 months.
All three are expensive in the short run.21 A higher arrest rate requires more money for police staffing, equipment and procedures. Higher conviction and sentencing rates require more resources for prosecution and criminal courts. All three require more prison space for robbers. But a tough approach pays, especially over the long run. As the odds worsen for criminals, crimes decline and the same numbers of arrests and convictions begin to reduce the odds favoring criminals.
[page]Although the cost of building and maintaining more prisons is high, the cost of not doing so appears to be higher. A number of researchers have found that keeping most prisoners behind bars lowers their cost to society.22
- Bureau of Justice Statistics (BJS) figures from a few years ago showed that it cost under $16,000 per year to keep a prisoner in state or federal prison. Hidden and indirect expenses to taxpayers may inflate this figure to $20,000 or $25,000 per year.
- In the late 1970s the Rand Corporation found in prisoner surveys in Texas, Michigan and California that the median number of nondrug crimes committed by prisoners the year before they were incarcerated was 15; similar surveys in Wisconsin in 1990 found 12 nondrug crimes, as did a 1993 New Jersey survey.
- Based on Vanderbilt University management professor Mark Cohen's analysis of jury awards, the average annual social damage prevented by incarcerating a newly admitted New Jersey criminal is $1.6 million and the median damage prevented is $70,098.
- A study of 12 states that were forced by court orders to reduce levels of imprisonment found that incarcerating one additional prisoner reduces the number of crimes by approximately 15 per year, the majority of them property crimes, and yields a social benefit of at least $53,900 annually.23
"Even at $25,000 a year, keeping the average criminal in prison is worthwhile."
Thus, even at $25,000 a year, keeping the "average" criminal in prison is worthwhile, since on the streets he would commit an average of 12 or more nondrug crimes each year. For serious crimes, therefore, imprisonment pays for itself.24 The researchers measured benefits only in terms of crime prevention and ignored retributive, deterrent and rehabilitative benefits. Thus they underestimated the benefits of prison to society.
Moreover, the failure to keep offenders in prison once they are there is another hazard created by a lack of prison space, and early release often leads to more crime.
- A Rand Corporation survey of former inmates in Texas found that 60 percent were rearressted within three years of their release and 40 percent of those were reconvicted.25
- A survey of 11 states showed that 62 percent of all released prisoners were rearrested within three years, 47 percent were reconvicted and 41 percent were reincarcerated.26
- A study of 22 states for the Bureau of Justice Statistics found that 69 percent of young adults (ages 17-22) released from prison in 1978 were rearrested within six years, after committing an average of 13 new crimes.27
As BJS statistician Patrick Langan pointed out in Science, whatever the causes, in 1989 there were an estimated 66,000 fewer rapes, 323,000 fewer robberies, 380,000 fewer assaults and 3.3 million fewer burglaries than there would have been if the crime rate had been at the 1973 level. If only one-half or even one-fourth of the reductions resulted from increased incarceration, imprisonment has reduced crime significantly.28 However, few would deny that "a great deal of research remains to be done on the social costs and benefits of imprisonment and other sentencing options."29
[page]The most promising way to control taxpayers' costs includes privatizing prison construction and operation. Short of full privatization, government-operated correctional facilities could be corporatized and operated like private businesses.
Economic theory implies that if there were better markets to buy, sell and rent prison cells, the problems of funding and efficiently allocating prison space would decrease. And there are numerous – unexploited – opportunities to reduce the net costs of prisons by creating factories behind bars, having prisoners earn their keep and compensate victims.
"A number of studies have found savings of 20 percent for private construction of prisons and 5-15 percent for private management."
Privatizing Prisons. A number of studies have found savings of 20 percent for private construction costs and 5-15 percent for private management of prison units.30 Further, independent observers who monitor, for example, the contracts of Corrections Corporation of America (CCA), a Nashville, Tenn., company, praise the quality of the company's operation.31 George Zoley of Wackenhut Corp. in Coral Gables, Fla., years ago predicted a gradual building process in which the private sector establishes a "good track record and proves it can do the job."32 Within a decade, it has come to pass:
- With 70,937 adult prisoners in secure private correctional facilities at year-end 1997, the market share of private prisons has risen to 4 percent of the U.S. prison and jail population.33
- Between 1996 and 1997, private facilities under contract in the United States also rose from 118 to 142, a one-year increase of 20 percent.
- Over 7,000 federal prisoners were housed in private correctional facilities at the end of 1997.
- Texas leads the nation in privatization, with 41 private adult correctional units in operation or under construction.
Major companies in the industry include CCA, with a rated capacity of 50,866 in facilities under construction and planned expansions in the United States, Wackenhut Corrections with 22,257 and U.S. Corrections Corporation with 5,259. Profits, however, remain modest.34 For example, CCA and Wackenhut report small profits, but Pricor, Inc., of Murfreesboro, Tenn., an early leader in the industry, quit adult corrections after suffering a series of losses. Last year, the stock prices of publicly traded companies like CCA and Wackenhut Corrections traded at historic highs and other corrections companies were able to successfully sell initial and secondary stock offerings.35 More recently, CCA sold at 23 times 1998 estimated earnings and Wackenhut at 27, more moderate multiples, suggesting less investor optimism about future earnings, despite rapidly improving earnings.
There is no insurmountable legal obstacle to total privatization of prison operation.36 Unlike government agencies, private firms must know and account for all their costs, including long-run costs.37 Governments conceal costs and markets reveal them (as well as reduce them). If private enterprises can operate prisons for less than the government with equal or better quality services – and all indications are that they can – then government should set punishments for felons and let the private sector supply prisons.
- CCA charges Harris County, Texas, and the Immigration and Naturalization Service only $35.25 per inmate per day to operate a 350-bed minimum-security facility in Houston, a charge that includes recovery of the cost of building the facility.38
- Operating costs for government-run prisons can be twice that amount, even without taking construction and land costs into account.39
"Given the grim predictions of opponents, very little has gone wrong with privatization."
What Can Go Wrong with Privatized Prisons. Privatization of jails and prisons has been perhaps the most controversial topic in corrections during this century.40 Given all that could have gone wrong during the 15-year experience with private prisons on three continents, and the grim predictions of its opponents, very little has gone wrong. No serious corruption of public officials by private prison operators has been exposed. No extraordinary number of inmates have escaped from private facilities. Reports of prisoner abuse or violence have been extremely rare. In fact, no systematic evidence has shown that private operators are not doing the job better and cheaper. Academic studies show superior performance by the private sector, including lower recidivism among inmates released from private facilities.41
The only negative report by a noteworthy independent source was from the U.S. General Accounting Office, which reported "little difference and/or mixed results in comparing private and public facilities" and "could not conclude whether privatization saved money."42 The GAO report was widely publicized by opponents of privatization. Unfortunately, the authors ignored most of the evidence, including carefully prepared reports from Australia, Florida, Louisiana, Texas and the United Kingdom. The authors knew that statutes in most jurisdictions define contracting with private operators as unlawful unless the jurisdiction can demonstrate cost savings, but chose to ignore this fact. The report also trivializes the accreditation process of the American Correctional Association, a demanding test at which private facilities excel. In a detailed refutation, Professor Charles Thomas of the University of Florida terms this last error "sophomoric," while describing the overall report as "inaccurate," "misleading" and "ineptly prepared."43
A third option, yet untested, is to contract out adult facilities to nonprofit groups, including faith-based prison operators. As Professor Richard Moran of Holyoke College puts it, "A private, not-for-profit foundation is in the best position to organize a prison around a set of principles intended to reshape criminals into honest, productive citizens."44 No public officials have yet had to courage or sense to try such a jail supplier, despite the successes nonprofit and faith-based hospitals, schools and juvenile programs have had.
Employing Prisoners. America's prisons originally were intended to be self-supporting, and during the 19th century many state prisons ran surpluses and returned excess funds to their governments. In 1885 three-fourths of prison inmates were involved in productive labor, the majority working in contract and leasing systems. Fifty years later only 44 percent worked, and almost 90 percent of them worked in state rather than private programs.45 Today, prison inmates are a huge drain on taxpayers, despite the millions of available hours of healthy, prime-age labor they represent.
"Federal and state laws, as well as bureaucratic obstacles, impede more labor by prisoners."
Increasing productive work for prisoners can be facilitated by repeal or liberalization of some federal and state statutes and clearing away bureaucratic obstacles. The federal Hawes-Cooper Act of 1929 authorized states to prohibit the entry of prison-made goods produced in other states. The Walsh-Healy Act of 1936 prohibited convict labor on government contracts exceeding $10,000. The Sumners-Ashurst Act of 1940 made it a federal offense to transport prison-made goods across state borders, regardless of state laws.46
Throughout the nation, a score of exceptions to the federal restrictions on prison labor have been authorized, provided the inmates are paid a prevailing wage, labor union officials are consulted, other workers are not adversely affected and the jobs are in an industry without local unemployment.47
A survey commissioned by the National Institute of Justice identified more than 70 companies that employ inmates in 16 states in manufacturing, service and light assembly operations.48 Prisoners sew leisure wear, make water-bed mattresses and assemble electronic components. PRIDE, a state-sponsored private corporation that runs Florida's 46 prison industries – from furniture making to optical glass grinding – made a $4 million profit in 1987.49
Such work enables prisoners to earn wages and acquire marketable skills while learning individual responsibility and the value of productive labor. It also ensures that they are able to contribute to victim compensation and to their own and their families' support while they are in prison. A 1991 study by the U.S. Bureau of Prisons found that only 6.6 percent of federal inmates who had been employed in prison industries violated their parole or were rearrested within a year of their release vs. 20 percent for nonemployed prisoners.50
In 1990 7.6 percent of all state and federal inmates had jobs in correctional industries; by 1996 this had dropped to 6.6 percent (under 80,000 inmates) because traditional correctional industries, mostly socialist-run, were not expanding fast enough to keep pace with inmate population.51 Gross sales were $1.6 billion, overwhelmingly to other government agencies, and wages paid to inmates were $74 million, or less than 5 percent of gross sales.52
In 1997 the Private Sector Prison Industry Enhancement program had nearly 100 private firms employing 2,400 inmates to manufacture goods ranging from circuit boards to bird feeders to graduation gowns.53 Airline reservations, telemarketing, data processing and map digitizing services employed others. At the current annual rate, $13 million in gross wages is being paid (approximately $6,600 per prison-employee year), for a cumulative total of $50 million since 1979. Prisoners have retained 56 percent of their wages and paid out the rest in room and board (19 percent), taxes (12 percent), victim restitution (6.6 percent) and family support (6.4 percent).
"Only about 5,000 prisoners (less than 1 percent) work for private companies."
South Carolina and Nevada have become leaders in private sector use of prison labor, yet nationally only about 5,000 prisoners (far less than 1 percent) work for private companies because of the additional costs of doing business in prisons.54
Fred Braun Jr., president of Workman Fund in Leavenworth, Kan., has been a key promoter of Private Sector Prison Industries (PSPI). Organized as a nonprofit foundation, Workman lends venture capital to private enterprises interested in training and employing prisoners on-site in "real world" work. Workman reported promising results from an enterprise in which convicts worked alongside nonconvict labor. Braun also is president of Creative Enterprises, the umbrella company for two plants, Zephyr Products, Inc. (sheet metal products) and Heatron, Inc. (electric heating elements), which train and employ minimum-custody inmates at the Lansing East Unit in Leavenworth.55 Braun's original vision was of an industrial park of three or four firms employing 200. Thirteen years after opening Zephyr, he had added no more businesses, but his two original plants were employing about 150 prisoners.56
Bureaucratic inertia slows the transition to private work for prisoners. For example, the state corrections system in Texas has long been a leader in state-run prison industries, which probably has hindered the introduction of private sector opportunities for prison employment and production there.
Among the steps that should be taken to make prisons hum with productive activity are:
- Repeal or liberalize the various state and federal laws that restrict trade in prison-made goods.
- Repeal the laws that compel government agencies to buy prison-made goods and allow competitive bidding by the agencies.
- Create prison-enterprise marketing offices within prison and jail systems.
- Allow private prison operators to profit from the gainful employment of convict labor.
Such reforms would overwhelmingly benefit American taxpayers, consumers, workers and businesses.57 Congressmen Bill McCollum (R-Fla.), chairman of the U.S. House Judiciary's subcommittee on crime, and Pete Hoekstra (R-Mich.), have recently introduced new legislation to reform federal prison industries.
[page]"As the odds of imprisonment have increased, the national crime rate has decreased."
The odds of imprisonment for a serious offense increased in the late 1980s and 1990s as legislators responded to the public's "enough is enough" attitude. The result has been a decreasing national crime rate. To build on this trend, we must continue raising the odds of imprisonment, making crime less attractive for potential criminals. We also must reduce prison costs through privatization.58 Finally, we must relax the laws hampering the productive employment of prisoners.
NOTE: Nothing written here should be construed as necessarily reflecting the views of the National Center for Policy Analysis or as an attempt to aid or hinder the passage of any bill before Congress.
[page]- The U.S. Department of Justice administers two statistical programs to measure the magnitude, nature and impact of crime in the nation: the Uniform Crime Reporting (UCR) program and the National Crime Victimization Survey (NCVS). Crimes reported to state agencies or the FBI – murder/nonnegligent manslaughter, forcible rape, robbery, aggravated assault, burglary, larceny/theft and motor vehicle theft – are compiled in the FBI Index of Crime – part of the UCR program – and are sometimes referred to as "index crimes." The NCVS collects detailed information on crimes from a nationally representative sample of approximately 43,000 households to determine the amount of crime according to victims age 12 and older – not all of whom report the crime to the police. Since fewer than four of every 10 crimes are reported, the NCVS is thought to be the best estimate of the true amount of crime, yet both the UCR and the NCVS undercount crime in America. For example, the NCVS does not measure murder, crimes against those under age 12 or against those in jails and prisons. According to the survey, the rate of violent victimization declined from 1981 to 1986 (a drop of 20 percent) and then rose from 1986 to 1991 (up 15 percent). Because of a survey redesign, the data are not directly comparable with the data collected prior to 1993, but the Bureau of Justice Statistics (BJS) asserts that violent crime victimization rates showed little change from 1992 to 1994, then dropped 10 percent in 1995. Between 1993 and 1998, violent crime has dropped 27 percent and property crime 32 percent. See BJS, Criminal Victimization 1998: Changes 1997-98 with Trends 1993-98, July 1999, NCJ-176353. Overall, however, the numbers of violent crimes have remained high, and the FBI Index of Crime shows that the serious crime rate rose from 14.3 per 1,000 population in 1970 to 22.8 in 1980 before beginning its descent to 14.3 in 1998. The NCVS shows that household willingness to report crime to the police has risen since 1973 from 32.4 percent of crimes to 38.7 percent, nearly a 20 percent increase. See BJS, Special Report, Reporting Crimes to the Police, December 1985, NCJ-99432. Studies show that reporting itself discourages crimes. For example, see Itzhak Goldberg and Frederick C. Nold, "Does Reporting Deter Burglars? An Empirical Analysis of Risk and Return in Crime," Review of Economics and Statistics, 62, August 1980, pp. 424-31. Some of the movement in the FBI numbers on serious crimes no doubt reflects this increased willingness to report to the police, as well as improvements in recording and data management by police organizations. Because of this trend toward better reporting, the 1990s decline may understate the real decline in crime. See Federal Bureau of Investigation, Crime in the United States, 1996, pp. 399-400; John J. DiIulio Jr. and Anne Morrison Piehl, "What the Crime Statistics Don't Tell You," Wall Street Journal, January 8, 1997, p. A16; and Steven Levitt, "The Relationship between Crime Reporting and Police: Implications for the Use of Uniform Crime Reports," Journal of Quantitative Criminology 14 (February 1998): 61-82.
- Federal Bureau of Investigation, Crime in the United States, 1997, p. 66.
- Ibid.
- FBI, UCR 1997 Preliminary Annual Release, May 16, 1999.
- BJS, Sourcebook of Criminal Justice Statistics 1997, p. 100.
- Ted R. Miller et al., Victim Costs and Consequences: A New Look, National Institute of Justice, February 1996.
- BJS, Criminal Victimization 1998, NCJ-176353, July 1999; and DiIulio and Piehl, "What the Crime Statistics Don't Tell You."
- BJS, Technical Report, Lifetime Likelihood of Victimization, March 1987, NCJ-104274, p. 2.
- FBI, Crime in the United States 1997, p. 6.
- Ibid.
- Stanton Samenow, a criminal psychologist and interviewer of thousands of criminals, insists, "The criminal is rational, calculating and deliberate in his actions. Criminals know right from wrong…. A habit is not a compulsion. On any occasion, the thief can refrain from stealing if he is in danger of being caught." In Robert James Bidinotto, ed., Criminal Justice? The Legal System Versus Individual Responsibility (Irvington-on-Hudson, NY: Foundation for Economic Education, 1994), p. 48.
- UCLA professor James Q. Wilson has written, "The average citizen thinks it is obvious that people discovered it is easier to get away with it." James Q. Wilson, Thinking About Crime, rev. ed. (New York: Basic Books, 1983), p. 117. "The risks posed by the criminal enforcement system are notoriously low," wrote economist Kip Viscusi, "and data show that youthful criminals know it." W. Kip Viscusi, "The Risks and Rewards of Criminal Activity: A Comprehensive Test of Criminal Deterrence," Journal of Labor Economics, Vol. 4, No. 3, 1986, pp. 317-40. See also the earlier surveys of the literature in Gordon Tullock, "Does Punishment Deter Crime?" The Public Interest, Vol. 36, Summer 1974, pp. 103-11; Morgan O. Reynolds, Crime by Choice (Dallas: Fisher Institute, 1985), ch. 12; Donald E. Lewis, "The General Deterrent Effect of Longer Sentences," British Journal of Criminology, Vol. 26, January 1986, pp. 47-62; Samuel Cameron, "The Economics of Crime Deterrence: A Survey of Theory and Evidence," Kyklos, 41, 1988, pp. 301-23; Bidinotto, ed., Criminal Justice? The Legal System Versus Individual Responsibility; Levitt, "Using Electoral Cycles in Police Hiring to Estimate the Effect of Police on Crime." Steven D. Levitt, "The Effect of Prison Population Size on Crime Rates: Evidence from Prison Overcrowding Litigation," Quarterly Journal of Economics, Vol. 111, Issue 2, May 1996, pp. 319-51; Isaac Ehrlich, "Crime, Punishment and the Market for Offenses," Journal of Economic Perspectives, Vol. 10, No. 1, Winter 1996, pp. 43-67; Simon Hakim and Yochanan Shachmurove, "Spatial and Temporal Patterns of Commercial Burglaries: The Evidence Examined," American Journal of Economics and Sociology, Vol. 55, No. 4 (October 1996), pp. 443-56; and Steven D. Levitt, "Juvenile Crime and Punishment," Journal of Political Economy, Vol. 106, November/December 1998, pp. 1156-85.
- Calculated from Appendix, Tables A-2 and A-4.
- Statistically, a simple correlation between two variables may range from +1.0 to -1.0, indicating that crime and expected punishment go up and down together perfectly (+1.0) or go up and down in a pattern perfectly opposite from each other (-1.0) or somewhere in between. The simple correlation between each crime and its respective expected punishment is zero for murder, -.47 for rape, -.63 for aggravated assault, -.86 for robbery and -.86 for burglary. All correlations but murder are negative and therefore consistent with the theory that punishment deters, and the correlations are most significant for robbery and burglary, increasing our confidence that crimes with an obvious economic motive are particularly sensitive to expected punishment. If each crime rate is regressed on its respective expected punishment and a time trend to account for other determinants of crime, the time trend is strongly positive for crimes of violence and virtually zero for burglary. The punishment impact remains strongest for burglary in these regressions.
- Limited data restrict the calculation of detailed probabilities to a few years (the most recent calculation largely relies on 1994 data), but even the limited calculations that are possible illustrate how these probabilities result in low odds of prison time and therefore low expected punishment.
- This felony conviction rate means that 61 percent of burglary arrests result in a felony conviction (4.2 ÷ 6.9). A more recent BJS study found an even lower 41 percent of burglary felony arrests result in a felony conviction. See BJS, Felony Sentences in State Courts, 1996, May 1999, NCJ-173939, p. 9.
- Morgan O. Reynolds, "Why Does Crime Pay?" NCPA Policy Backgrounder No. 110, National Center for Policy Analysis, November 6, 1992, p. 3.
- On the rationality of burlgars, see the interviews with over 100 active burglars in Richard T. Wright and Scott H. Decker, Burglars on the Job (Boston: Northeastern University Press, 1994).
- The most recent criminal justice probabilities shown in Table I are available only for 1990 and 1994. Fortunately, we do not need such detail to calculate expected punishment. We require only three numbers for each type of crime: (1) the number of new convicts the courts sent to federal and state prisons for those crimes, (2) the number of those crimes reported to the police and (3) the median prison time served by those released from prison. Mathematically, the probability of prison equals the percentage of crimes cleared by arrest multiplied by the ratio of prosecutions to arrests multiplied by the ratio of convictions to prosecutions multiplied by the ratio of those sent to prison to total convictions; that is, the ratio of new prisoners to number of crimes. Reasonable approximations for these data are available in selected years all the way back to 1950, while the more abundant data since 1985 allow more reliable calculation of expected punishment.
- The average sentence served is more relevant to habitual criminals, while the median is more appropriate for offenders with less substantial criminal records and less heinous crimes. Average time served is calculated by adding all the time served for index crimes and dividing by the number of crimes reported. Median time served is calculated by arranging the time served in order from shortest to longest; the median is the middle value, with half below and half above. If average time served is used as the measure of punishment severity, then the expected cost of punishment to criminals is substantially higher. The average time served in prison exceeds the median time served because the average is sensitive to the minority of prisoners released after serving extremely long sentences. The median, by contrast, is insensitive to the longest imprisonments. In 1985 the average time served exceeded the median time by about 30 percent and in 1995 by 40 percent, due to tougher sentencing policies.
- Supreme Court decisions in the 1960s expanded the rights of criminal suspects and had substantial detrimental effects on law enforcement productivity, permanently reducing the arrest clearance rate. Changes in these rules could dramatically increase police productivity and diminish crime without additional taxpayer expense or harm to civil liberties. See, for example, Paul Cassell, "Handcuffing the Cops: Miranda's Harmful Effects on Law Enforcement," NCPA Policy Report No. 218, August 1998, National Center for Policy Analysis.
- Anne Morrison Piehl and John J. DiIulio Jr., "Does Prison Pay? Revisited," Brookings Review, Winter 1995, pp. 21-25; also see William J. Bennett, John J. DiIulio Jr. and John P. Walters, Body Count: Moral Poverty and How to Win America's War Against Crime and Drugs (New York: Simon & Schuster, 1996), pp. 112-117.
- Steven D. Levitt, "The Effect of Prison Population Size on Crime Rates: Evidence from Prison Overcrowding Litigation," Quarterly Journal of Economics, May 1996, pp. 319-51.
- Prisons, however, do not pay for themselves with many drug offenders, who have grown to 30 percent of new state prisoners, up from 7 percent in 1980. There is no social benefit for incarcerating drug dealers, according to Piehl and DiIulio, because they are readily replaced in the drug marketplace. Hence, the researchers calculate that prisons cannot pass a cost-benefit test for about one in four prisoners.
- Stephen Klein and Michael Caggiano, Policy Implications and Recidivism (Santa Monica, Calif.: Rand Corporation, 1986); and Joan Petersilia et al., Prison Versus Probation (Santa Monica, Calif.: Rand Corporation, 1986).
- U.S. Department of Justice, Bureau of Justice Statistics, Sourcebook of Criminal Justice Statistics, 1988, p. 658.
- Allen Beck, Recidivism of Young Parolees (Washington, D.C.: BJS, 1987). Also see "The Case for More Incarceration," Office of Policy Development, U.S. Department of Justice, in Bidinotto, ed., Criminal Justice? The Legal System Versus Individual Responsibility.
- Quoted in Bidinotto, Criminal Justice? The Legal System Versus Individual Responsibility, p. 214. Also see George Allen, "The Courage of Our Convictions: The Abolition of Parole Will Save Lives and Money," Policy Review, Spring 1995, pp. 4-7.
- Bennett, DiIulio, and Walters, Body Count, p. 116. A recent Rand Corp. study, for example, finds that mandatory long-term prison sentences for low-level cocaine users and dealers are not cost effective compared to judicial discretion to order offenders to serve shorter terms and undergo treatment. Full text at http://www.Rand.Org/publications/RB/RB6003.
- Gary W. Bowman, Simon Hakim and Paul Seidenstat, eds., Privatizing Correctional Institutions (New Brunswick, N.J.: Transaction Publishers, 1993); and Charles W. Thomas, Director, Private Corrections Project, Center for Studies in Criminology and Law, University of Florida, Gainesville, Fla., Private Adult Correctional Facility Census, 10th ed., March 15, 1997, p. vi.
- For a comparison of the quality of private and public prisons, see Charles H. Logan, "Well Kept: Comparing Quality of Confinement in Private and Public Prisons," in Journal of Criminal Law and Criminology, Vol. 83, No. 3, Fall 1992, pp. 577-613. In a comparison of privately and publicly operated corrections facilities in Kentucky and Massachusetts, both staff and inmates generally gave higher ratings to the services and programs at the privately operated facilities, where escape rates also were lower and disturbances fewer. See Dana C. Joel, "The Privatization of Secure Adult Prisons: Issues and Evidence," in Bowman, Hakim and Seidenstat, eds., Privatizing Correctional Institutions.
- Bruce Benson, The Enterprise of Law: Justice Without the State (San Franciso: Pacific Research Institute for Public Policy, 1990), p. 345.
- Thomas, Private Adult Correctional Facility Census, July 25, 1998; http://web.crim.ufl.edu/pcp/index.html.
- Wall Street Journal, June 10, 1993, p. B2.
- Thomas, Private Adult Correctional Facility Census, p. vi.
- CCA offered to operate the entire prison system for the state of Tennessee in the 1980s, but the state government declined the proposal. See Bowman, Hakim and Seidenstat, eds., Privatizing Correctional Institutions, p. 29. It is on the public agenda once again, at this writing, with support from the governor and many other public officials.
- Charles H. Logan, Private Prisons: Cons and Pros (New York: Oxford University Press, 1990).
- Author's telephone conversation with CCA Program Director, Houston, Texas, March 14, 1995.
- Ibid. For the hidden costs of public corrections, see Charles H. Logan and Bill W. McGriff, "Comparing Costs of Public and Private Prisons: A Case Study," National Institute of Justice, U.S. Department of Justice, No. 216, September/October 1989. See Thomas, Private Adult Correctional Facility Census, pp. vi-viii, for a recent discussion of government reports that private cost savings of 10-20 percent are typical.
- Charles W. Thomas, "Testimony Regarding Correctional Privatization before the Little Hoover Commission," Sacramento, Calif., August 21, 1997; also see Eric Bates, "Private Prisons," The Nation, January 5, 1998, pp. 11-18.
- For example, see Lonn Lanza-Kaduce and Karen F. Parker, "A Comparative Recidivism Analysis of Releasees from Private and Public Prisons in Florida," Private Corrections Project, Center for Studies in Criminology and Law, University of Florida, Gainesville, Fla., mimeo, 1998.
- U.S. General Accounting Office, "Private and Public Prisons: Studies Comparing Operational Costs and/or Quality of Service," GAO/GGD-96-158, a report to the U.S. House of Representatives Subcommittee on Crime, August, 1996.
- Charles W. Thomas, letter to Rep. Bill McCollum, Chair, U.S. House Subcommittee on Crime, September 1, 1996; also see Charles W. Thomas, "Correctional Privatization: The Issues and the Evidence," paper presented at the Privatization of Correctional Services Conference, sponsored by the Fraser Institute, Toronto, Canada, July 10-11, 1996; and Private Adult Correctional Facility Census, 10th ed., Private Corrections Project, Center for Studies in Criminology and Law, University of Florida, Gainesville, Fla., March 15, 1997, pp. vii-viii.
- Richard Moran, "A Third Option: Nonprofit Prisons," New York Times, August 23, 1997.
- Alexis M. Durham, "The Future of Correctional Privatization: Lessons from the Past," in Bowman, Hakim and Seidenstat, eds., Privatizing Correctional Institutions, p. 39.
- Barbara Auerbach, "Federal Government Involvement in Private Sector Partnerships in Prison Industries," in Bowman, Hakim and Seidenstat, eds., Privatizing Correctional Institutions, pp. 91-104.
- Bruce Fein and Edwin Meese III, "Have to Fight Crime within Our Limited Means," Houston Chronicle, May 3, 1989, p. 29A.
- James K. Stewart, Director, National Institute of Justice, U.S. Department of Justice, in a letter to the Wall Street Journal, July 26, 1989.
- See Jack Eckerd, "Responsibility, Love and Privatization: A Businessman's Guide to Criminal Rehabilitation," Policy Review, 45, Summer 1988, p. 52; and Judith Schloegel, "PRIDE of Florida: A Working Model for Inmates," in Bowman, Hakim and Seidenstat, eds., Privatizing Correctional Institutions, pp. 105-11. PRIDE is an acronym for Prison Rehabilitative Industries and Diversified Enterprises.
- Andrew Peyton Thomas, Crime and the Sacking of America (Washington, D.C.: Brassey's, 1994), p. 121.
- American Bar Association's Subcommittee on Correctional Industries, "Inmate Labor in America's Correctional Facilites," discussion draft, April 1998, Executive Summary.
- Ibid., p. 13.
- Prison Industry Enhancement Certification Program, Quarterly Report, American Correctional Association, Laurel, Md., March 1, 1997.
- Business Week, February 17, 1992, p. 42.
- "Governor Praises Heatron, Zephyr," Leavenworth (Kan.) Times, October 7, 1992, p. A1.
- Also see Rod Miller, George E. Sexton and Victor J. Jacobsen, "Making Jails Productive," National Institute of Justice, U.S. Department of Justice, NCJ-132396, October 1991; and "Private Sector Prison Industries" and "Prison-Based Joint Ventures," both by Criminal Justice Associates, Philadelphia, Pa., December 7, 1990.
- For detailed arguments, see Morgan O. Reynolds, "Factories Behind Bars," NCPA Policy Report No. 206, September 1996. Also see "Business and Labor Support for Private Sector Employing Prison Inmates Is Strong in Iowa," press release, April 30, 1997, Enterprise Prison Institute, Washington, D.C.; and Greg Wees, "Prison Industries: Public Agencies and Private Industry Continue to Form Working Partnerships" and "Prison Industries 1997: Outside Federal System, Inmate-Employees Remain an Elite Group," Corrections Compendium, June 1997, pp. 1-4, 10-11; and Inmate Labor in America's Correctional Facilities, a Preliminary Report of the American Bar Association's Subcommittee on Correctional Industries, April 1998.
- For more ideas on privatization, see Morgan O. Reynolds, "Using the Private Sector to Deter Crime," NCPA Policy Report No. 181, March 1994; Bruce L. Benson, Privatization in Criminal Justice: Real Alternatives to Ineffective Big-Government Solutions for Crime Problems, Oakland, Calif.: Independent Institute, forthcoming.
Morgan O. Reynolds, an NCPA Senior Fellow and a professor of economics at Texas A&M University, received his Ph.D. from the University of Wisconsin in 1971. He has published many articles in academic journals, and edited W.H. Hutt: An Economist for the Long Run (1986). He also authored Public Expenditures, Taxes, and the U.S. Distribution of Income (1977); Power and Privilege: Labor Unions in America (1984); Crime by Choice: An Economic Analysis (1985); Making America Poorer: The Cost of Labor Law (1987); and Economics of Labor (1995). He has been a consultant for the National League of Cities, the U.S. Department of Labor and many private organizations. He serves on the boards of the Journal of Labor Research and the Quarterly Journal of Austrian Economics and is a member of the Mont Pelerin Society and a former adjunct scholar with the Cato Institute.