Over the past century, government spending grew to an average of 45 percent of gross domestic product (GDP) among developed countries. These expenditures often are defended on the ground that they make countries more productive and achieve such other social objectives as improving the health and literacy of the population.
In a previous study, the author showed that government spending on such things as roads, education and criminal justice positively affects per capita GDP. But beyond some level – 21 percent of GDP in the United States, for instance – the tax burden necessary to finance this spending slows economic growth and thus reduces per capita GDP below what it otherwise would be. Today, total government spending in the United States and other developed countries far exceeds the level at which it increases national income.
This study examines the effects of government spending on certain noneconomic measures of social progress. It employs a narrow measure of social progress obtained by constructing an index based on literacy, infant mortality and life expectancy plus a broader index that uses 16 social indicators. It includes data on 112 countries collected for 1995.
The central finding is that although government spending has a positive impact on social progress up to a certain level, spending by most developed countries has gone well beyond that point. As a result, there is little difference in social outcomes among these countries, regardless of the amount they spend. Social progress in developed countries that spend less than 40 percent of GDP – the United States, Switzerland, Japan, Australia and New Zealand – is approximately the same as in those with public spending above 50 percent of GDP. Specifically:
- Advanced countries realize no benefit in terms of social progress from government consumption spending beyond $3,650 per person or 18.6 percent of GDP.
- Beyond $1,105 or 5.6 percent of GDP – the optimal level of per capita government consumption spending – each dollar spent buys progressively less additional improvement in social progress.
- Yet some advanced countries are spending as much as $5,308 per capita on government consumption aimed at advancing social progress.
- With the exception of Singapore (and Hong Kong, if the data were available), the world's most developed countries are receiving no gains in social progress at the margin from government spending.
Clearly, there is considerable scope for shrinking the size of the fiscal state without doing harm to social progress. So far, among developed countries only Ireland and New Zealand have made observable progress in shrinking the fiscal state.
- Ireland reduced public spending as a share of GDP from 47.2 percent in 1988 to 40.6 percent in 1989 and has more or less held the line since then.
- New Zealand shrank central government public spending from 40.4 percent of GDP in 1992 to 34.9 percent in 1995.
Other developed countries will face increasing pressure to follow suit as the pool of workers available to support their aging populations shrinks.
[page]1The enormous growth in government spending over the past century was by and large promoted and defended in the name of economic and social progress. While economic progress can be defined as a rise in per capita income or gross domestic product (GDP), social progress, or improvement in the quality of life, usually refers to improvements in physical conditions of life such as life expectancy and infant mortality. A broader notion of social progress could encompass the development of political institutions such as democracy and the rule of law.
"Does government spending improve the quality of life?"
Government Spending and Economic Progress. In a previous NCPA study I showed that government spending can promote economic progress – up to a point.2 Government spending on such things as roads, education and criminal justice positively affects per capita GDP. But beyond some level the tax burden necessary to finance government becomes a drag on economic growth and reduces per capita GDP below what it otherwise would be. By this standard, I found the optimal level of U.S. taxation to be 21 percent of GDP. Yet taxes as a share of GDP have not been in this range since 1949. Had the United States stuck with the 1949 level of taxation, our compound rate of economic growth over the period 1950-95 would have been 4.8 percent, compared to the actual growth rate of 3.4 percent.
Today average government spending in developed countries is 45 percent of GDP. In fact, for decades government spending in almost all developed countries has far exceeded the level at which it increases the rate of economic progress. It continues at levels that reduce growth rates below what they otherwise would be.
Government Spending and Social Progress. This paper examines the effects of government spending on social progress. The spending we are concerned with is government consumption expenditures: the portion of government spending that actually buys goods or services such as school buildings and teachers' salaries. In most countries, this is 40 percent to 60 percent of total government spending. The rest of government expenditures go for transfer payments or payments on government debt. Transfer payments simply redistribute income after it is earned and taxed away by government. Much of the increase in total government spending in developed countries in recent years has been for transfer payments and debt service. But government consumption expenditures have also increased, and even if they remained constant as a portion of GDP the absolute level of government spending has increased as GDP has grown.
It has been assumed that government consumption spending buys goods and services that improve the quality of life. But remarkably, very little is known about what has been achieved for the tax dollars spent. The only paper I have found that addresses quality of life gains from the growth of public spending is a 1995 study by Vito Tanzi and Ludger Schuknecht.3
Tanzi and Schuknecht examined the progress of certain social indicators over more than a century and compared this progress with the growth in public spending. They used noneconomic indicators – such as infant mortality, the death rate and years of primary schooling – as well as economic indicators such as the share of national income going to the lowest 40 percent of all households. They found that as total government spending as a portion of GDP grew from 1870 to 1960, it had a positive effect on economic growth and social progress but "that the growth in spending after 1960 may not have brought about significantly improved economic performance or greater social progress."4
Moreover, they found that in recent years social progress in some newly industrialized economies (Chile, Hong Kong, South Korea and Singapore) and in industrialized countries with governments that spent less than 40 percent of GDP ("small" government countries such as Japan, Switzerland and the United States) is no worse than in countries that spend more than 50 percent of GDP ("big" government countries such as Sweden and the Netherlands) or those that spend 40 to 50 percent of GDP ("medium-sized" government countries such as Canada, Germany and Ireland).
Clear inferences from their paper are that public spending for social progress in industrialized countries has reached a level of diminished returns and that a prudent reduction in the size of government can occur without social harm.5
"At what point does a dollar increase in public spending buy less than an additional dollar's worth of social progress?"
Evaluating the Results of Government Spending. This study examines the effects of government expenditure on certain noneconomic measures of social progress, using 1995 data on 112 countries. It addresses these issues more precisely than Tanzi and Schuknecht by asking and answering two basic questions: (1) at what level of government expenditures per capita does spending cease to have any positive impact (the marginal benefit is zero) and (2) beyond what level of expenditures does spending cease to be worth its cost (the point at which the marginal benefit equals the marginal cost)? The answer to the first question tells us at what level of public spending an increase in expenditures results in no additional improvement in social progress. Hence, any government expenditure beyond this level is unnecessary for advancing the quality of citizens' lives. The answer to the second question tells us at what point a dollar increase in public spending buys an additional dollar's worth of social progress.
Spending above the level at which the marginal benefit is zero is a clear waste of resources. Spending at the level for which the marginal benefit is zero represents the maximum possible social progress. However, that maximum level is not the optimal level because as spending approaches the level at which the marginal benefit to social progress equals zero, we must spend much more than a dollar to achieve a dollar's worth of improvement. The optimal level of government spending is the point at which marginal benefit equals marginal expenditure, where an additional dollar of spending will yield a dollar of social progress.
Three empirical issues need careful handling. First, what is social progress? Second, how much weight should be given to each of the attributes of social progress? And third, how can we avoid bias in measuring social progress?
Issue: Defining Social Progress. Social progress or improvement in the quality of life may be a subjective concept that arises from one person's life experience relative to others. If so, it would be hard to measure. If social progress is treated as an objective concept, as is done here, it involves a finite set of attributes that can be measured and compared across environments and through time.
"This study constructs several indexes to measure social progress."
While per capita gross national product is an obvious choice for a single measure of well-being, it has been criticized as too narrow to capture "basic needs."6 The most widely employed measure of basic needs is the physical quality of life index (PQL), an average of literacy, infant mortality rates and life expectancy. The PQL is one of the aggregate indices of social progress used here. But the PQL index also has been criticized as too narrow in scope to fully capture differences in quality of life. Hence, I have constructed a multidimensional index that contains 16 social progress indicators. Using such a large number of indicators, many of which are intercorrelated, precluded the omission of relevant variables that would significantly affect the results. Income or GDP per person is an important measure of the ability of a society to make expenditures for social progress, but it does not measure social progress per se. Thus it is an input to, rather than an outcome of, social progress. By contrast, the social progress indicators used here measure outcomes.
Issue: Assigning Weights to the Attributes of Social Progress. How much weight should be given to each of the attributes of social progress in constructing an aggregate measure? The conventional practice is to weight them equally. However, while a representative individual might have an equal preference for any or all of the attributes of social progress, it is not likely. And it is not possible to say in advance exactly what the preferences of society are and how much society is willing to pay for them. Accordingly, two other ways to objectively weight the attributes also are employed. Using all three weighting schemes gives some assurance that the results are not distorted by the peculiarities of the weighting method.
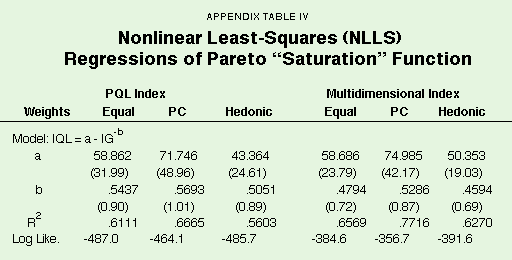
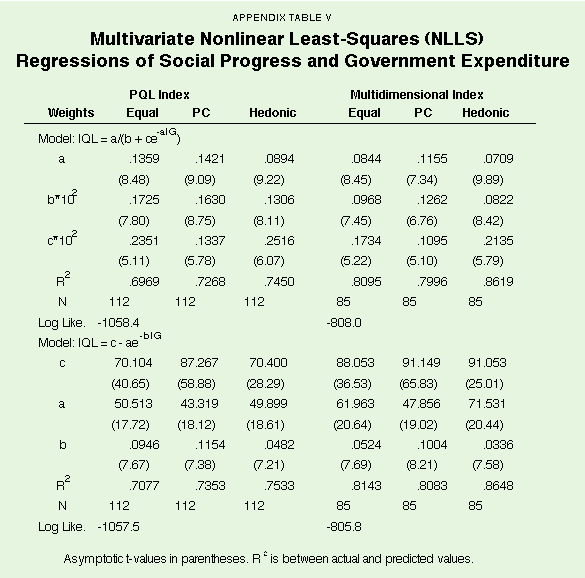
Issue: Avoiding Measurement Bias. Any functional form imposed on the data is arbitrary. To ensure that the empirical results are not largely due to the particular mathematical function used, several nonlinear models were estimated.
In what follows, this paper discusses the attributes of social progress, the optimal levels of government expenditures that were found by performing some statistical tests and the conclusions that can be drawn from the analysis.
[page]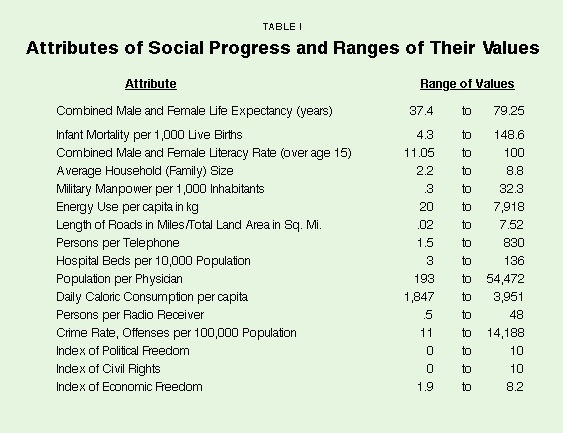
"Literacy, infant mortality and life expectancy comprise the Physical Quality of Life Index."
The first attributes of social progress I use are widely recognized measures of human welfare: literacy, infant mortality and life expectancy. These three attributes make up the Physical Quality of Life index (PQL), a widely accepted index of social progress. Testing the PQL index separately, I am able to compare it to the broader index and to see whether the additional attributes that are included in the multidimensional index add more information. Furthermore, using 1995 data for the PQL index from 112 nations, and data for the other attributes from 85 countries permits confirmation that the results are not skewed by the omission of some countries.7 Including the three PQL attributes in the multidimensional index ensures that the broader index is inclusive. In addition to the three PQL attributes, the multidimensional index includes 11 other attributes chosen by the author and two composite indices – the Index of Economic Freedom and the Freedom House index of political and civil rights.8
The Physical Quality of Life Index. The variables in the PQL index are widely accepted as measures of human welfare. Life expectancy among the 112 countries in the PQL index ranges from 37.4 to 79.25 years, infant mortality from 4.3 per 1,000 live births to 148.6, and the literacy rate from 11.05 to 100 percent.9 [See Table I for the range of values of all 16 attributes.]
The Multidimensional Index of Social Progress. Economist Amartya Sen, among others, has criticized the PQL index as too narrow.10 To more fully capture differences in quality of life across countries, a more multidimensional approach is warranted. To accomplish this, I combined the three attributes from the PQL index with 13 other measures to construct an index with 16 attributes. (For a detailed discussion of the meaningfulness of the attributes, see the author's previous joint research.)11
For example, a fourth attribute is average number of persons per household. Economist Gary Becker has argued that in modern societies children are a consumption good and that as family size shrinks "child quality" is substituted for quantity of children.12 Thus a family with fewer children can make a greater investment of household resources per child and declining household size is an advance in social progress.
A fifth attribute is military manpower per 1,000 inhabitants. While ambiguous as a measure of social progress, since troops can be used to oppress the domestic population, on the whole more troops represent greater protection from external aggression. A sixth attribute is energy use per capita in kilograms. A seventh is miles of road per square mile of land area, an indicator of infrastructure development and facility of physical movement within a country. An eighth is persons per telephone, another indicator of economic development and ease of communication.
"A more multidimensional index contains 16 indicators."
A ninth attribute is hospital beds per 10,000 population and the tenth is population per physician, both indicators of the quality of health care. The eleventh is daily caloric consumption per person, a measure of the food supply. The twelfth is persons per radio receiver, a measure of the extent to which the population can be informed as well as entertained.
Attribute thirteen is the crime rate per 100,000 persons. As long as the ratio of reported to unreported crimes is stable across countries, it is a fairly reliable measure of security of person and property.
Other Indices Used as Attributes. Personal freedom and choice (political, civil and economic) are important attributes of social progress. The Freedom House index of political and civil rights13 measures the extent to which a population is free to choose its leaders and is governed by the rule of law.14
The Index of Economic Freedom attribute is a summary measure from James Gwartney and Robert Lawson.15 This measure is based on an average of up to 17 attributes (including a number of the economic indicators used by Tanzi and Schuknecht): (i) money and inflation (money supply growth, inflation variability, foreign exchange, bank account ownership), (ii) government operations (public consumption share, state enterprise, price controls, business environment, legal system, lack of negative interest rates), (iii) takings (transfers and subsidies, top marginal tax rate, conscription), and (iv) international sector (trade taxes, black market exchange premium, size of trade sector, foreign capital transactions).
"All the indices are highly correlated."
Other Possible Indicators. Perhaps some other attributes such as the female labor force participation rate, unemployment rate, poverty rate or fraction of low-income population might be added.16 But there are real problems with the meaning of some of these attributes and the extent of their coverage. Unemployment and underemployment mean different things in advanced and backward countries; female labor force participation may mean liberation in advanced countries but forced family work in rural, agricultural, less-developed countries. Poverty is difficult to measure since reported income may not measure economic well-being,17 particularly in less-developed countries with large informal sectors and extensive barter systems.
Weighting the Attributes. Although it is standard practice to equally weight the indicators in constructing an aggregate measure of social progress, two objective methods of obtaining different weights are available: weighting by the variances through principal components analysis and weighting by regression coefficients through an instrumental variable or hedonic approach. The latter technique has the virtue of measuring the implicit value assigned to the indicator.18
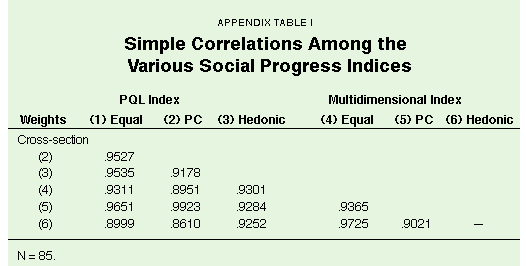
Both the PQL index and the multidimensional indices used here were weighted with equal, principal component and hedonic weights. Thus a total of six indices of social progress were constructed. These indices turn out to be highly but not perfectly intercorrelated. The range in the simple correlations is from .8610 to .9725. [See Appendix Table I.]
[page]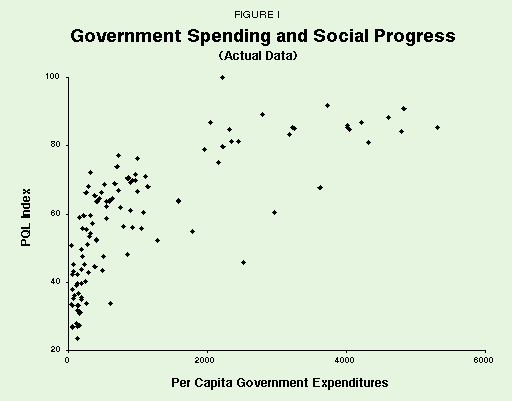
General government consumption is government spending on wages, salaries, materials and supplies; it is the public spending that directly absorbs resources. Such expenditures are usually 40 percent to 60 percent of total government spending; the remainder consists mainly of transfer payments and interest payments on accumulated public debt. (Among the 112 countries in the sample, per capita government consumption spending ranges from $44.80 to $5,307.50 annually.)
"Beyond a certain point, there is strong evidence of diminishing returns to government expenditure."
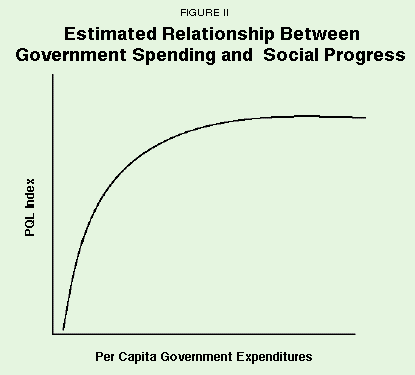
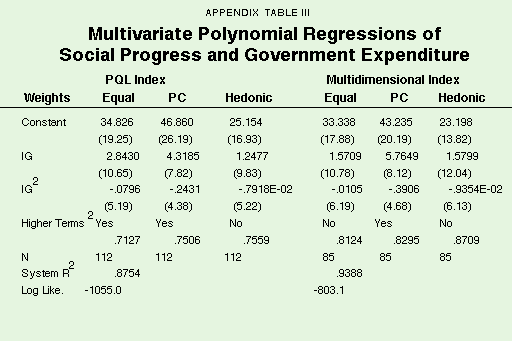
The Relationship between Government Spending and the Quality of Life. As expected, we find increases in social progress as government expenditures increase. But social progress increases at a diminishing rate. [See Appendix for discussion.] There is strong evidence of diminishing returns to government expenditure for both the PQL index and the multidimensional index, no matter which weighting scheme is used. For example, the plot in Figure I of the Physical Quality of Life (PQL) index (equal weights) against per capita expenditures for the 112 nations in the sample clearly shows that the relationship between the PQL index and per capita government expenditure is nonlinear – and thus that the index will increase at a slowing rate as expenditures rise. The estimated relationship is drawn in Figure II. It appears that at a per capita spending level of around $3,000 to $4,400, no further gains in social progress occur. The profile of the data for the PQL index and the other indices seems to indicate a "saturation level" beyond which per capita government consumption expenditures have no effect on social progress. [See Appendix for discussion.]
"Once a country spends about $4,130 per person it derives no further gain from an additional dollar of spending."
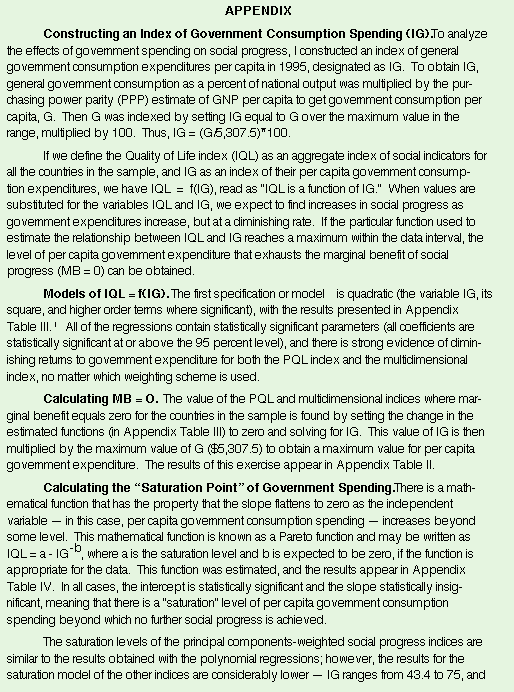
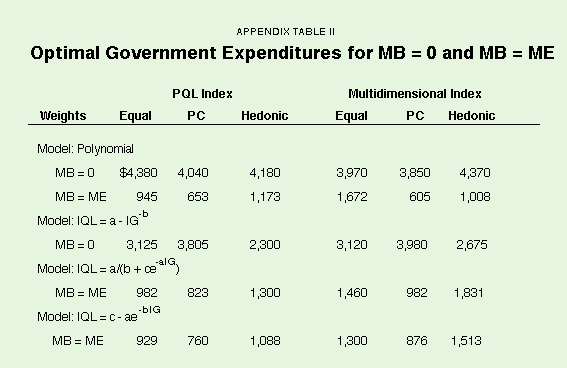
Level of Expenditures at Which There Is No Marginal Benefit. At what level of per capita government expenditures is the marginal benefit of social progress, as measured by these indices, exhausted? In general, the results are not very sensitive to the weighting scheme used in constructing the indices. We find, using a polynomial model, that the level of per capita government expenditures at which the marginal benefit is equal to zero averages about $4,130.19 Based on this estimate:
- At most, a country can spend $4,130 per person on government consumption before it derives no gain in social progress from an additional dollar of spending.
- Countries that spend between $4,130 and the observed maximum of $5,307.50 on government consumption – which includes some of the world's most-developed economies – appear to be wasting up to $1,177.50 per person per year in spending that yields no improvement in social progress.
Of course, many of the countries in the sample are so poor they would have to spend many times their per capita GNP to reach the point at which the marginal benefit is exhausted. For instance, Zambia, with a per capita GDP of about $200, would have to spend 20 times its GDP to achieve parity with the developed nations. (Of course, long before Zambia reached the point of devoting 100 percent of GDP to social progress, it would have raised the tax burden to the point at which economic growth would have ceased!)20 Thus it is more relevant to examine developed countries that are able to spend enough to exhaust the marginal benefit of social progress.
Results for Some High-Income Countries. For each of 22 high-income countries, Table II shows the percentage of GNP per capita that these governments would consume if they were at the average values of MB = 0 and MB = ME obtained above for the 112-country sample.21 The countries are mainly from the Organization for Economic Cooperation and Development and are ordered from high to low 1995 per capita GNP. The table also shows the average for each country of all six indices of social progress (rescaled to be in the interval 0 to 100), government consumption spending and the actual 1995 value of total government outlays as a share of GDP.
The results are consistent with the findings of Tanzi and Schuknecht, and all of these countries have high values for social progress. Japan has the highest value on the social progress index, with a score of 100, and another 10 nations score above 90.22
- Among the most developed, the five "small" government countries with public spending of less than 40 percent of GDP – the United States, Switzerland, Japan, Australia and New Zealand – have an average value on the social progress index of 89.
- This differs little from the average index value of 91.3 for the 10 "big" government nations with public spending above 50 percent of GDP.
- However, except for Singapore (Hong Kong would also be included if the data were available), the fiscal size of government in all these countries is well above the level that causes the marginal benefit of social progress to be zero.23
"The point at which marginal benefit equals zero is different for every country."
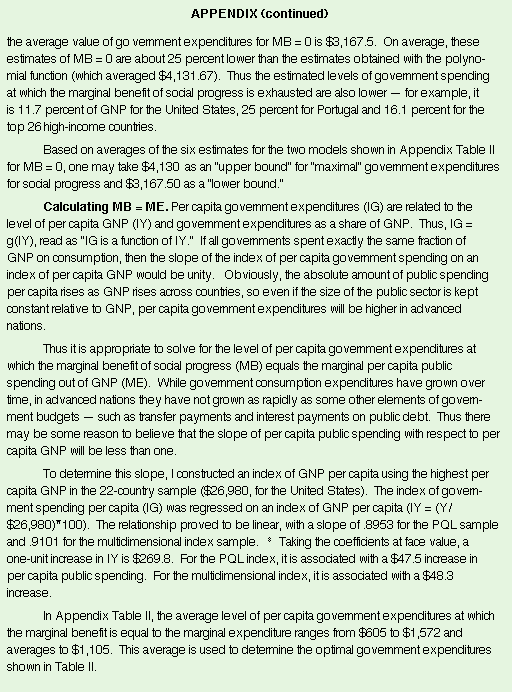
The share of output at which marginal benefit equals zero for government consumption expenditures is different for every country. It ranges from 15.3 percent of GNP for the United States to 32.6 percent for Portugal. Naturally, since GNP per capita declines down the list of countries, "maximal" government spending as a share of GNP rises. Thus, Portugal would have to spend about twice as much in government consumption expenditures to achieve a level of social progress similar to that of the United States. The average value of "maximal" public consumption spending for the top 26 high-income countries of the world is 21.0 percent of GNP.24
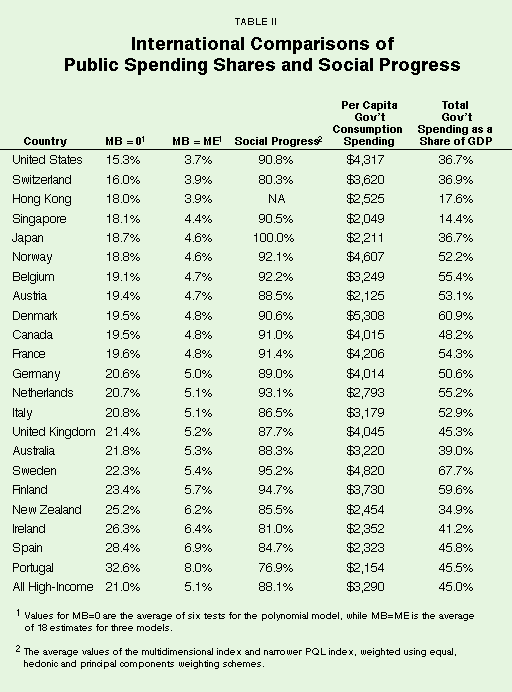
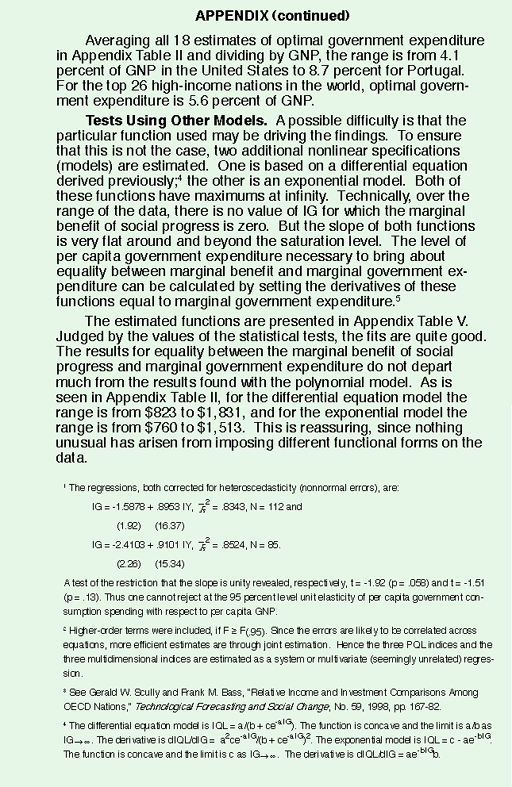
A Dollar's Worth of Progress for a Dollar Spent. More relevant is the level of government expenditure at which the marginal benefit of social progress is equal to the marginal per capita public spending necessary to bring it about. As Table II shows, optimal government consumption spending ranges from a low of 3.7 percent of GNP in the United States to 8.0 percent of GNP in Portugal. For the 26 high-income countries, the average is 5.1 percent of GNP.
Additional specifications were estimated to ensure that these findings are not the result of the particular function used, and nothing unusual was found. [See Appendix for discussion of additional tests.] [page]
Advanced countries can achieve maximum social progress, in the sense of marginal benefit equal to zero, with "maximum" per capita government consumption spending in the range of $3,970 to $4,380 – 20.2 percent to 22.3 percent of GNP, or "minimum" expenditures of $2,300 to $3,980 – 11.7 percent to 20.3 percent of GNP.
Optimal government consumption spending per capita, where the marginal benefit of social progress is equal to marginal government expenditure, is much lower, in the range of $605 to $1,830 or 3.1 percent to 9.3 percent of GNP. Thus:
- Advanced countries do not benefit, in terms of social progress, from government consumption spending beyond $3,650 per person or 18.6 percent of GNP.
- The optimal level of per capita government spending is $1,105 or 5.6 percent of GNP.
- With the exception of Singapore (and Hong Kong, if the data were available), the world's most developed countries receive no gains in social progress for much of the GNP consumed by government.
Therefore, there is considerable scope for shrinking the size of the fiscal state without doing harm to social progress.
"On average, total public spending in the high-income countries is about 45 percent of GDP."
Of course, government is much larger than is necessary to maximize social progress or to spend resources to the point at which the marginal social progress equals the marginal government expenditure necessary to achieve it.25 On average, total public spending in the high-income countries is 45 percent of GDP. Almost all categories of real government budgets have grown, including government consumption, over the last four or five decades. But the high-growth sectors have been transfers and subsidies, social expenditures and interest payments on accumulated public debt.
Many explanations for the growth in the size of government have been offered: Wagner's law or Baumol's disease,26 interest group lobbying, insights from public choice theory and bureaucratic expansionism.27 Whatever the explanation, twenty-first century demographics make its current size unsustainable. Domestic population growth is below (often well below) replacement levels, resulting in aging populations that collect state-sponsored pensions for a long time and use a high fraction of national health resources. As fewer and fewer workers support more of society's members on at least one universal benefit, pressure builds to import more young workers from abroad (immigration on the required scale has implications for national identity), cut universal benefits or make work and investment more attractive by cutting taxes.
"Most developed countries can reduce the size of government with no adverse effects on their standards of living."
Some shrinkage in the size and scope of the fiscal and regulatory state seems inevitable. Appropriately fashioned, such shrinkage will not diminish social progress as measured by the indices constructed here, but redistributing the benefits and costs associated with shrinking the size of government implies considerable political difficulty. Only two governments to date have tackled the problem with some success:
- Ireland reduced public spending as a share of GDP from 47.2 percent in 1988 to 40.6 percent in 1989 and has more or less held the line since then.
- New Zealand shrank central government public spending from 40.4 percent of GDP in 1992 to 34.9 percent in 1995.
- However, the United Kingdom, where public spending was reduced to 40.7 percent of GDP in 1989, has since increased spending to about 45 percent.
Several European nations recently trimmed government expenditures to meet the criteria set by the Maastricht agreement for participation in the European single currency market, but the policy changes are marginal and are not part of long-term strategies to shrink the fiscal size of the states.
And what are the prospects of shrinking the size of the U.S. fiscal state? Citizens hate taxes but appear to love government expenditures more. Both political parties have grasped the reality that to get elected and to stay in office they must cater to the middle class, the largest recipients of public spending. While ideas do matter, rebellion and revolution or crisis are the only sources of dramatic change. The prospects for cutting government expenditure through full or partial privatization of social security, medical savings accounts, school vouchers, curtailment of farm subsidies and other corporate welfare and so on have never been better. Yet politicians and citizens alike prefer tinkering at the margin rather than fundamental reform.
NOTE: Nothing written here should be construed as necessarily reflecting the views of the National Center for Policy Analysis or as an attempt to aid or hinder the passage of any bill before Congress.
[page]- A fuller and more technical version of this paper will appear as Gerald W. Scully, "Government Expenditure and Quality of Life," Public Choice, forthcoming.
- See Gerald W. Scully, "Measuring the Burden of High Taxes," National Center for Policy Analysis, Policy Report No. 215, July 1998.
- Vito Tanzi and Ludger Schuknecht, "The Growth of Government and the Reform of the State in Industrial Countries," IMF Working Paper, 1995, International Monetary Fund, Washington, D.C.
- Tanzi and Schuknecht use the following social indicators: the unemployment rate, infant mortality, the death rate, years of primary schooling, U.N. rank in human development, income share of the lowest 40 percent, illiteracy rate, secondary school enrollment, life expectancy, prisoners per 100,000 population, divorce rate, emigration rate and some economic indicators. Ibid., p. 26.
- Ibid.
- See J. Burkett, "Systematic Influences on the Physical Quality of Life: A Bayesian Analysis of Cross-Sectional Data," Journal of Comparative Economics, 1995, 9, 145-63, and Rati Ram, "International Inequality in the Basic Needs Indicators," Journal of Development Economics, 1982, 10, 113-17.
- The data are contained in George T. Kurian, Illustrated Book of World Rankings 1997 (Armonk, N.Y.: M.E.Sharpe, 1997).
- In order to aggregate indicators that are measured by a variety of units, the indices that are not naturally scaled from 0 to 100 were so scaled. Thus, for attributes where the maximum value represents the highest achievement (e.g., life expectancy), the index was constructed as a ratio of the measured value of the attribute to the maximum value for the attribute in the data set. For attributes where the minimum value represents the highest attainment (e.g., infant mortality), the index was constructed as an inverse ratio of the value of the attribute to the maximum value. Such a scaling makes it possible to aggregate indicators that are measured by a variety of units.
- A literacy rate of 100 percent has to be treated with some caution. Countries define literacy differently (e.g., an ability to read a simple sentence, having attended school). The literacy rate for the United States is given as 95.5 percent. This high percentage is rather hard to believe, given the quality of public schooling. On the basis of a definition of "functional literacy" (e.g., ability to read a bus schedule, fill out an employment application), the literacy rate would be much lower. Moreover, IQ has a mean of 100 and a standard deviation of 15. This means that any population will have two-thirds in the interval 85 to 115 and 95 percent in the interval 70 to 130. It is hard to believe that anyone with an IQ below about 80 points is "functionally literate."
- See Amartya Sen, Commodities and Capabilities (Amsterdam: North-Holland, 1985) and his The Standard of Living (Cambridge: Cambridge University Press, 1987).
- Daniel J. Slottje, Gerald W. Scully, Joseph G. Hirschberg and Kathy J. Hayes, Measuring the Quality of Life Across Countries: A Multidimensional Analysis (Boulder, Colo.: Westview Press, 1991), pp. 24-58.
- Gary S. Becker, A Treatise on the Family (Cambridge: Harvard University Press, 1981). Earlier, Becker solved two important riddles. Beginning about 1870 for the advanced countries, the birth rate began a systematic decline that continues to this day. Less developed countries are now in various stages of a decline in the birth rate. This decline in birth rates is of such magnitude that rather than talk about the doom of a world population explosion and a Malthusian notion of widespread famine as population growth outstrips the food supply, there is talk now of a population implosion (i.e., a shrinkage in population as replacement levels fall below deaths). Demographers had no theory of the change in population growth before Becker provided an economic theory of the decision to have children and how many to have. The second riddle was why in the face of rising real incomes people were choosing to have fewer children. The explanation offered had two parts: (i) as income rises the value of time increases, children are the most time-intensive form of consumption, and people substitute out of time-intensive forms of consumption into less time-intensive forms, and (ii) parents substitute quality for quantity of children (i.e., they invest more resources in the children, now, than in the past). This notion of the substitution of quality for quantity is an early example of hedonic change in goods that make interperiod comparisons of living standards tenuous (e.g., the CD of Ludwig Van Beethoven's Eroica played on a good stereo in 1998 is of rather different sound reproduction quality than on a record played on an RCA Victrola of 1930 vintage, yet both are recording players).
- The various attributes that are used to construct the index of political rights and the index of civil rights are discussed in detail in Gerald W. Scully, Constitutional Environments and Economic Growth (Princeton, N.J.: Princeton University Press, 1992), pp. 106-16.
- These are scaled by Kurian from 0 (best) to 10 (worst), but I have rescaled them from 0 (worst) to 10 (best).
- James D. Gwartney and Robert A. Lawson, Economic Freedom of the World: 1997 Annual Report, Vancouver: The Fraser Institute, 1997, pp. 18-23.
- Some of the attributes capture income distribution effects. To verify this statement, the 12 indicators, IA1 to IA12, were correlated with three measures that capture some dimension of the income distribution. These measures are the human suffering index (Kurian, Illustrated Book of World Rankings 1997, pp. 375-76); poverty measured by the percent of people living on less than $1 (valued by the Purchasing Power Parity method) a day (World Development Report, 1997, pp. 214-15); and an Atkinson inequality index (aversion parameter equal to .95) (Scully, Constitutional Environments and Economic Growth, pp. 197-99). All 12 indicators are significantly (95 percent level) correlated with the human suffering index (N = 103), with a range from -.34 (IA5) to -.91 (IA8). Eleven of the 12 attributes are significantly correlated with the poverty measure (N = 53), with a range from -.28 (IA4) to -.62 (IA1). Nine indicators are correlated with the inequality index (N = 62), with a range from -.38 (IA9) to -.56 (IA4). The poverty and suffering indexes are significantly correlated (r = .62, N = 52), as are the suffering and inequality indexes (r = .49, N = 62). But the poverty and inequality indexes are not significantly correlated with each other (r = .07, N = 31).
The significant link between political, civil, and economic liberty and income inequality (more freedom, more equality of income) has been shown before (Ibid, pp. 184-99).
The attributes also are correlated with per capita GNP (PPP). For the 12 attributes (N = 112), the correlations range from .31 (A5) to .94 (A8). For the other attributes (N = 85), there is an inverse correlation with the crime rate (A13) of -.30, and positive correlations with political (A14) and civil (A15) rights of .63 and .72, respectively. The index of economic rights, which captures a variety of institutional and policy matters, has a correlation coefficient of .65 with per capita GNP.
- For instance, consumption by United States households in the lowest 20 percent of the income distribution averaged $13,957 in 1993, while their income averaged only $6,395. Unreported income, noncash benefits and spending out of household wealth are some of the reasons the poor can consume more than their reported income. See "Consumer Expenditures in 1993," U.S. Department of Labor, Bureau of Labor Statistics Report 885, December 1994; cited in Bruce Bartlett, "How Poor Are the Poor?" National Center for Policy Analysis, Brief Analysis No. 185, October 25, 1995.
- Principal components analysis measures the amount of independence in a group of variables. The original data, X, is transformed into a new data set, Z, where the variables are pairwise uncorrelated. Hence Z = XA, and A'X'XA = D(li), where D(li) is the diagonal matrix of eigenvalues, which represent the variances of the Z matrix. Specifically, li/Sli = Pi is the proportional contribution of each of the principal components to the total variation in the X matrix, and SPi = 1.
For the hedonic estimation, real GNP (PPP, purchasing power parity adjusted) per capita was used as the instrumental variable. Thus, the regression IY = b0 + Sbi IA + e was estimated, and the bi's were normalized to sum to unity.
For a more detailed analysis of the methodology of constructing aggregate indexes with principal component and hedonic weights, see D.J. Slottje, G.W. Scully, J.G. Hirschberg and K.J. Hayes, Measuring the Quality of Life Across Countries (Boulder, Colo.: Westview Press, 1991), pp. 59- 67, and Scully, Constitutional Environments and Economic Growth, pp. 120-27, 130-31.
- The range of "maximal" estimates is from 72.5 to 82.5 percent of the observed maximum government expenditure per person of $5,307.5.
- It is outside the scope of this paper, but some developing countries have experienced negative economic growth since the 1960s. They are able to get by for the time being due to unreported black market activity, foreign aid from wealthy welfare states and by consuming their capital stock. As a consequence, those countries have made very little social progress, in a few, conditions have worsened.
- The percentages were obtained by dividing GNP per capita by the average of the six estimates for the polynomial model of MB=0, and all 18 estimates of MB=ME, in Appendix Table II. Government expenditures are usually expressed as a share of gross domestic product (GDP). Until the 1980s national production of goods and services, or gross national product (GNP), included some items that represented foreign wealth. This was altered to GDP to reflect more accurately wealth generated domestically. GNP and GDP figures differ slightly, but not enough to create a serious distortion.
- Tanzi and Schuknecht include Chile and Korea as nations that have achieved a high level of social progress with comparatively small fiscal governments. In 1995, government expenditures as shares of GDP were 19.2 and 20.4 percent, respectively. The value of the average of the six indexes of social progress is 66.3 for Chile and 70.5 for Korea. For the narrower PQL index (equal weights), the value is 70.3 for Chile and 68.1 for Korea. Singapore has a PQL value of 86.8.
- It is likely that Hong Kong would also have a high value of social progress, had the data been available to calculate the indices.
- For nations farther down the ranks of per capita GNP, social progress indicators are so low that those nations would have to spend more than their entire GNP annually in order to reach MB=0. Note that 22 countries are chosen for the sample in this paper, but 26 countries are used in this calculation.
- James Gwartney, Robert Lawson, and Randall Holcombe in "The Size and Functions of Government and Economic Growth," Joint Economic Committee, Washington, D.C., April, 1998, pp. 24-26 have estimated "core" government expenditures as a fraction of GDP for several advanced nations. These core functions are expenditures related to the protection of persons and property, national defense, education, monetary stability and physical infrastructure. The range in the estimated core functions is from 9.1 percent for Germany to 13.8 percent for the United States, with an average value of 11.9 percent.
- William J. Baumol, "Macroeconomics of Unbalanced Growth: The Anatomy of Urban Crisis," American Economic Review, 1967, 57, 415-26.
- William A. Niskanen, Jr., Bureaucracy and Representative Government (Chicago: Aldens and Atherton, 1971).
Gerald W. Scully is a Senior Fellow of the National Center for Policy Analysis and a professor of economics in the School of Management at the University of Texas at Dallas. His articles have appeared in the American Economic Review, the Journal of Political Economy, the Journal of Law and Economics, Public Choice and other scholarly journals. Dr. Scully is also an expert on the economics of sports. His most recent book is The Market Structure of Sports.