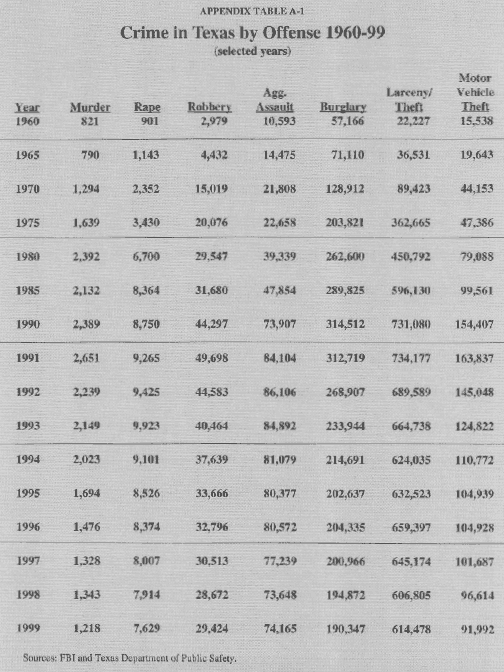
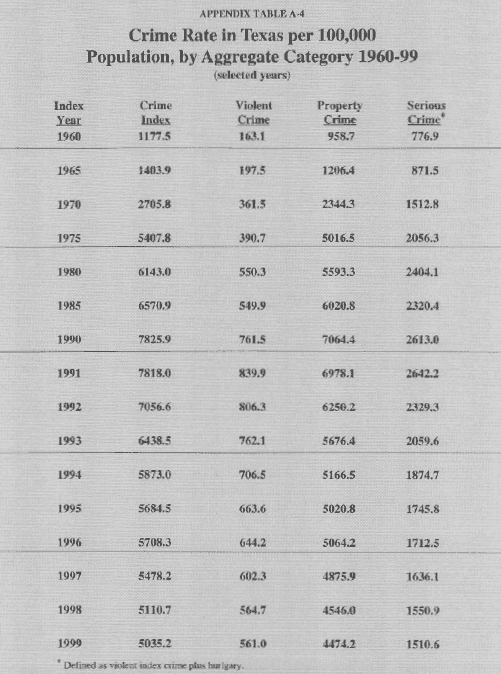
Texas' criminal justice system has been undeservedly criticized, partly for political reasons – the governor is a presidential candidate – and partly by those who oppose the state's whole approach to crime and punishment, particularly on such issues as the death penalty and the right of qualified citizens to carry concealed weapons. Although many of these critics maintain that Texas has the wrong approach to criminal justice, crime fell sharply in Texas during the 1990s.
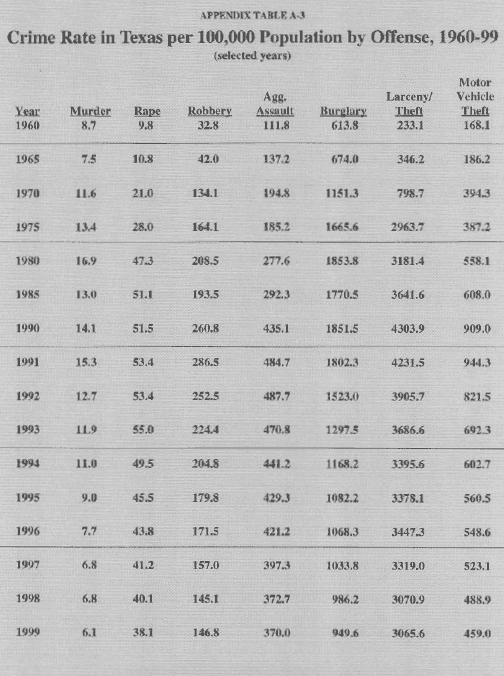
- The murder rate is now the lowest since the 1950s.
- In 1999 alone, the murder rate fell 10 percent.
- The burglary rate is the lowest since 1968.
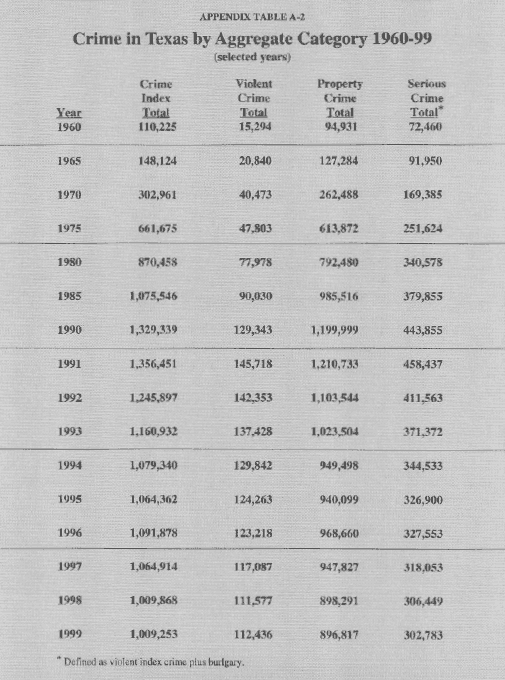
The overall rate for what are known as index crimes (seven violent and property crimes reported to the police) fell 37 percent in the '90s, and Texas achieved its lowest overall crime rate since 1974.
While crime has been on the decline across the nation, Texas crime declined more rapidly than U.S. crime during the 1990s. Overall crime in Texas was 34 percent higher than the national average in 1990, but only 17 percent higher by 1999. Every serious crime except aggravated assault declined more sharply in Texas than in the nation.
These changes reflect real improvements in public safety, not just statistical changes. The pair of crimes most reliably reported – murder and motor vehicle theft – fell by the largest amounts, 57 percent and 50 percent respectively, in Texas in the 1990s. Supporting this conclusion, a national survey that ranked Texas the sixth most dangerous state in 1993 currently ranks it 17th.
Still, the battle against crime in Texas has not been completely won.
- Each year more than 220,000 Texans are victims of violent crimes, of which only half are reported to the police.
- About 2 million are victims of property crimes.
- Although the state's index crime rate was below the national average in 1975, today it is 17 percent above the national average.
- The state's murder rate was still the 18th highest in the nation in 1998.
In 1980, when the nation's crime rate was the highest ever recorded, Texas had half again as many prisoners as a share of the state's total population as did the nation, and the state's crime rate matched the national average. During the 1980s, federal court orders to end prison crowding, combined with a tight-fisted legislature, resulted in no growth in imprisonment and a shortage of prison capacity. By 1990, inmates were serving less than 20 percent of their sentences. Thirty thousand state prisoners were backed up in county jails. The ratio of prisoners to state population had slumped to 5 percent below the national average and the serious crime rate had climbed to 38 percent above the national average.
Something had to be done – and it was. Voters approved two prison bond issues, and the subsequent building boom nearly tripled the number of prison beds to 150,000. The ratio of prisoners to state population rose 143 percent during the 1990s and now is 50 percent higher than the national rate. Serious violent offenders today serve three-quarters of their sentences instead of 30 percent.
In a dramatic turnaround, during the 1990s the serious crime rate in Texas dropped faster than that of the nation as a whole. The tougher prison policies played an important role in this drop. Nationwide, it's been called the "Texas solution." Texas now has more criminals under state supervision each day – in prison, a state jail or on probation or parole – than any other state.
- One of every 98 adult Texans is locked up in a state prison or jail.
- Texas also has more adults on probation or parole than any other state, with one in 26 adults under such supervision.
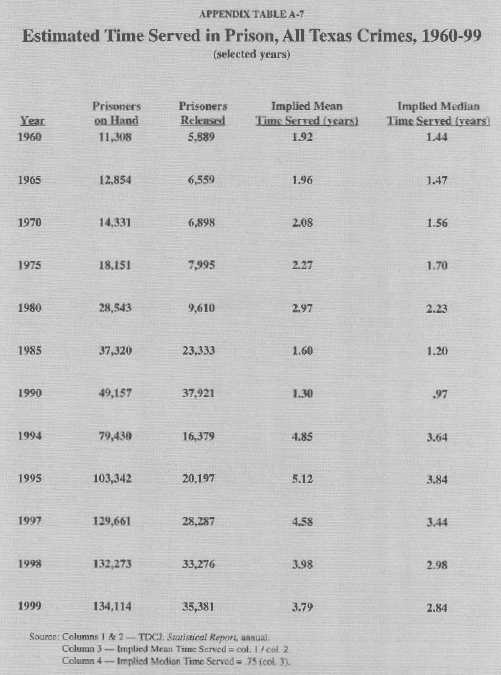
The prison expansion slowed the prison "revolving door" to a crawl. The estimated median time actually served behind bars tripled during the 1990s, driven primarily by an extremely low release rate.
- Historically, the Board of Pardons and Paroles has granted parole to about one in four eligible cases before it.
- In 1990, however, the approval rate had soared to 80 percent.
- Recently, the approval rate has dropped to 20 percent, below historic levels.
Some have questioned the cause-and-effect relationship between greater imprisonment and the reduction in crime, yet there is a wealth of evidence that punishment deters crime.
During the late 1980s and 1990s, the number of police increased sharply. The proportion of violent crimes cleared by arrests increased, the proportion of property crimes cleared by arrests remained constant and the adult drug arrest rate increased 33 percent. More importantly, the probability of going to a state lockup after arrest increased, as did the length of time served in prison. All these factors increased the expected punishment – the prison time one can expect to serve, given the probability of arrest, prosecution, conviction and sentencing – substantially for serious crime.
- From 1990 to 1999, expected punishment rose 213 percent for murder and 243 percent for rape.
- It rose 300 percent for aggravated assault, 189 percent for robbery and 40 percent for burglary.
- Expected punishments now are far higher than they were in 1960, a relatively tranquil period for criminal activity.
From the mid-1980s to the mid-1990s, serious youth crime nearly doubled while adult crime rose only 25 percent. George W. Bush campaigned for governor in 1994 on a theme of getting tough with juvenile criminals. Beginning in 1995, the state's juvenile justice code was overhauled and secure youth facilities were expanded. The result has been a turnaround in juvenile crime, which peaked in 1996 and has declined nearly 20 percent since then. Since 1995 the number of youths annually committed to Texas Youth Commission facilities has risen 51 percent and time served has increased about 50 percent for the average offender.
Contrary to what many experts claim, get-tough policies are popular not just because they feel good but because they are effective. In accord with common sense, the experience of Texas supports the proposition that prison works, especially long prison stays for violent criminals.
The probability of going to prison for a crime did not increase much in Texas during the 1990s. Yet many studies find that increases in the certainty of prison has twice the impact on crime of a similar increase in the severity of punishment. These facts suggest that future efforts toward crime reduction should shift toward increasing the probability of punishment and doing a better job with criminals while they are behind bars.
[page]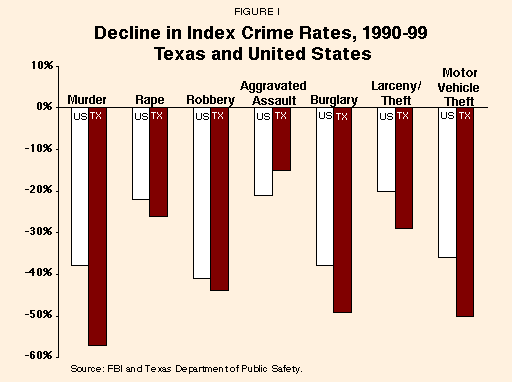
After The Simpsons ran its "Who Shot Mr. Burns?" episode, baby Maggie was revealed as the assailant. Worried question: "They don't execute babies, do they?" Answer: "No. Well…maybe in Texas."
"The overall crime rate in Texas now is the lowest since 1974."
Such is the harsh image of Texas justice, whether deserved or not. True, Texas executes more murderers than any other state – 35 last year – but the furor over Texas' resolute use of the death penalty for capital crimes sometimes obscures the rapidly falling general crime rate in the state over the past decade.
During the 1980s Texas suffered an increase of 29 percent in the rate of serious crime, while the rate in the United States as a whole declined by 4 percent. But the outlook for law-abiding citizens in Texas improved dramatically during the 1990s:1
- After peaking at 8 index crimes (murder, rape, robbery, aggravated assault, burglary, larceny/theft and motor vehicle theft) for every 100 people in 1988 (42 percent above the national average), the Texas crime rate has plummeted by 37 percent, to five crimes for every 100 people in 1999 (still 17 percent above the national average).2
- The overall crime rate in Texas now is the lowest since 1974.
- The murder rate is the lowest since the 1950s.
- The burglary rate is the lowest since 1968.
Crime has fallen sharply in the big cities, too:
- Index crime between 1991 and 1998 fell 39 percent in Dallas, 36 percent in Houston and 44 percent in San Antonio.
- Violent index crime (murder, rape, robbery and aggravated assault) fell 44 percent in Dallas, 32 percent in Houston and 44 percent in Dallas compared to 33 percent across the state and 30 percent in the nation.
- In 1999 alone, murders declined by 24 percent in Dallas and 11 percent in the largest Texas cities, compared to 8 percent nationally.
As Figure I shows, Texas crime rates declined more rapidly than U.S. crime rates between 1990 and 1999:
- Overall index crime rates in Texas were 34 percent higher than national rates in 1990 but only 17 percent higher by 1999.
- Each index crime except aggravated assault declined more sharply in Texas than in the nation, led by a decline in the murder rate from 50 percent above the national average in 1990 to 5 percent higher in 1999.
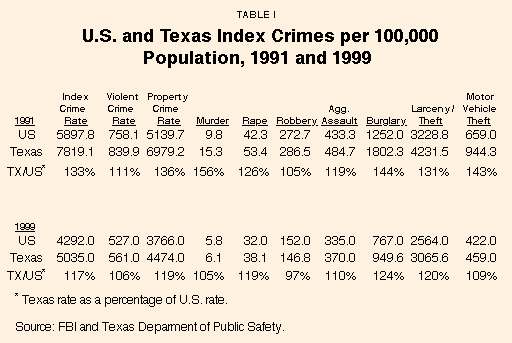
The overall rate of violence in Texas is 6 percent above the national rate; Texas has a lower robbery rate, but higher rates of murder, rape and assault. The Texas property crime rate is 19 percent higher than the national rate.
"Over the past decade, the Texas crime rate fell by more than one-third."
The declines in crime rates are not mere statistical illusions. They reflect very real improvements in public safety. The number of murders reported is generally conceded to be accurate. So is the number of motor vehicle thefts because cars and trucks are relatively expensive, insured items. During the 1990s these two "best-reported crimes" fell by the largest amounts, murder by 57 percent and motor vehicle theft by 50 percent. Further, although many crimes are not reported to the police, the National Crime Victimization Survey shows that the reporting rates have been gradually creeping upward (up 20 percent since 1973), and better performance by the criminal justice system has stimulated even more reporting. Thus the decline in total crime, considering both crimes reported to the police and those not reported, may actually be even greater than the statistics indicate.
"The overall Texas crime rate is still 17 percent above the national average."
Texans can take some satisfaction in this achievement. Compared to 1991 crime rates (even higher than 1990 rates), the lower rates mean that 1,800 fewer Texans will be murdered this year and 535,000 fewer violent crimes and crimes against property will be reported to the police.
Not that the battle against crime has been completely won:
- Every year, more than 220,000 Texans are victims of violent crimes, of which only 112,000 are reported to the police.
- About 2 million Texans each year are victims of property crimes: burglary, larceny/theft and arson.
- On an average day in Texas, 4 murders, 122 rapes, 80 robberies and 206 life-threatening assaults are reported to the police.
- A car is stolen every 5 minutes and a burglary is committed every 2.7 minutes.3
- Although the state's index crime rate was below the national average in 1975, today it is 17 percent above the national average, as shown in Table I.
- The state's murder rate was still the 18th highest in the nation in 1998.
- Based on six weighted crime rates, Texas was rated the 17th most dangerous state in which to live in 2000 by Morgan Quitno Press of Lawrence, Kan., a company specializing in state and statistical rankings; this was a substantial improvement from sixth most dangerous in 1993.4
More than one of every three crimes is committed by criminals already under government "supervision" – either on probation, parole or pretrial release-and Texas has more probationers and parolees under supervision outside prisons than any other state.5
[page]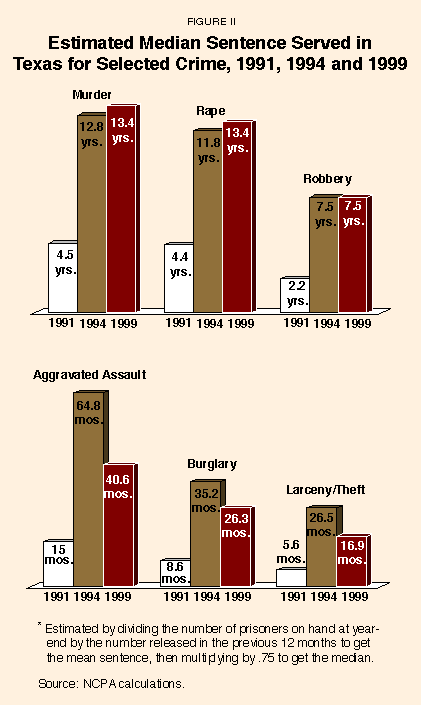
The Texas crime statistics tell an amazing story about the ability of punishment, even of a mild variety, to reduce crime. It's almost a controlled experiment in the efficacy of incarceration and punishment.
As the 1980s ended, Texas faced a crisis because crime had exploded. Places like Texas – which has a long border with Mexico, a Sunbelt location, soaring growth and a high-minority, high-mobility, younger-than-average population – have lots of rough-and-tumble people and high crime rates. Texas is not Vermont or Switzerland. In 1980, when the nation's crime rate was the highest ever recorded, Texas had half again as many prisoners as a share of the state's total population as did the nation, while the serious crime rate in Texas was average.
"In the early 1990's Texas nearly tripled the number of prison beds."
But during the 1980s, federal court orders to end prison overcrowding, combined with a tight-fisted legislature, resulted in no growth in imprisonment and a severe shortage of prison capacity. By 1990, inmates were serving less than 20 percent of their sentences. Thirty thousand state prisoners were backed up in county jails. The ratio of prisoners to state population had slumped to 5 percent below the national average and – no surprise – the serious crime rate had climbed to 33 percent above the national average.
Turning Things Around. Something had to be done – and it was. Voters overwhelmingly approved prison bond issues in 1989 and 1991. The subsequent building boom nearly tripled the number of prison beds to 150,000. In a dramatic turnaround, the 1990s saw the serious crime rate in Texas drop faster than in the nation as a whole. Data through 1999 show that the rate of violent crime – murder, rape, robbery and aggravated assault – and burglary dropped 42 percent in Texas, compared to 34 percent in the nation. Much of the overall drop in serious crime can be traced to reductions in the rates of murders, robberies and burglaries. During the 1990s, as Figure I shows:
- The murder rate fell by 57 percent in Texas, compared to 38 percent nationally.
- The rape rate fell by 26 percent, compared to 22 percent nationally.
- The robbery rate fell by 44 percent, compared to 41 percent nationally.
- The burglary rate fell by 48 percent, compared to 38 percent nationally.
- However, aggravated assault fell by only 15 percent, compared to 21 percent nationally.
Why did the rate of serious crime decrease so fast in Texas? Certainly a strong case can be made that tougher policies toward criminals played an important part. More people went to prison and stayed there longer.
- Texas had 704 prisoners per 100,000 population in 1999, compared to 290 per 100,000 in 1990, a 143 percent increase in imprisonment.6
- Texas' imprisonment rate is 50 percent above the national rate of 468 and second in the nation to Louisiana.
- Serious violent offenders released in 1998 served 74 percent of their sentences, compared to only 30 percent in 1990.
- The state now mandates that convicts serve a minimum of 50 percent of their sentences.
- Assuming continuation of present release policies, serious violent offenders will serve over 90 percent of their sentences in the future, according to the state government's Criminal Justice Policy Council.7
"In response, the Texas crime rate dropped 50 percent faster that for the nation as a whole."
The Texas Prison Boom. The big declines in crime suggest that incapacitation and punishment work. Among all the tools available to combat crime, the only dramatic change in the state has been the ability of government to imprison criminals (the state's crime code was also overhauled in 1993). Nationwide, it's been called the "Texas solution."8
- In September 1990, Texas prisons had a design capacity of 49,000.
- With the completion of the construction program in December 1995, the design capacity had increased to 150,000.
"The estimated median time served tripled between 1991 and 1999."
The prison-building surge raised the Texas prison population per 100,000 citizens from average among the states to the second highest in the nation.9 What had been a 30,000-prisoner backlog in county jails changed to a surplus of 10,000 beds.10 County jails now recruit paying tenants from out of state (a program dubbed "rent-a-cell" by some) and house some 12,000 contract prisoners.11
One consequence of the expansion of prison capacity is that Texas now has more criminals under state supervision each day – in prison, a state jail or on probation or parole – than any other state:12
- Currently, one of every 98 adult Texans (146,180) is in a state lockup – not in a county jail, not on probation or parole, but in a Texas Department of Criminal Justice unit.13
- Texas also has the largest number of adults on probation and parole, with more than 556,410 under such supervision, followed by California with 446,460.
- At the end of 1999, one of every 26 adult Texans was on probation or parole.
"Texas now has more criminals in prison, in a state jail, or on probation or parole than any other state."
Effects on Prison Time Served. The expansion of prison capacity has had an effect. Perhaps the most important change was that people convicted began serving substantial prison time for every crime-the revolving door slowed to a crawl.
- The percent of sentence actually served in prison was 18.7 percent for all inmates released in 1991, but 50.4 percent for those released in 1998.14
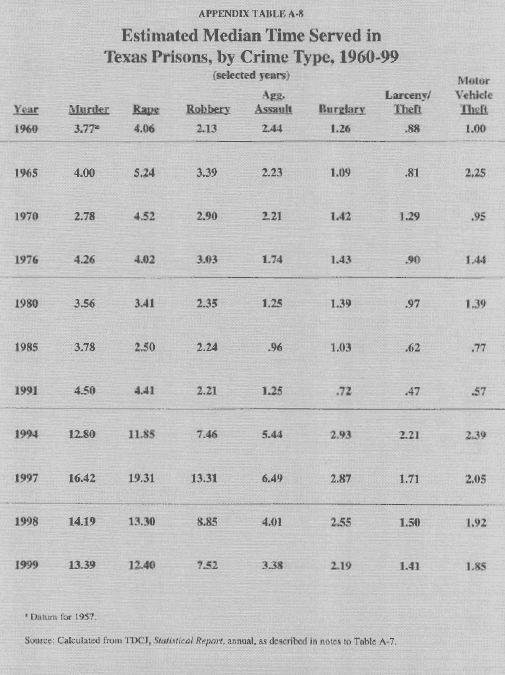
- As Figure II shows, the estimated median time actually served by all inmates convicted of violent crimes and burglary tripled between 1991 and 1999.15
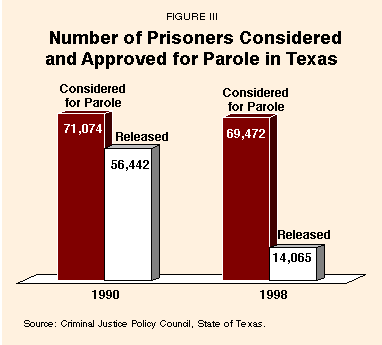
One reason why prisoners are spending more time in prison is that far fewer prisoners considered for parole are actually paroled. Figure III compares parole approval in 1991 with 1998.
- Of 71,074 prisoners considered in 1990, 56,442, or 79.4 percent, were paroled.
- Of 69,472 considered in 1998, only 14,065, or 20.2 percent, received approval.
- The parole approval rate for serious violent criminals was even lower at 8 percent in 1998.
"Parole approval fell from 79 percent in 1990 to 20 percent in 1998."
Historically, the Board of Pardons and Paroles has granted paroles to about 25 percent of eligible cases that came before it. But under pressure of federal lawsuits over prison crowding, the board increased its approval rate to 79 percent in 1990, releasing more prisoners than it kept behind bars. With the new prison capacity and tougher sentencing laws, approval rates have fallen below historic levels.16
Debate Over the Results. The state government's criminal justice research agency, the Criminal Justice Policy Council, has questioned the cause-and-effect relationship between greater imprisonment and the reduction in crime. In an October 1995 report, the council labeled Texas "the most punitive state in the country," suggesting that "the case for more incarceration…made on the basis crime reduction" is weak.17 "Texas continues to have one of the highest crime rates in the nation," Dr. Tony Fabelo, the executive director, wrote, "in spite of a dramatic increase in the incarceration rate." Dr. Fabelo argued that "most offenders are incarcerated after their criminal career has peaked, limiting the impact of more incarceration on the crime rate." He speculated that "perhaps funding meaningfully early interventions in the juvenile justice system…will achieve better returns on lowering crime for each new dollar spent."18
That conclusion seemed to contradict the council's opinion, expressed only 10 months earlier, which praised expanded prison capacity. At that time Dr. Fabelo wrote, "Policies adopted by the legislature since 1987 are having a positive outcome in reducing crime, increasing time served in prison for violent offenders and providing adequate correctional capacity to meet demands for tougher penalties."19
Of course, reducing the crime rate is not the only reason for punishing those who commit crimes. There is a powerful feeling in society that predators and other criminals should be punished on principle. Law is an entirely appropriate instrument of organized retribution. There is strong evidence that tougher policies on crime have produced much larger gains in public safety than Dr. Fabelo and the Criminal Justice Policy Council admit. By contrast, while the rehabilitation and prevention strategies he proposes may appeal to our best instincts, the evidence for their success has been meager.20
Faced with the familiar problem of too many prisoners compared to cells again, the Texas Pardons and Parole Board is researching better ways to evaluate nonviolent inmates so that a greater percentage may be paroled. Sen. John Whitmire, a Houston Democrat who serves on the Senate Criminal Justice Committee, is calling on the parole board to go slower on returning parolees to prison for minor violations of the conditions of their release.21 Parole decisions are discretionary today instead of compulsory and have not been capacity-driven since the early 1990s. Arguably, conditions for nonviolent offenders to gain release from Texas prisons are too restrictive now; this is discussed further below.22
How does the expansion of prison capacity affect the decisions of people who are considering committing a crime? And how do we know that the increased risk of imprisonment has not been offset by some other change? To answer these questions, we need a full accounting of all of the factors that affect the "expected punishment" for committing a crime.
[page]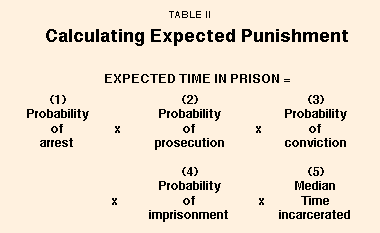
"For many people, the benefits of committing a crime outweigh the cost."
Most crimes are not heedless, irrational acts. Instead, they are committed by people who respond to incentives and at least implicitly compare the expected benefits with the expected costs, including the costs of being caught and punished. The reason we have so much crime is that, for many people, the benefits outweigh the costs – making crime more attractive than other career options.
It is virtually impossible to prevent people from committing crimes. What the criminal justice system does is construct a list of "prices" or disincentives (expected punishments) for various criminal acts. People commit crimes as long as they are willing to risk paying the possible price society might charge, just as many of us might risk a parking or speeding ticket by disobeying traffic laws.
Because criminals and potential criminals rarely have accurate information about the probabilities of arrest, conviction and imprisonment, their personal assessments of the expected punishments vary widely. Some overestimate their probability of success, while others underestimate it. More experienced and intelligent criminals face better odds of getting away with their crimes. Despite the element of subjectivity, if crime becomes cheaper (the expected cost of crime to perpetrators falls), crime increases and vice versa.23 This theory is consistent with public opinion24 and with the perceptions of potential criminals.25 And it is supported by considerable statistical evidence.26
How Expected Punishment Is Calculated. Four adverse events must occur before a criminal ends up in prison.27 The criminal must be arrested, prosecuted, convicted and sentenced to prison. As a result, the expected punishment for crime depends on a number of conditional probabilities: the probability of the crime coming to the attention of the police, the probability of being arrested for a crime after it is committed, the probability of being prosecuted after an arrest, the probability of pleading guilty or being convicted if prosecuted and the probability of going to prison if convicted.
"Expected punishment is not the length of time convicted criminals actually stay in prison."
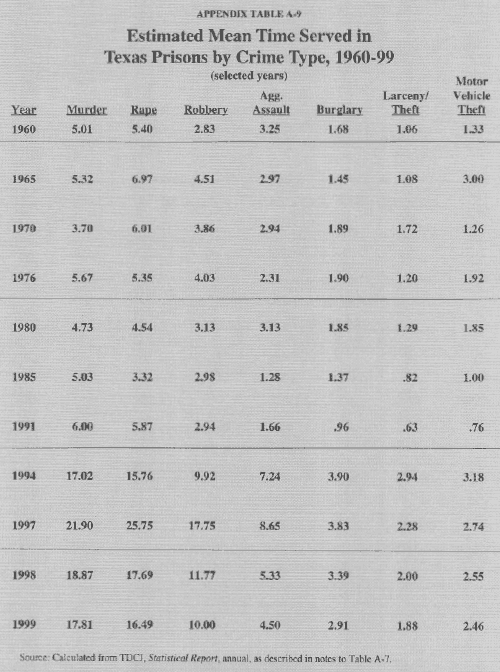
As Table II shows, expected punishment is the result of multiplying these four probabilities and then multiplying by the average or median time served. Even if each of the separate probabilities is reasonably high, their product can be quite low. Suppose, for example, that each is one-half. In other words, one-half of all crimes result in an arrest, one-half of all arrests lead to prosecution, one-half of all prosecutions produce a conviction and one-half of all convictions mean a prison sentence. The overall probability that a criminal will spend time in prison is only 6.25 percent (0.5 x 0.5 x 0.5 x 0.5 = 0.0625).
"It is the average time spent in prison per crime committed in the state."
Expected punishment is not the length of time convicted criminals actually stay in prison; nonviolent Texas offenders released in 1998 served an average of three years and aggravated violent offenders released in 1998 served an average of seven years.28 To reiterate, expected punishment has to do with probabilities in addition to time served and takes into account that 98 percent of all index crimes in Texas do not result in any prison time.29 Expected punishment shows the imprisonment odds and anticipated time served by criminals, just as an actuarial table might show mortality rates for a population (probabilities of death) and be used by an insurance company to calculate expected losses from paying off its policies.30
"The probability of arrest for violent crimes went from 39 percent to 43 percent during the decade."
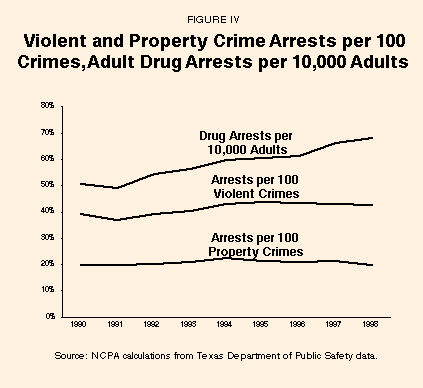
The Probability of Arrest. Figure IV shows arrest rates for violent, property and drug crimes in Texas during the 1990s.31 Arrests for violent crimes rose slightly relative to the number of violent crimes reported to the police, from 39 percent to 43 percent during the decade, worsening the odds for violent criminals.32 Arrests for index property crimes, on the other hand, stayed relatively constant at about 20 percent of reported property crimes. The adult drug arrest rate per 10,000 adults rose a robust one-third, suggesting more drug distribution and use, dumber drug offenders who got caught more often and/or increased police resources devoted to the war on drugs.
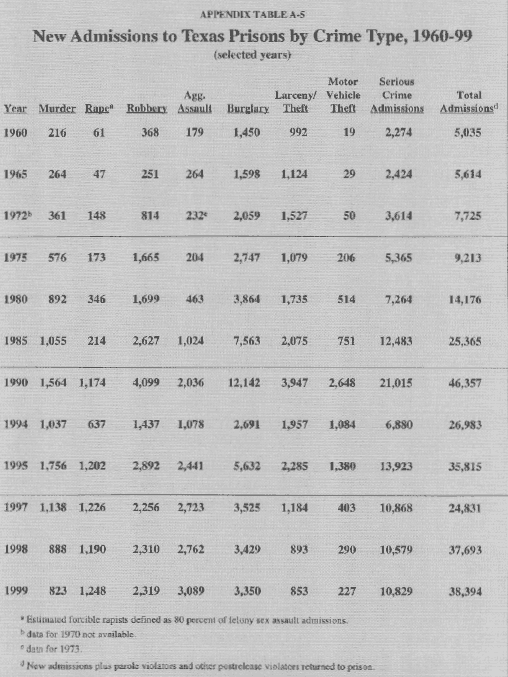
The Probability of Going to Prison. The probability of going to prison or a state jail after arrest for a serious crime increased during the 1990s. For violent crimes, 36 percent of arrests resulted in a prison admission in 1998, up from only 30 percent in 1990. Still, police in Texas arrested 28,000 people for violent crimes in 1998, while only 10,094 – 36 percent of those arrested – went to prison. That means 64 out of every 100 people arrested for crimes of violence served no time in a state lockup.33 Police made a total of 206,481 arrests on all violent, property and drug charges combined in 1998, resulting in prison and state jail admissions of 46,550, an overall imprisonment rate of 22.5 percent of arrests, up from 20.0 percent in 1990. Net result? More people arrested for major crimes today go to prison and stay there longer, boosting expected punishment dramatically.
"The expected punishment for murder is 9.1 years."
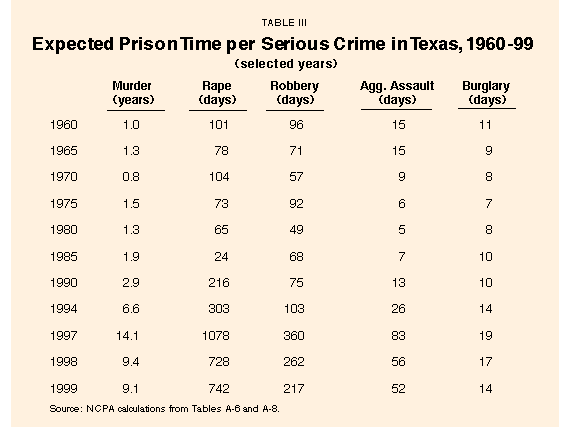
Expected Punishment in Texas. A comparison of Figure II and Table III shows by offense the differences between the median time actually served in prison and the expected punishment at the time a crime is committed:34
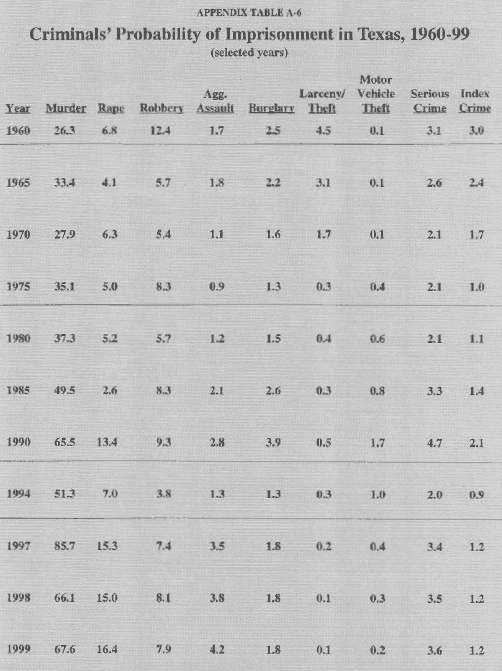
- Murderers in prison spend a median time of 13.4 years there, but expected punishment for someone who commits a murder is 9.1 years (because the probability of prison is 67.6 percent times 161 median months served).
- The median time served by rapists is an estimated 12.4 years, while expected punishment for committing rape is two years (the probability of prison, 16.4 percent, times 149 median months served).
- The median time served for robbery is 7.5 years, but expected punishment is only 7.1 months (the probability of prison, 7.9 percent, times 90 months served).
- The median time served for aggravated assault is 3.4 years, but expected punishment is only 52 days (the probability of prison, 4.2 percent, times 3.38 years).
- The median time served for burglary is 26.3 months, but expected punishment is 14 days (the probability of prison, 1.8 percent, times 26.3 months).
If some of these numbers seem low, they are. For this reason, crime still pays for many criminals. Nonetheless, the expected cost of crime to criminals is higher than it was in the early 1990s.
"The expected punishment for murder is 9.1 years."
The Change in Expected Punishment over Time. Increasing the prison time served several-fold has had a dramatic effect on expected punishment for every type of crime in Texas. As Table III shows:
- During the nine-year period 1990 to 1999, expected punishment rose 213 percent for murder and 243 percent for rape.
- It rose 300 percent for aggravated assault and 189 percent for robbery.
- It rose 40 percent for burglary.
"The greatest increase in expected punishment was for murder."
On the average, the crimes with the longest expected prison terms (violent index crimes of murder, rape, robbery and aggravated assault) are the crimes least frequently committed, comprising only about 11 percent of all index crimes in Texas. The remaining 89 percent of index (property) crimes carry an expected prison term of only a few days.
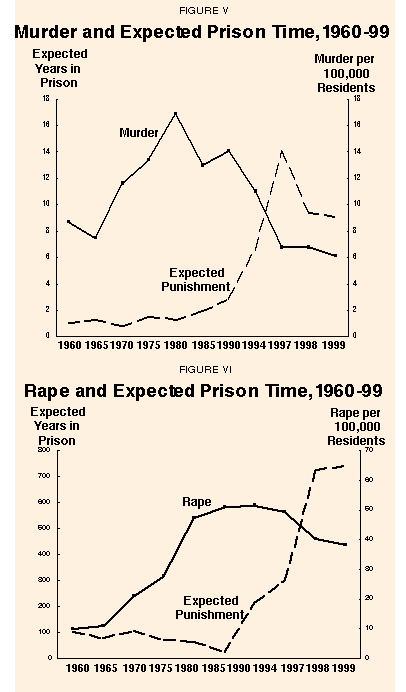
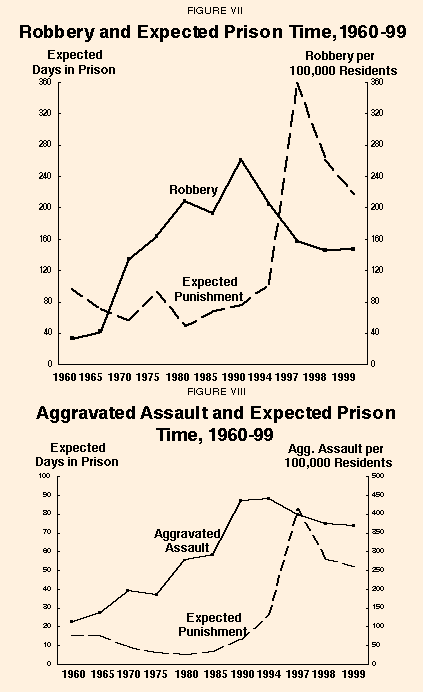
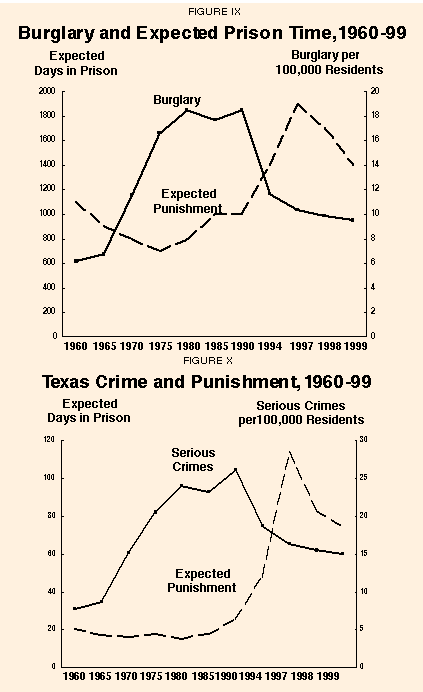
Expected Punishment and the Crime Rate. Figures V & VI, VII & VIII, and Figures IX & X show the relationship between expected punishment and various Texas crime rates over the past four decades. As the figures indicate:
- Both crime and expected punishments were low in 1960, and expected punishments failed to rise to meet the steep increases in crime during the 1960s and 1970s.
- Although crime rates continued their ascent during the 1980s, the rate of increase moderated (except for aggravated assault) as expected punishment increased modestly.
- Expected punishment rose steeply in the 1990s to unprecedented heights, and crime rates fell.
The conclusion? Since 1991 a drastic increase in expected punishment has coincided with a major decline in crime.35
Table IV shows the calculation of aggregate expected punishment for violent crimes and burglary. The path of expected punishment overall resembles the pattern for each crime, with a mild decline in prison days per crime from the '60s into the early '80s, then a moderate rise and finally a sharp increase in the '90s. Table III, discussed above, shows the path of expected punishment for each of the five serious index crimes (also expected punishment for Figures V & VI, Figures VII & VIII, and Figures IX & X).
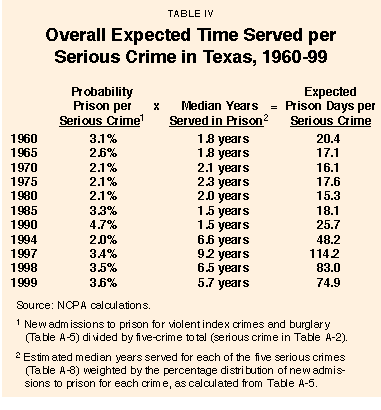
"After a decline in the 1980's, overall expected punishment increased sharply in the 1990's."
In the 1994 race for governor, George W. Bush campaigned on a theme of getting tough on juvenile criminals. This was part of a nationwide movement in state government, a response to the doubling of juvenile homicide and arrest rates since the early 1980s.36 Between 1988 and 1994, juvenile arrests (highly correlated with juvenile criminal activity) in the state shot up from 100,000 to 176,000.37 During the same period, adult arrests (ages 17+) rose only 25 percent.38 While juvenile arrests for violent crimes remained a small fraction (3 percent) of juvenile arrests, this nonetheless meant that violent crimes committed by youths were increasing much faster than adult violent crime, which was on the decline. To illustrate the disparity, arrests of juveniles for violent crimes were 10 percent of those for adults in 1990, but 14 percent by 1994.39
Against this background, Gov. Bush's successful campaign propelled reform of the juvenile justice system. The state's juvenile justice code was overhauled. The state lowered to 14 the age at which youths can be tried as adults for violent crimes, expanded the use of fingerprinting and photographs to track gang members, established boot camps and "tough love" alternative schools for disruptive youths, expanded secure youth facilities, began automatic detention of youths who unlawfully carry handguns or commit a crime with a firearm and adopted tough penalties for those who sell guns to youths.40
"There has been a turnaround in juvenile crime."
The result has been a turnaround in juvenile crime. Juvenile crime as gauged by arrests peaked in 1996 and declined 16 percent in the subsequent three-year period (the most recent data are for 1999).41 Juvenile arrests for violent crimes, however, declined by slightly less, about 14 percent. Referrals to juvenile probation departments have declined for four consecutive years, down 11 percent over the period (134,000 to 119,000).
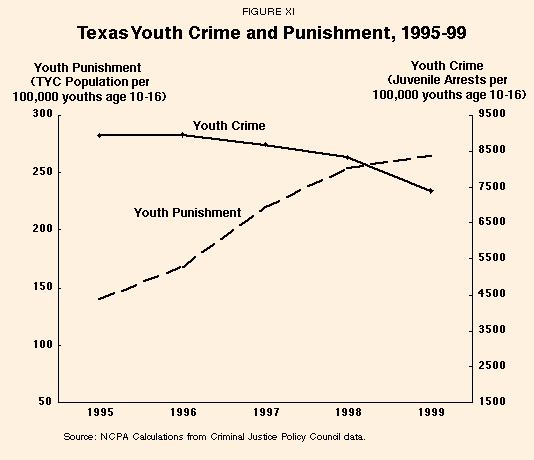
It is hard to argue that tougher sanctions deserve zero credit for the decline in youth crime.42 Reform emphasized holding youths to stricter accountability under the rules of community supervision, and now eight of 10 sent to the Texas Youth Commission (TYC) for lockup are "supervision failures." The annual number committed to TYC facilities increased from 2,875 in 1995 to 4,353 in 1999, a 51 percent increase in only four years.43 As Figure XI shows, as the percentage of youths detained in TYC facilities rose during the Bush administration, juvenile crime declined. Violent offenders sent to TYC now serve an average of 23 months, up from 15 months in 1995.44 The proportion of youths serving more than 12 months in their initial commitment rose from 42 percent of those released in 1995 to 58 percent of those released in 1999.45
[page]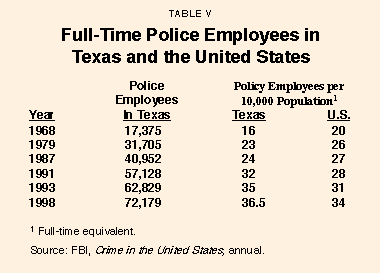
Crime and punishment obviously do not operate in a vacuum. Though individuals choose to commit crimes, these choices are affected by a host of political, judicial, social and other influences. This section examines some of these.
"There is little evidence that poverty causes crime."
"Root Causes" of Crime. Sociological factors affecting crime have not changed substantially in Texas, although the economy has strengthened since 1991 and unemployment has dropped. Despite much rhetoric to the contrary, there is little evidence that economic factors like poverty, a poor economy, low wages or low income growth and high unemployment cause crime. If anything, the reverse is true: criminal activity causes poverty and economic stagnation. Few of the unpleasant social or demographic facts about Texas have changed: births to unmarried women continue to grow; about 20 percent of adults are not high school graduates; and the number of Texans living in poverty has increased about 20 percent in the 1990s, to more than 3.1 million. Texas' per capita income is 94.5 percent of the national per capita income, the highest since 1985, the end of the oil boom of the early 1980s.46
Law Enforcement Personnel. As Table V shows, although Texas had fewer police per capita than the national average during the 1970s, the number of full-time police employees has increased 53 percent since 1987, from 41,000 to 72,000, pushing Texas to 13 percent above the national average on a per capita basis. Total employment in the courts and correctional system has grown apace. More police do deter crime.47
"Texas has more police per capita than the nation as a whole."
Federal Court Decisions. One key factor that had an impact throughout the 1970s and 1980s was the change in the criminal justice system caused by the U.S. Supreme Court. After the Supreme Court's first landmark decision in 1961 (Mapp v. Ohio) expanding the rights of criminal defendants and making it more costly for police and prosecutors to obtain criminal convictions, a growing reluctance to prosecute and punish criminals emerged.
A series of related decisions followed: Gideon v. Wainwright (1963) required taxpayer-funded counsel for defendants who could not afford an attorney; Escobedo v. Illinois (1964) and Malloy v. Hogan (1964) expanded privileges against self-incrimination, impeding interrogation of suspects by police; and Miranda v. Arizona (1966) made confessions – even voluntary ones – inadmissible as evidence unless the suspect was first advised of certain rights.
The enforcement system was transformed by these decisions. As Justice Benjamin Cardozo wrote in a 1926 case, "The criminal is to go free because the constable has blundered."48 Justice Byron White, dissenting in the Miranda case, warned that the decision would have "a corrosive effect on the criminal law as an effective device to prevent crime."49 It appears that what Judge Macklin Fleming called "the pursuit of perfect justice" has increased the time and effort required to apprehend, convict and punish the guilty.50
Texas Court Decisions. In Texas in 1980, Federal District Judge William Wayne Justice compounded the problem by declaring the Texas prison system unconstitutionally "cruel and unusual punishment." The resulting court orders, federal monitoring and consent decrees in Ruiz v. McCotter prohibited the state from housing more than two prisoners in one cell, forbade assigning inmates to supervise the activities of other inmates, ordered staffing increased to one guard per six inmates (now one per four) and ordered the state to reduce its prisoner population to 95 percent of prison capacity. The state's failure to expand prison space under these costly constraints was a major factor in the decline in length of prison sentences served in Texas during the 1980s.
Under terms of a settlement reached in December 1992, state officials recovered "control" of the state prisons. Yet Judge Justice still has the final word on such matters as size of the inmate population, staffing, medical care and the use of tents to house inmates. This situation could have been avoided if the state had sought termination of the Ruiz suit. The U.S. Justice Department had joined state officials in calling for an end to the suit, and decisions by the U.S. Court of Appeals and U.S. Supreme Court suggested that the state's chances of winning complete prison control were excellent. Despite a 1995 House vote to challenge the Ruiz settlement and other political activism, the suit was never overthrown.
Through its Court of Criminal Appeals, Texas has given criminal defendants even more legal privileges than has the federal judiciary:
In the federal courts, oral confessions can be admitted into evidence in Texas; they cannot unless they are recorded.
If police obtain evidence operating on good faith under a search warrant and the search warrant is later thrown out, the federal courts will admit the evidence under a "good faith" exception; the Texas Court of Criminal Appeals will not.51
"Improvements were under way when George W. Bush became governor, but he has provided strong leadership on the crime issue."
The Governor's Role. Since Gov. George W. Bush became the Republican candidate for president in 2000, crime and the treatment of criminals in the Lone Star State have become national issues in the presidential campaign. The state's criminal code had been overhauled in 1993, and prison expansion was already under way before Bush took office in January 1995. As Glen Castlebury, a spokesman for the Texas Department of Criminal Justice, said, "It was the cops on the street who were pulling these guys in and the district judges who were thumping them in jail. It would've happened if I'd been sitting there as governor."
Still, Gov. Bush has provided strong leadership on the crime issue and on specific actions like toughening the treatment of juvenile offenders, expanding the Texas Youth Commission's residential facilities and appointing tough-minded people to the parole board. Bush's signing into law legislation requiring that permits to carry concealed weapons be issued to qualified persons who complete a training program probably has decreased crime by 5 to 8 percent, according to a study of the effect of concealed carry laws on crime rates.52 When the Criminal Justice Policy Council reported, early in 2000, large increases in prison time served, the governor's office said that "the revolving door in Texas has closed. It [the report] sends a strong message to criminals that if you commit a violent crime in Texas, you'll be locked up for a long time."
Other Social and Demographic Factors. The late 1960s and early 1970s were socially turbulent years – the Vietnam War, the rise of a counterculture, urban riots. Also during the 1960s, males between the ages of 15 and 24 – the highest-crime group – increased from 6.6 percent to 8.5 percent of the U.S. population. The increase continued during the 1970s, with the young male population peaking at 8.9 percent in 1980. This demographic factor undoubtedly helped boost the crime rate nationwide.53
"Texas has a relatively large supply of potentially crime-prone people."
In many racial, ethnic and social dimensions the state resembles the national averages, although Texas has a higher Hispanic population share than the nation as a whole (29.4 percent versus 11.4 percent). However, other factors imply a higher-than-average crime rate for Texas because of a relatively large supply of crime-prone people: Texas has a younger population than the national norm (median age is 32.7 years, 48th among the states, versus a national median of 35.3 years), and as a high-growth state with a warm-weather climate and border location (1,248 miles with Mexico), it has a relatively large mobile and transient population (its annual population change of 14.6 percent ranks Texas as second highest in turnover).54 Texas ranked 44th in a recent study of child poverty and 37th overall in 10 social areas.55 Texas also, of course, is a vast state with a diverse population (nearly 1 million undocumented immigrants), still somewhat influenced by a frontier mentality and a culture of "rugged individualism."
The most successful crime prevention program in America is the intact married family.56 One of the few social indicators improving recently is a decline in the Texas teen birth rate.57
[page]Texas has shown in recent years that punishment deters crime and that when crime does not pay, criminals commit fewer crimes. When the price of crime – the expected punishment for committing a crime – dropped precipitously in Texas during the 1980s, the drop was accompanied by a surge in crime rates. A prison building boom enabled the state to increase expected punishment in the 1990s – and crime rates fell. In addition to increasing the probability of adult criminals going to prison, the state toughened its juvenile justice system in the late 1990s – and experienced a drop in what had been a rising amount of juvenile crime.
Reducing crime in Texas, even holding it at its current level, requires continuing vigilance. By both word and deed, it is up to criminal justice officials and the general public to persuade juveniles and other would-be offenders that crime does not pay.
"Prevention or prison appear to be the primary tools that government can use to control crime."
The nation has two million prison and jail inmates, and the debate is growing about how to slow this expensive and unfortunate growth in our nation's prison population. The ideal solution would be if people stopped committing crimes. That being unlikely, prevention or prison appear to be the primary tools that government can use to control crime. Yet federal programs to reduce the so-called root causes have done vastly more harm than good. The highest social ("root cause") correlate with crime rates is births out of wedlock, and federal programs have done far more to promote fatherlessness than prevent it. That leaves get-tough policies as the primary control tool.
With prisoners already serving long terms, the state should shift its criminal justice resources at the margin toward raising the certainty that criminals will go to prison for serious crimes and reducing relapses into crime upon release. The former policy implies hiring more police per serious crime; the latter suggests increasing the effectiveness of the corrections experience.
NOTE: Nothing written here should be construed as necessarily reflecting the views of the National Center for Policy Analysis or as an attempt to aid or hinder the passage of any bill before Congress.
[page]- FBI, Crime in the United States: Uniform Crime Reports, annual; Texas Department of Public Safety, Crime in Texas, annual.
- The U.S. Department of Justice administers two statistical programs to measure the magnitude, nature and impact of crime: the Uniform Crime Reporting (UCR) program and the National Crime Victimization Survey (NCVS). Index crimes are crimes reported to state agencies or the FBI and compiled in the FBI Index of Crime – part of the UCR program. The NCVS collects detailed information on crimes from a nationally representative sample of approximately 43,000 households to determine the amount of crime according to victims age 12 and older – not all of whom report the crime to the police. Since fewer than four of every 10 crimes are reported, the NCVS is thought to be the best estimate of the true amount of crime, although both systems undercount. For example, the NCVS does not measure murder, crimes against those under age 12 or against those in jails and prisons.
- NCPA calculations based on Texas Department of Public Safety, Crime in Texas, annual. Also see DPS, Texas Crime Clock, Crime in Texas 1998, p. 13.
- Kathleen O'Leary Morgan and Scott Morgan, eds., Crime State Rankings 2000 (Lawrence, Kan.: Morgan Quitno Press), p. iv.
- U.S. Bureau of Justice Statistics, Probation and Parole in the United States, 1998, NCJ 178234, August 1999, p. 2. At the end of 1998 Texas had 555,780 offenders on probation and parole, while California was second with 435,044.
- U.S. Bureau of Justice Statistics, Prison and Jail Inmates at Midyear 1999, April 2000, NCJ 181643, p 3.
- Criminal Justice Policy Council, Projected Percent of Sentence Served for Violent Offenders Convicted of Specific Offense Types.
- Charles Friel, Professor of Criminal Justice at Sam Houston State University, quoted by reporter Diane Jennings in "Full House: Growing inmate population has lawmakers scrambling for alternate solutions," Dallas Morning News, April 9, 2000, p. 47A.
- Neighboring state Louisiana stood first at 763 and Oklahoma was third at 653, with Texas second at 704; lowest was Minnesota at 121; see U.S. Bureau of Justice Statistics, Prison and Jail Inmates at Midyear 1999, p. 4.
- Steve Olafson, "County Jails Boomed, Now Face a Bust," Houston Chronicle, November 12, 1995, p. 37A.
- Texas Commission on Jail Standards, Texas County Jail Population Reports, 1992-98.
- 702,590 in Texas versus 610,983 in second-place California in 1999. See "U.S. Correctional Population Reaches 6.3 Million Men and Women: Represents 3.1 Percent of the Adult U.S. Population," U.S. Bureau of Justice Statistics, Press Release, July 23, 2000, www.ojp.usdoj.gov/bjs/pub/pdf/pp99pr.pdf and BJS, Prison and Jail Inmates at Midyear 1999, April 2000, NCJ 181643, p 3.
- Calculated based on state adult population of 14,325,695 derived from BJS, Press Release, "U.S. Correctional Population Reaches 6.3 Million Men and Women: Represents 3.1 Percent of the Adult U.S. Population."
- Criminal Justice Policy Council, Time Served in Prison, Fiscal Years 1988-1998.
- NCPA calculations from Texas Department of Criminal Justice, Statistical Report, annual data, Huntsville, Texas; see Appendix Tables A-7, A-8, and A-9.
- The state's 116 prisons and jails have recently run up against capacity limits again; the Texas Department of Criminal Justice now rents about 3,000 beds in county jails and plans to rent another 1,500. Legislators are considering building new prisons to house another 15,000 prisoners by 2005. See James Kimberly, "Leaders say Texas needs new prisons," Houston Chronicle, May 27, 2000, p. 1A.
- Criminal Justice Policy Council, Testing the Case for More Incarceration in Texas: The Record So Far, October 5, 1995, State of Texas, first page, unnumbered.
- Criminal Justice Policy Council, Testing the Case for More Incarceration in Texas, second unnumbered page.
- Criminal Justice Policy Council, The Big Picture Issues in Criminal Justice, Biennial Report to the Governor and the 74th Texas Legislature, January 1995, p. 1.
- Morgan O. Reynolds, "Does Punishment Deter?" National Center for Policy Analysis, Policy Backgrounder No. 148, August 17, 1998.
- James Kimberly, "Texas may give parolees a break," Houston Chronicle, June 4, 2000, p. 1E.
- The parole percentage rose to 26 percent in May 2000 and 24 percent in June 2000. See Associated Press, "Percentage of paroled inmates up," Bryan-College Station Eagle, July 21, 2000, p. A13. Postrelease behavior could also be improved by posting private release bonds. See Morgan O. Reynolds, Privatizing Probation and Parole, National Center for Policy Analysis, Policy Report No. 233, June 2000.
- This is true for "crimes of passion" as well as economic crimes. The less costly crime becomes, the more often people fail to control their passions. Incentives matter in all human behavior.
- James Q. Wilson, Thinking about Crime, rev. ed. (New York: Basic Books, 1983), p. 117.
- W. Kip Viscusi, "The Risks and Rewards of Criminal Activity: A Comprehensive Test of Criminal Deterrence," Journal of Labor Economics, Vol. 4, No. 3, 1986, pp. 317-40; Julie Horney and Ineke H. Marshall, "Risk Perceptions among Serious Offenders: The Role of Crime and Punishment," Criminology, Vol. 30, No. 4, November 1992, pp. 575-91; and Houston Chronicle, Dec. 2, 1990, pp. 1A, 25A and 1D; Stanton Samenow, Straight Talk about Criminals, 1998.
- See the literature cited in Morgan O. Reynolds, "Does Punishment Deter?"; Morgan O. Reynolds, Crime and Punishment in America: 1999, NCPA Policy Report No. 229, October 1999; and earlier surveys of the literature in Gordon Tullock, "Does Punishment Deter Crime?" The Public Interest, 36, Summer 1974, pp. 103-11; Morgan O. Reynolds, Crime by Choice (Dallas: Fisher Institute, 1985), ch. 12; and Stephen G. Craig, "The Deterrent Impact of Police: An Examination of a Locally Provided Public Service," Journal of Urban Economics, Vol. 21, 1987, pp. 298-311.
- As the author's son, Cameron D. Reynolds, a Texas criminal defense lawyer and former assistant district attorney, says, "It takes a lot to get to prison."
- Criminal Justice Policy Council, Time Served in Prison: Nonviolent Offenders, Fiscal Years 1988-1998; Time Served in Prison: Aggravated Offenders, Fiscal Years 1988-1998. See Appendix Table A-8 for estimated median sentences for each category of crime.
- Only 1.2 percent of index crimes resulted in a prison admission in 1999; see Appendix Table A-6.
- Do low probabilities of death affect behavior? The answer is yes. Ask those sightseeing at the edge of a cliff. Do low probabilities of prison affect criminals? Ask criminals.
- Statistics on two probabilities – that of being prosecuted after an arrest and of being convicted if prosecuted – are not available in detail. Fortunately, we do not need such detail to calculate expected punishment. We require only three numbers for each type of crime: (1) the number of new convicts the courts sent to prison for those crimes, (2) the number of those crimes reported to police and (3) the median prison time served by those released from prison. Mathematically, the long calculation-percentage of crimes cleared by arrest multiplied by the ratio of prosecutions to arrests multiplied by the ratio of convictions to prosecutions multiplied by the ratio of those sent to prison to total convictions-equals the ratio of new prisoners to number of crimes, that is, the probability of prison.
- One arrest can result in the police "clearing" (solving) more than one crime, a fact that arrest clearance statistics take into account appropriately. This means that the so-called clearance rate usually exceeds arrests divided by reported crimes. While desirable data, arrest clearance rates are not available statewide. Arrests divided by crimes is calculated by adding data on adult arrests to estimated number of juvenile arrests by offense type. See Criminal Justice Policy Council, Statistical Sourcebook
- Calculated from FBI, Uniform Crime Reports, annual, and Texas Department of Criminal Justice, Statistical Reports. Admissions to prison and probability of imprisonment are shown in Appendix Tables A-5 and A-6.
- Calculated from FBI, Uniform Crime Reports, annual, Department of Public Safety, Crime in Texas, annual, and Texas Department of Criminal Justice, Statistical Reports, annual.
- Note that simple linear, two-variable regressions or correlations fail to fit the expected punishment/crime rate data very well, only yielding a strongly significant negative association between punishment and crime rate in the (least likely?) case of murder. These results are likely explained by the fact that the data are highly nonlinear, suggesting alternative regression models, and the failure to control for demographic and other variables. See references above for statistical crime models that support the power of criminal justice variables to suppress criminal activity.
- See Morgan O. Reynolds, "The Long Arm of Federal Juvenile Crime Law Shortened," National Center for Policy Analysis, Brief Analysis No. 235, July 15, 1997.
- Criminal Justice Policy Council, Juvenile Arrests Declined in 1997 And 1998 After a Steady Increase From 1988 to 1996, p. 2.
- Criminal Justice Policy Council, Adult Arrests in Texas by Offense Category, 1988-1998, p. 11, and Criminal Justice Policy Council document, p. 8.
- This ratio continued to grow to 16.8 percent in the latest numbers because juvenile arrests have diminished more slowly than those of adults.
- Adjusted for the growth in population ages 10-16, the arrest rate per 100,000 youths declined 17 percent. Calculation from Criminal Justice Policy Council document
- Steven D. Levitt, "Juvenile Crime and Punishment," Journal of Political Economy, Vol. 106, No. 6, December 1998, pp. 1156-85.
- Criminal Justice Policy Council document,p. 8.
- Ibid., p. 7. This calculation excludes criminals who end their sentences in the adult justice system.
- Ibid., p. 11.2.
- Texas Fact Book 2000, p. 18.
- See Steven D. Levitt, "Using Electoral Cycles in Police Hiring to Estimate the Effect of Police on Crime," National Bureau of Economic Research, Inc., Working Paper No. 4991, January 1995.
- People v. Defore, 242 NY 21 (1926).
- 384 US 543.
- Macklin Fleming, The Price of Perfect Justice (New York: Basic Books, 1974); Reynolds, Crime by Choice, ch. 8; Robert James Bidinotto, ed., Criminal Justice? The Legal System Versus Individual Responsibility (Irvington-on-Hudson, N.Y.: Foundation for Education, 1994); and Paul G. Cassell, "Handcuffing the Cops: Miranda's Harmful Effects on Law Enforcement," National Center for Policy Analysis, Policy Report No. 218, August 1998. In Dickerson v. United States, decided last June and argued by Cassell on behalf of the United States, the Supreme Court refused to overturn its "creative" 1966 Miranda ruling.
- The Texas Court of Criminal Appeals operates independent of the Texas Supreme Court, while the federal court system does not separate criminal appeals from civil appeals.
- John R. Lott Jr., More Guns, Less Crime (Chicago: University of Chicago Press, 1998).
- However, economist Steven Levitt finds that the young male share of population has a much smaller impact on crime than previously believed, increasing the crimes by no more than 1 percent per year. Rises in juvenile crime rates, for example, have been offset by declines in adult crime rates. See his article, "The Limited Role of Changing Age Structure in Explaining Aggregate Crime Rates," Criminology, Vol. 37, No. 3, 1999, pp. 581-97.
- See Texas Fact Book 2000 and U.S. Department of Commerce, Statistical Abstract of the United States 1999.
- Connie Mabin, Associated Press, "Child poverty rate in Texas still lags most of nation," Houston Chronicle, June 20, 2000
- Patrick Fagan, "Congress's Role in Improving Juvenile Delinquency Data," Heritage Foundation, Backgrounder No. 1351, March 10, 2000.
- Mabin, "Child poverty rate in Texas still lags most of nation."
Morgan O. Reynolds, an NCPA Senior Fellow and a professor of economics at Texas A&M University, received his Ph.D. from the University of Wisconsin in 1971. He has published many articles in academic journals, edited W. W. Hutt: An Economist for the Long Run (1986), and authored Power and Privilege: Labor Unions in America (1984), Crime by Choice: An Economic Analysis (1985), Making America Poorer: The Cost of Labor Law (1987), Public Expenditures, Taxes and the U.S. Distribution of Income (1977) and Economics of Labor (1995). He has been a consultant for the National League of Cities, the U.S. Department of Labor and many private organizations. He also serves on the board of the Journal of Labor Research, the Quarterly Journal of Austrian Economics and the Journal of Libertarian Studies, and is a member of the Mont Pelerin Society and an adjunct scholar of the Mises Institute.