Since its inception, Social Security has been a popular program because most retirees have received reasonable rates of return on the payroll taxes they have paid. However, as the program matures and as future workers face the daunting task of paying for the retirement of the baby boom generation, taxes will rise and the investment value of Social Security will decline.
This paper considers Social Security as an investment for different classes of workers based on their level of education. Why education, rather than income? Everyone's income will vary a lot over the course of a 40- to 45-year work life. As a result, level of education is a better predictor of expected Social Security taxes and benefits than current wages.
Education affects a person's "investment" in Social Security in other ways. Someone who drops out of high school will pay payroll taxes for more years than someone who remains in school. Yet because of Social Security's peculiar rules, these extra years of payments do not add anything to retirement benefits. In this sense, Social Security penalizes those with less education. On the other hand, more education tends to produce higher income over an entire work life and higher-income workers are treated less generously under Social Security's benefit formula. How any particular individual is affected also depends on such factors as life expectancy, marital status, number of children and the life expectancy of a spouse.
We have made calculations for individuals born in different years with different levels of educational achievement. In each case, we have calculated the internal rate of return on payroll taxes paid and the net present value of Social Security: the value today of expected future benefits minus expected costs.
Among workers born in the same year, we find that in most cases those with less education receive a higher rate of return than those with more education. Using a conservative, inflation-adjusted discount rate of 4 percent, we find that the present values are negative in most cases regardless of age or education; but workers with less education have lower lifetime losses than those with more education.
Present Values for Single Men. For singles, our calculation assumes the worker's tax payments produce his own retirement benefits exclusively -with no spousal benefits, no surviving spouse benefits and no benefits to surviving children. We find that:
- Regardless of the level of education and year of birth, single men would have done better if they could have invested their payroll tax dollars in the private capital market; however, those with more education do worse than those with less.
- For example, a 20-year-old high school graduate can expect to pay $32,667 more in taxes than he receives in benefits.
- A 20-year-old college graduate can expect a lifetime loss of $63,363.
- A 20-year-old who stays in school and earns a graduate degree can expect a net loss of $93,170.
- Social Security imposes not only a lifetime tax on workers, but also a loss that, while small or nonexistent during the program's early years, has grown through time.
Present Values for Single Women. There are similar differences in present values at various education levels for single women. However, their losses from Social Security are lower in general than for single men with the same education. The reason is that women have longer life expectancies (resulting in more monthly benefit checks) and lower predicted earnings (resulting in higher relative benefits and lower total taxes).
- All single women born in 1950 and later would have done better if they could have invested their payroll tax dollars in the private capital market.
- A 20-year-old high school graduate can expect to pay $20,858 more in taxes than she will receive in benefits over her lifetime.
- A 20-year-old who goes on to graduate from college can expect a loss of $53,900.
- A 20-year-old who obtains a graduate degree can expect a lifetime net loss of almost $76,900.
- As in the case of men, the "tax" on education has grown over time and is much more significant today than it was 40 or 50 years ago.
Present Values for Married Couples. Our calculations for couples assume a male who works continuously over his work life and a female who never enters the labor market. This somewhat unrealistic picture produces the best possible outcome under Social Security's benefit formulas, relative to the results for singles. Even under these circumstances, today's 20-year-olds, other than those with less than a high school education, can expect a lifetime loss.
Rates of Return for Single Men Individuals with lower levels of education generally have a higher rate of return than do those with higher levels of education. Still, for single men at every age and educational level internal rates of return are well below what they could expect from a conservative investment in the private economy. For example:
- A 20-year-old who earns a high school diploma can expect a 1.86 percent inflation-adjusted rate of return.
- The rate of return drops to 1.4 percent for college graduates and to 0.96 percent for those who earn a graduate degree.
- In general, these rates of return have declined over time; for example, the rate of return for a 65-year-old man with a graduate degree is 2.19 percent compared to 0.96 percent for a 20-year-old.
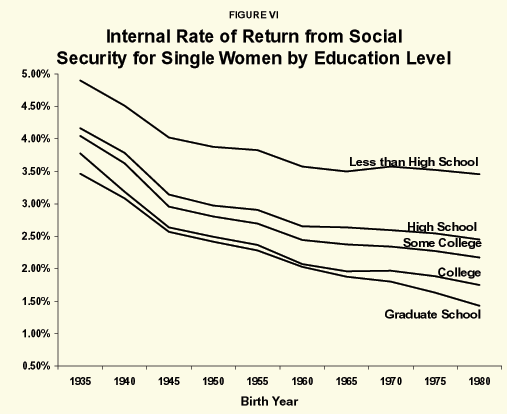
Rates of Return for Single Women. The rates of return start higher among older women and drop at every education level as age declines.
Rates of Return for Married Couples. Most married couples with nonworking spouses reaching retirement today can expect a real rate of return above 4 percent. However, among 20-year-olds only couples with less than a high school education can expect a real rate of return above 4 percent
The negative net present values and low rates of return for most education groups indicate that it is costly for workers to participate in Social Security. This holds for all groups except for some older people and those with the lowest levels of education.
[page]Social Security provides retirement benefits, insurance against death prior to a worker's retirement and benefits for nonworking spouses who outlive the beneficiary. Since its inception, Social Security has been a popular program because most retirees have received reasonable rates of return on the payroll taxes they have paid. Recently, however, people have begun to question the value of Social Security when viewed as an investment. As the program matures and as future workers face the daunting task of paying for the retirement of the baby boom generation, taxes will rise and the investment value of Social Security will decline.
In this paper we consider the value of the Old Age and Survivors Insurance (OASI) portion of Social Security as an investment for different classes of workers based on their level of education.1 Why education? Because among young workers, the level of education is a better indicator of potential lifetime earnings (and therefore expected Social Security taxes and benefits) than current wages.
"This study evaluates Social Security as an investment for workers based on their education."
Education also affects a person's "investment" in Social Security in other ways. Someone who drops out of high school will pay payroll taxes for more years than someone who remains in school. Yet because of Social Security's peculiar rules, these extra years of payments do not add anything to retirement benefits. In this sense, Social Security penalizes those with less education. On the other hand, more education tends to produce higher income, and higher-income workers are treated less generously under Social Security's benefit formula. How any particular individual is affected also depends on such other factors as life expectancy, marital status, number of children and the life expectancy of a spouse.
Social Security redistributes income between generations – from young to old – because taxes paid by today's workers are used to pay benefits to today's retirees. Under the benefit formula, lower-income workers receive higher benefits in return for their tax dollars than do higher-income workers within each generation. However, although the benefit formula is designed to redistribute from high- to low-income workers, this redistribution is offset to some degree by the fact that lower-income workers tend to have shorter lives and consequently receive fewer benefit checks. Accordingly, a goal of this study is to identify how much redistribution actually takes place.
We evaluate Social Security as an investment by two measures: the expected rate of return on payroll taxes paid and the net present value of those payments. The net present value is the value today of expected future benefits minus expected costs, using a 4 percent interest rate, representing a measure of the real rate of return that private investments could yield. If the figure is positive, the investor gains; if negative, the investor pays more in taxes than he or she receives in benefits.
[page]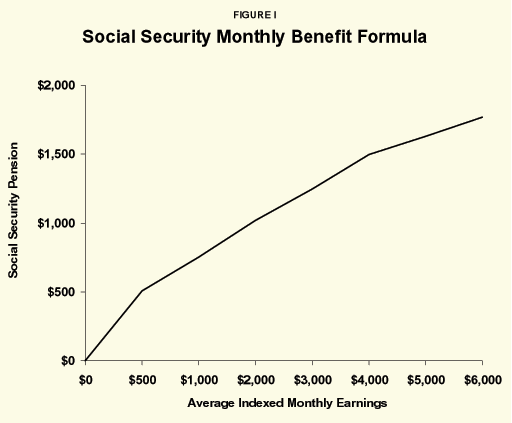
Typically the costs of an "investment" in Social Security are some 40 years of tax payments. The benefits are 15 to 20 years of retirement pension benefits.
We limit our analysis in this paper to the 10.6 percent of payroll tax that goes to Old Age and Survivors Insurance (OASI) because it is possible to isolate its costs and its retirement, survivors and spousal retirement benefits.
"Typically, the costs of an 'investment' in Social Security are some 40 years of tax payments, and the benefits are 15 to 20 years of retirement pension benifits."
Eligibility Requirements for OASI Benefits. The primary old age benefits are the worker's own retirement benefits and his or her spouse's benefits. Spouses draw benefits on a worker's account if they do not qualify for their own benefits or if their own earned benefits are less than 50 percent of the worker's benefits. For example, individuals who work fewer than 10 years do not qualify for Social Security, but they are eligible for retirement benefits equal to 50 percent of their working spouse's benefits while the worker is alive. Also, individuals whose own benefits are less than 50 percent of their spouse's are entitled to the higher amount, and they draw benefits on their spouse's accounts.
The Worker's Retirement Benefits. At retirement, workers begin collecting Social Security benefits that are loosely tied to the taxes they paid into the system over their lives. The Social Security Administration (SSA) keeps track of workers' taxable earnings from the time they enter the labor force until retirement. A worker's initial benefit is calculated by converting earnings in earlier years to dollars comparable to those in the year the worker turns 62, using a national average wage index that is updated annually by the SSA. Earnings beyond the age of 62 enter the calculation without being indexed. The 35 highest indexed annual earnings are added together and divided by 420, the number of months in 35 years, to obtain the worker's average monthly earnings.
The Benefit Formula. As Figure I shows, the worker's initial Social Security pension is computed from the average monthly earnings using a formula that replaces more of the earnings of low-income than of high-income workers.
- In 2001 retirees receive 90 cents for each of the first $561 of indexed monthly earnings.
- They receive an additional 32 cents for every dollar of earnings over $561 and less than or equal to $3,381, and 15 cents for every dollar in average monthly earnings above $3,381.
- Based on this formula, a worker who had average monthly earnings of $1,500 receives a pension equal to $805, replacing 54 percent of earnings.
- If a worker had average monthly earnings of $4,000, he or she receives a pension of $1,500, or only 38 percent of preretirement earnings.
"Accounting for survivors benefits is important."
Survivors Benefits. Accounting for survivors benefits is important because they have been overlooked in some previous studies of the Social Security investment. The impact of survivors insurance, particularly benefits that arise from premature deaths, has eluded careful empirical study. Supporters of the Social Security program often argue that groups whose members die early in life disproportionately benefit from survivors insurance.2
It is useful to think of survivors benefits in two parts. First are the benefits resulting from premature deaths or deaths prior to reaching the retirement age.
- In the case of a premature death, each surviving child under the age of 18 is entitled to 75 percent of the benefit to which the worker would have been entitled based on his or her earnings history.
- A surviving spouse also is entitled to 75 percent of the decedent's benefit as long as a dependent child under the age of 16 is in the household.
- The total family benefit is subject to a maximum that varies but is usually 150 to 180 percent of the decedent's benefit.
Second and more common are survivors benefits resulting from deaths after retirement.
- A surviving spouse is entitled to 100 percent of the decedent's benefit if it is higher than the benefit to which the spouse would have been entitled based on his or her earnings history.
- A child under 18 is entitled to 75 percent of the benefit to which the worker would have been entitled.
- The total family benefit is subject to a maximum that varies but is usually 150 to 180 percent of the decedent's benefit.
"The level of education is a better predictor of lifetime Social Security taxes and benefits than current income."
The categories of workers we study are defined by their year of birth, sex, education and marital status.3 Rates of return and net present values of the Social Security investments for each group are calculated. The calculations require estimating taxes and benefits for all possible life spans. Tax payments are directly related to the group's life cycle earnings and the tax rates that they face over their lifetime. Benefits are calculated by applying the Social Security benefit formula to each stream of earnings. The future components of the benefit formula are derived using the Social Security Administration's intermediate estimates of wage and price growth.4
Estimating Life Cycle Earnings. Projected life cycle earnings are estimated by applying the historical growth rates estimated from a Census Bureau data set known as the Current Population Survey (CPS). We use the annual March CPS supplements that include a wealth of labor market information at the individual level.5 The advantage of using life cycle earnings is that workers typically experience low inflation-adjusted earnings when young, rapidly rising earnings up to the middle to late thirties, continued rising earnings but at a slower pace up to the late forties to early fifties, and declining earnings from that point until retirement.6
Projecting Tax Rates. Historical tax rates are used up to the present, and projected rates from the Social Security Trustees Report are used in future years. Today's older workers faced lower tax rates in their youth, while today's younger workers are likely to face higher rates in the future. The current payroll tax rate of 10.6 percent for OASI is set by law and is not scheduled to change. However, according to the 2000 Trustees Report, Social Security expenses will begin exceeding tax revenues in 2016. Although general tax revenues could be used to make up the shortfall, we assume workers will bear the full burden of financing future benefit payments through an increase in the payroll tax rate.7
"Net present value is the value (in current dollars) of expected benefits minus expected taxes."
Estimating Longevity. Mortality estimates in this study are drawn from several sources including the U.S. Census, the Social Security Administration and death-registration data. The analysis by racial groups, which is presented in a companion study, requires estimates for people born from 1935 to 1980 for both black and white men and women. The Census Bureau has estimated life tables in future years for racial groups and for the general public, which are the starting point for our estimates. To provide consistency between both studies, the analysis by education groups also uses the Census Bureau data. We adjust the Census Bureau's mortality estimates to reflect education-based differences in longevity. Social Security Administration estimates are used to supplement the Census data at higher ages.8
"To calculate net present value, we multiply the probability of living to every possible age times the taxes and benefits associated with each lifespan."
Calculating Expected Net Present Values and Expected Rates of Return. With education-specific mortality rates and earnings, it is possible to calculate each group's expected net present values and internal rates of return. As mentioned above, each possible life span is associated with a separate stream of taxes and benefits. Deaths at early ages result in survivors benefit payments to children and spouses based on a few years of tax payments. Deaths at later ages represent investments that involve many years of tax payments and benefits that include retirement pensions for the worker and possibly his or her spouse, as well as survivors benefits. Each of these streams of taxes and benefits has a well-defined net present value. To calculate the expected net present value for an individual, we multiply the probability of dying at each age times the tax and benefit streams. Summing across the present values gives the expected net present value for a group. The internal rate of return is the discount rate at which the present values of expected taxes and expected benefits are equal.9
[page]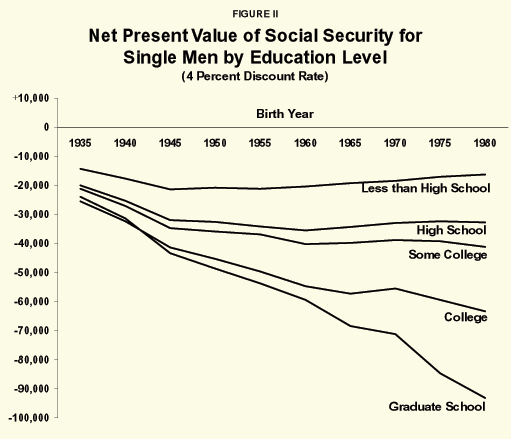
The experience of single men and women represents the most basic of all Social Security investments. We assume their tax payments produce their own retirement benefits exclusively – no benefits to surviving children, no spousal benefits and no surviving spouse benefits.10
"Men of all education levels would have done better investing their payroll tax dollars at a 4 percent rate of return."
Differences by Education Level in Net Present Values for Single Men. Figure II summarizes the net present values for single men based on their education level and the year in which they were born. All net present values are presented in 1999 dollars and are calculated at the age of 25. As the graph indicates:
- All of the present values are negative, regardless of the level of education; that is, men of all education levels would have done better if they could have invested their payroll tax dollars at a 4 percent rate of return.11
- The present values decline over time; high school graduates who just retired (65-year-olds) paid $20,059 more in taxes than they can expect to receive in benefits, while high school graduates born in 1980 (20-year-olds) will pay $32,667 more in taxes than they can expect to receive in benefits.
- In all years, those with lower educations have higher (less negative) net present values, even though they have shorter life spans; a 20-year-old with less than a high school education can expect to pay $16,264 more in taxes than he receives in benefits, while the net loss of a man with a graduate degree is expected to climb to $93,170.
Another notable feature of Figure II is the growing disparity among the relative net present values for the different groups – a pattern repeated in future graphs. Since the mid-1970s, the earnings of more educated workers have risen relative to the average, while the earnings of the less educated and less skilled have fallen. Further, real wages for the average worker have not grown significantly. Our predictions of future earnings assume that the fanning out of wages will persist.12
"Since the mid-1970's, earnings of more educated workers have risen relative to the average and earnings of the less educated have fallen."
As Figure II indicates, we expect the net present value to rise modestly for workers with less than a college education born after 1960. With their earnings falling relative to the average, the redistributive benefit formula will replace a higher percentage of their indexed earnings. In addition, some of the rise can be attributed to the fact that the retirement age is not scheduled to rise above 67 years of age.13 With a constant retirement age and rising life spans, the retirement period will rise for workers born in recent years. While workers in the recent birth years with lower education levels are expected to see a modest increase in the net present values, the present values for more educated workers are expected to fall.
"Net present values for most women at all education levels are negative."
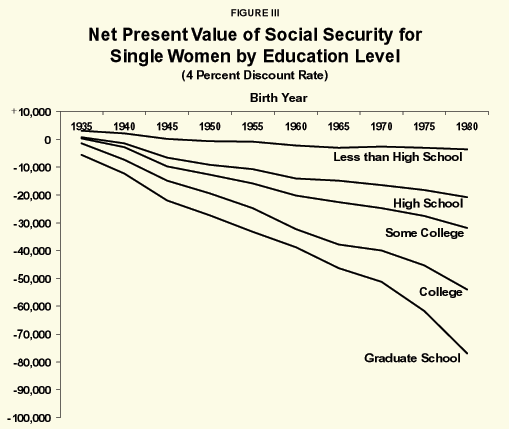
Differences by Education Level in Net Present Values for Single Women. Figure III reveals similar results for single women. The net present values are higher in general than for single men with the same educations. They are positive for some older women, unlike the net present value for men. The higher net present values result from longer expected lives and lower predicted earnings.14
- Most of the present values are negative regardless of the level of education; all those born in 1950 and later would have done better if they could have invested their payroll tax dollars at a 4 percent rate of return.
- The present values decline over time; high school graduates who just retired (65-year-olds) receive $815 more in benefits than they pay in taxes, while high school graduates born in 1980 (20-year-olds) can expect a net loss of $20,858.
- Those with lower education levels have higher net present values; a 20-year-old with less than a high school education can expect a lifetime net loss of almost $3,672, but the expected loss climbs to almost $76,900 for a woman with a graduate degree.
"Calculations for married men assume a spouse who never works."
Differences by Education Level in Net Present Values for Married Men with Nonworking Spouses and Children. Figure IV presents the net present values for married men with nonworking spouses. To make these estimates, we assume that at age 22 men marry women of the same age. We assume that at age 25 the couple has twin children. Thus survivors benefits are paid for premature deaths between ages 25 and 43.15 These assumptions produce the largest possible net present value on tax payments made by only one worker.16 As Figure IV indicates, the pattern of outcomes is similar to those in the previous figures, with the workers with low education levels having the highest net present values.
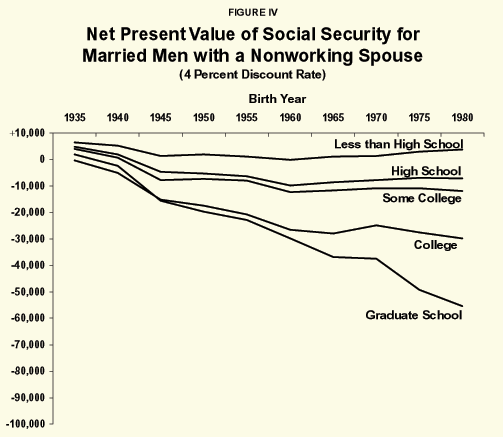
- Only for the group at the very lowest education level are the expected net present values for the younger workers positive at all.
- Relative to single men, the net present values improve significantly as a result of the survivors benefits and spousal benefits; the net present value for 20-year-old college graduates is $33,576 more for married men than for single men.
- The net present value for 20-year-old high school graduates is $25,528 more for married men than for single men.
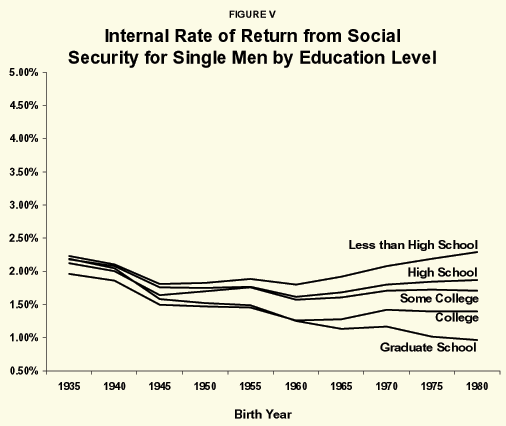
An analysis of the internal rate of return of the Social Security investment indicates that individuals with lower levels of education generally have a higher rate of return than do those with higher levels of education.
Differences by Education Level in Internal Rates of Return for Single Men. The internal rates of return for single men, estimated according to their level of education, are presented in Figure V.
- A 65-year-old who earned a high school diploma can expect a 2.18 percent inflation-adjusted rate of return, while similarly educated 20-year-olds can expect a 1.86 percent return.
- There is a much more pronounced decline for men with a graduate school education; 65-year-olds can expect a 2.19 percent return, while 20-year-olds can expect a 0.96 percent return.
Among those nearing retirement, more educated men have slightly higher rates of return than the average, but in most other cases the less educated fare better than the more educated. The fanning out of the returns for younger men is consistent with the pattern observed based on the net present values.
Differences by Education Level in Internal Rates of Return for Single Women. For single women, as depicted in Figure VI, the story is slightly different. Their rates of return start higher among older women and drop across the board as age declines.17
"At every age, the rate of return earned by single men is less that what could have been earned in the private capital market."
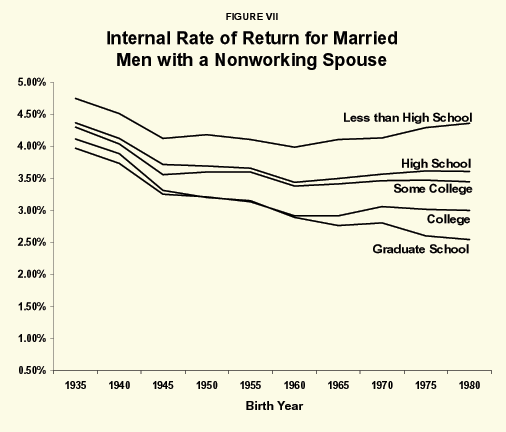
Differences by Education Level in Internal Rates of Return for Married Men with Nonworking Spouses and Children. At any level of education, married men (with a nonworking spouse) receive a far greater rate of return than single men. Sixty-five-year-old married men at all levels of education except college graduates can expect a real rate of return above 4 percent. But of those born in 1980, only married men with less than a high school education can expect a real rate of return above 4 percent. The now-familiar pattern of declining and widening rates of return as we move from older to younger workers is again evident in Figure VII.
- Among married college graduates, 20-year-olds earn a rate of return almost 1 percentage point less (3.97 percent vs. 3.00 percent) than 65-year-olds.
- Similarly, the rate of return declines from 4.37 percent to 3.60 percent among high school graduates.
- The rate of return declines only modestly, from 4.75 percent to 4.36 percent among those with less than a high school education.
"Most single women can expect meager rates of return."
Upon entering the labor force, workers born in the same year begin their association with Social Security. Most spend the next 40 to 50 years working and paying taxes, and then collect pensions upon retirement. But some die along the way, potentially spawning a stream of benefits to their heirs. Tables I and II take a more detailed look at the shares of Social Security's costs and benefits attributable to those who survive to maturity and to those who do not. The tables also indicate how spousal and survivors benefits affect our estimates.
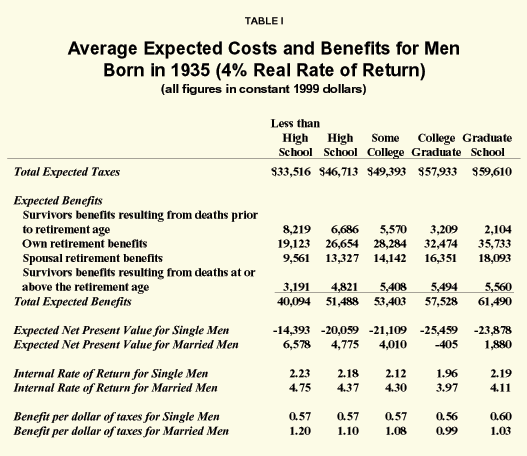
Costs and Benefits for Men Born in 1935. Table I presents the results for men born in 1935. On the average, individuals with a graduate degree pay $59,610 in average lifetime taxes, 78 percent more than the $33,516 paid by those with less than a high school education.
"Among 65-year-old men, those with a graduate degree pay 78 percent more in lifetime taxes than those with less than a high school education, on the average."
Four benefit categories are identified: (1) survivors benefits resulting from the worker's premature death,18 (2) the individual's own retirement benefits, (3) spousal retirement benefits, and (4) survivors benefits resulting from death at or above retirement age. The expected net present value for single men born in 1935 is negative at every level of education. However, it is positive for married men at every level of education except college graduates – and is only slightly negative for them.
In the case of a worker's premature death, the higher the worker's level of education, the less the survivors benefits. For example, survivors of decedents with less than a high school education collect $8,219 and survivors of decedents with a graduate degree collect $2,104. The almost fourfold differential reflects the greater likelihood of premature deaths among the less educated.
The remainder of the benefits, all of which are received during retirement or by survivors after the worker's death, rise with education level for two reasons. Individuals with more education pay higher lifetime taxes, and even though the benefit formula replaces a smaller share of the higher-income worker's earnings, their benefits rise. Also, individuals with higher education levels receive more benefits due to their longer expected life.
"Single men nearing retirement can expect to get back about 57 cents for every dollar they paid in taxes."
Two rows in Table I summarize the net present values and rates of return for single and married men born in 1935. Those with a graduate degree actually do better than those with an undergraduate degree. Single men with college educations will pay a net lifetime tax of $25,459 while those with a graduate degree pay slightly less, $23,878. Those with a graduate degree have slightly higher expected life spans and earnings. The lifetime tax loss for college educated married men is $405, but men with a graduate degree actually receive a net benefit of $1,880. Consistent with the net present values, the rates of return show that married men with graduate degrees fare better under Social Security than do those who earned a college degree. For single men, the returns are highest at the extremes – for those with graduate degrees and those with less than a high school education.
"Young single men can expect to receive less than 50 cents on the dollar in most cases."
The final two rows show the benefits per dollar of taxes paid. On the average, most single men will get about 57 cents on each dollar they paid into the system. Those with the highest level of education are expected to receive the highest benefit per dollar paid – but like the others, they will receive less from the system than they pay into it. Married men (with a nonworking spouse) can expect more than a dollar in benefits for each dollar paid into the system, except for those with an undergraduate degree, who can expect 99 cents.
"Those who drop out of high school benefit proportionately more from early death benefits."
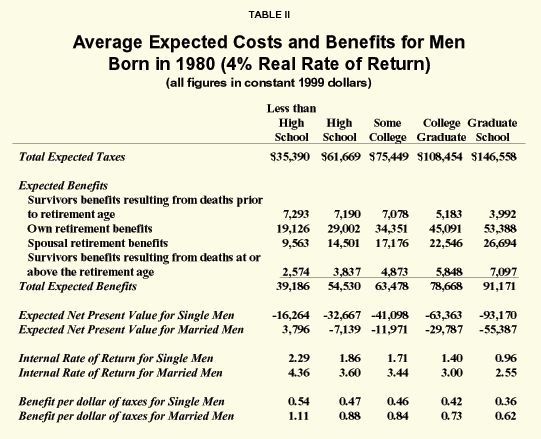
Costs and Benefits for Men Born in 1980. Table II presents the expected taxes and benefits for men born in 1980. The pattern of results for this group is consistent: as the level of education increases, net taxes rise and rates of return and benefits per dollar paid into the system fall.
Total tax payments for those with less than a high school education are about the same for those born in 1980 as those born in 1935. Reflecting the growth in real wages among the most educated, the tax payments for those born in 1980 are 2.5 times the taxes paid by those born in 1935. Further, the expected tax payments for the most educated men born in 1935 are 1.78 times the taxes of the least educated, but for the 1980 birth year their taxes are 4.14 times as much.19
"Workers with graduate degrees benefit proportionately more from Social Security's retirement pensions."
Except for married men with less than a high school education, men at all education levels born in 1980 can expect to pay more in taxes than they receive in benefits.
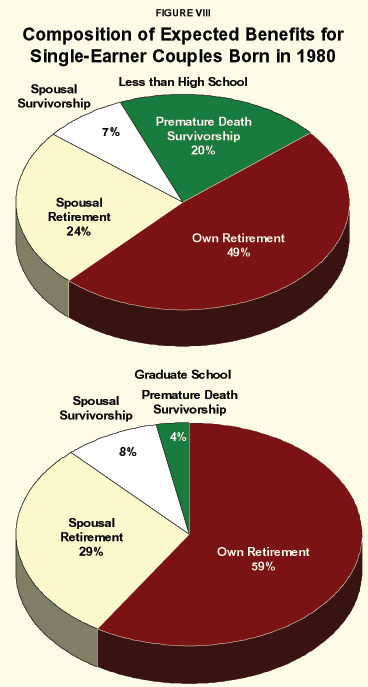
Figure VIII identifies the importance of each type of expected benefit for couples in which the husband is the sole wage earner. Interestingly, the composition of the benefits is only slightly different for workers born in 1980 and those born in 1935.
[page]The "investment" in Social Security has become progressively less attractive over time for all groups of workers. The results we present for single workers (with no dependents) and married workers (with nonworking spouses and dependent children) indicate the range of possible outcomes. The true average outcome falls within this range. However, in the future, fewer and fewer families will make it to retirement with only one earner.
"The 'investment' in Social Security has become progressively less attractive over time."
Regardless of marital status or dependents, it is costly for most workers to participate in Social Security. Groups with negative net present values lose. Except for near-retirees with the lowest levels of education, workers can expect to pay more into the system than they get out of it. For people with negative present values, Social Security represents a net tax on their lifetime earnings.
Further, Social Security's net tax has become larger over time for most family types and most education levels. This suggests that the system redistributes from younger to older generations. Also, for workers of any given age today, regardless of family type, the net tax is larger for those with the most education. Since education level is generally positively correlated with income, this demonstrates that Social Security also redistributes from individuals with high lifetime earnings to those with low lifetime earnings.
NOTE: Nothing written here should be construed as necessarily reflecting thet views of the National Center for Policy Analysis or as an attempt to aid or hinder the passage of any bill before Congress.
[page]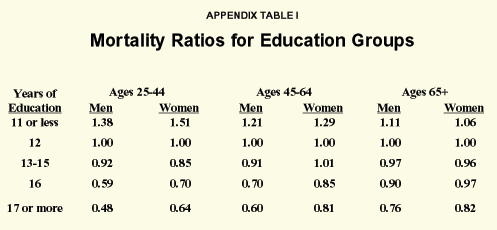
Earnings. Our forecast of future taxable earnings follows a methodology described in Rettenmaier and Saving (2000).20 In short, the real growth rates of the component parts of annual earnings are calculated for each group of workers, where group defines age, education, sex and race. The component parts of annual earnings for a group are the percentage working, their annual hours of work and their hourly wage. Growth rates for each earnings component are estimated using inflation-adjusted data from the Current Population Surveys. Past earnings are deflated using the Personal Consumption Expenditures implicit price deflator.
The calculated real growth rates then become the basis for projecting earnings into the future. In previous work we forecast the earnings subject to the Medicare payroll tax, and since the Medicare tax applies to all labor earnings, historical earnings were not capped at some maximum prior to calculating the growth rates. In the present study, the current Social Security taxable maximum was inflation-adjusted and retrospectively imposed on earnings in earlier years.
Longevity. An excellent source of birth year specific life tables is found in Bell et al. (1992).21 They provide separate life tables for every fifth birth cohort between 1900 and 1990. We initially used their life tables, but for consistency with our analysis of racial groups we use the Census Bureau estimates. The base U.S. Census Bureau life tables are from the 1995, 2005 and 2050 middle series life tables. The tables are organized by single years of age, by sex, by race and by Hispanic origin. They provide expected mortality at each age in the three cross-sections. However, we are interested in the mortality experienced by individuals born in a given year, not mortality in a given year at various ages. To create life cycle mortality tables, we use linear interpolation to fill in the cross-section life tables for intervening years. From the entire set of cross-sectional life tables, we identify the experience of the individuals born in the years under study.
Individuals born in 1935 through 1980 are the focus of our study; therefore, the interpolated Census data results in mortality estimates for those born in 1935 from the age of 60 to the age of 100. For the youngest birth year, 1980, the Census data covers mortality rates between 15 and 70 years of age. Extrapolated data are used for the years 2051 to 2080, which allows for tracking mortality out to the age of 100 for the youngest birth year.
The void for years prior to 1995 is filled using death registration data from Anderson (1998). The death registration data indicate the number of survivors for every fifth year of age at 10-year intervals between the turn of the century and 1996. The data are further partitioned by race and sex. Mortality rates between ages and the years 1940 to 1980 are interpolated to fill in the pre-1995 data, allowing us to complete the set of cross-sectional life tables from which the birth year life tables are constructed.
Transforming the life tables derived from the Census Bureau and death registration data for men and women into education category-specific life tables is accomplished by using the relative mortality estimates of Sorlie and Backlund (1995). They estimated mortality ratios for various classifications of the population according to race, employment status, income, education, marital status and household size. Appendix Table I shows their estimates of the education-specific relative mortality rates. Their findings suggest that less-educated men and women are more likely to die than those with high school educations. At higher ages the education differentials decline, indicating a convergence in mortality among those who survive.
Two things need to be done to obtain applicable mortality ratios. First, the ratios in each age-sex group above are stated relative to high school graduates. This reference group does not correspond to the "average" person in that category, but the mortality rates in general sex-specific life tables do. Therefore, we must first restate the relative mortality rates with reference to the average person in a particular age-sex group. Second, the mortality ratios are estimated for discrete age groups rather than for single years of age. In essence, the ratios above represent an "average" relative mortality rate in age-sex-education category, but for the same reason that the relative mortality differs between the 24-44 age group and the 45-64 age group, the relative mortality should also differ at each age between 25 and 44. See Liu and Rettenmaier (2000) for a detailed discussion of how we arrived at differing mortalities based on education.
By using the constant mortality adjustment by education categories, we implicitly assume that the differences are constant and persistent. In other words, there is no divergence over time in the longevity of high school and college graduates, for example, even though our estimates of life cycle earnings show greater disparity in their wages. The increased disparity in life cycle earnings suggests that there may be greater disparity in longevity estimates based on education. Because the Sorlie and Backlund relative risk ratios reflect a point-in-time difference in mortality, future compositional changes will affect the relative differences, but in these estimates the differences are constant over time. Some of the disparity in outcomes that we report would be dampened by mortality differences that grow over time.
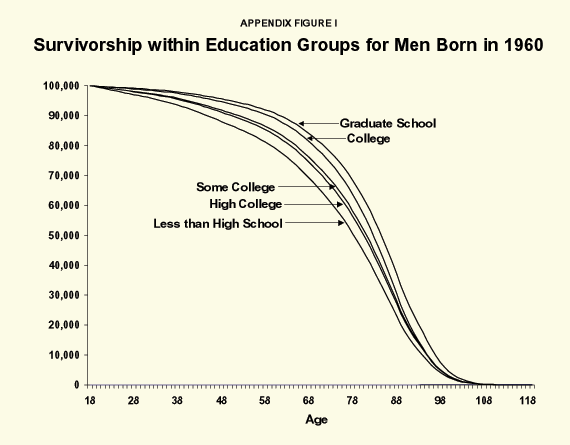
Appendix Figure I presents the survival curves for men born in 1960. Based on the aforementioned education adjustments, we estimate that 70.8 percent of men with less than a high school education, 75.9 percent of high school graduates, 77.5 percent of those with 13 to 15 years of schooling, 82.7 percent of college graduates and 85.2 percent of those with some graduate school are expected to live to age 67.
[page]- Of the total payroll tax of 15.3 percent on employee and employer combined, 10.6 percent is for Old Age and Survivors Insurance. Of the remainder, 1.8 percent is for Disability Insurance and 2.9 percent for Medicare.
- Sylvester J. Schieber and John B. Shoven discuss this argument in The Real Deal: The History and Failure of Social Security (New Haven, Conn.: Yale University Press, 1999), p. 227.
- The birth years are every fifth year between 1935 and 1980. Within each birth year, individuals are further segmented into five education categories: less than high school, high school, some college, college graduates and graduate degrees.
- We deliberately chose education categories because they identify a persistent classification within a birth year. Because the average group member is the unit of observation, average earnings reflect those of all members of a group, including workers and nonworkers. Mortality rates are likewise based on the same reference point. Thus the results we obtain are representative of the outcomes for the average individual in a birth year by education group.
- We use data from 1963 to 1997. Actual average historical taxable earnings for each group are used in those years. A description of how we estimate life cycle earnings for each birth year is found in the Appendix.
- Several previous studies have used annual average Social Security earnings or some multiple or fraction of average earnings to represent the historical and projected experience of workers. Using the average based on all workers, young and old, overestimates earnings when workers are young and underestimates earnings when workers are in their prime earnings years. Using a fraction of the average in each year to represent lower-income workers does not allow for the natural progression of workers through the distribution of earnings over their lives. Using a multiple of the average to represent higher-income workers suffers from the same shortcomings.
- This assumption ignores the redemption of Trust Fund bonds but represents an intermediate case in which each generation bears the burden of financing the shortfall. Redemption of Trust Fund bonds means that the Treasury will have to collect additional revenues in the amount of the shortfall or increase debt, or Congress will have to reduce other government expenditures. Each option spreads the burden of financing Social Security across generations in a different way. Collecting additional general income taxes or reducing other government expenditures makes retirees bear some of the burden. This action effectively reduces their benefits, lowering their returns. The consequences of increasing the explicit debt to finance the redemption of the Trust Fund bonds are more difficult to pin down. In the simplest case, borrowing shifts the burden to future generations. However, if taxpayers are altruistic, that is, they care about their offsprings' future, they will recognize that the issuance of additional debt will burden their children. In that case, they might reduce their own consumption and save in order to leave a larger inheritance. The latter situation results in a tax burden that is equivalent to the case of a general tax increase.
- A description of how we arrive at our mortality estimates is found in the Appendix.
- A detailed description of the methodology can be found in Liu and Rettenmaier (2000).
- We ignore the small death benefit.
- We chose 4 percent as the discount rate because it represents a conservative estimate of the real rate of return workers could receive elsewhere.
- The net present values in Figure II reflect both the historical spreading in the distribution of earnings and our predictions based on the historical data.
- Beginning with individuals born in 1938, the retirement age for full Social Security benefits will increase over time until it reaches 67 for those born in 1960. The retirement age for full benefits for those born in 1938 is 65 years 2 months.
- For purposes of these estimates we have assumed that single and married individuals in each birth year have the same life cycle earnings. This assumption overestimates the earnings for single men – they typically earn less than their married counterparts – and underestimates the earnings of single women, who do not earn less than married women because they have stronger labor force attachment.
- We assume that wives collect benefits on their husbands' accounts. Additionally, we assume postretirement surviving spouse benefits are collected up to the normal life expectancy of women in the same birth year conditional on reaching age 25.
- A couple in which both spouses work would have a net present value that falls between the result for the singles and the married men as defined here.
- The decline is the result of increasing earnings within each education classification. Once the benefit formula is applied to the increased earnings, the replacement rate and the rate of return fall.
- The benefits in the table are those that accrue to a family with two children, born when the worker is age 25, with each child and the surviving spouse collecting benefits.
- Several factors explain the widening lifetime tax payments. One factor is the taxable maximum. The taxable maximums in force between 1953 and 2000, the years those born in 1935 are in the labor force, increased so as to capture an increasing share of the wage distribution. Thus a smaller share of the more highly educated workers' earnings was taxed in past years. Also as noted earlier, the earnings of more highly educated workers have grown relative to those with lesser educations. This more rapid growth is assumed to persist in our projections, and combined with a taxable maximum that keeps pace with earnings growth, the distribution in lifetime tax payments widens.
- See Andrew J. Rettenmaier and Thomas R. Saving , The Economics of Medicare Reform, Upjohn Institute for Employment Research, 2000, for a complete description of how life cycle earnings are forecast for successive birth years.
- Felicitie Bell, Alice Wade and Stephen Goss, "Life Tables for the United States Social Security Area 1900-2080," Actuarial Study No. 107, U.S. Department of Health and Human Services, Social Security Administration, Office of the Actuary, August 1992.
Robert N. Anderson (1998), "United States Abridged Life Tables, 1996," National Vital Statistics Reports, December 24, 1998, Vol. 47, No. 13, Table 4, pp. 11-15.
Felicitie C. Bell, Alice H. Wade and Stephen C. Goss (1992), Life Tables for the United States Social Security Area 1900-2080, Actuarial Study No. 107, U.S. Department of Health and Human Services, Social Security Administration, Office of the Actuary.
Michael J. Boskin, Laurence J. Kotlikoff, Douglas J. Puffert and John B. Shoven (1987), "Social Security: A Financial Appraisal across and within Generations," National Tax Journal 40(3), pp. 19-34.
James E. Duggan, Robert Gillingham and John S. Greenlees (1993), "Returns Paid to Early Social Security Cohorts," Contemporary Policy Issues, 11(4), pp. 1-13.
Stephen Goss (1998), "Problems with Social Security's Rate of Return," http://www. ourfuture.org/institute/stevgoss.asp.
Liqun Liu and Andrew J. Rettenmaier (2000), "The Social Security Investment," Private Enterprise Research Center Working Paper #0006.
Andrew J. Rettenmaier and Thomas R. Saving (2000), The Economics of Medicare Reform, Upjohn Institute for Employment Research.
Paul D. Sorlie and Eric Backlund (1995), "U.S. Mortality by Economic, Demographic and Social Characteristics: The National Longitudinal Mortality Study," American Journal of Public Health, 85(7), pp. 949-56.
U.S. Bureau of the Census, Population Division (1996), Population Projections of the United States by Age, Sex, Race, and Hispanic Origin: 1995 to 2050 – Middle Series, Vital Rate Inputs.
[page]Dr. Liqun Liu is an Assistant Research Scientist at the Private Enterprise Research Center at Texas A&M University. His primary research areas are taxation analysis and evaluation of government expenditures. His current focus is on the effects of reforming elderly entitlements. Dr. Liu serves as an investigator on several research grants at PERC. He has papers published or accepted for publication in National Tax Journal, Economic Inquiry, Journal of Institutional and Theoretical Economics and Review of Economic Design. He also has served as a referee for Economic Inquiry and has presented his research at many academic and public policy conferences.
Dr. Andrew J. Rettenmaier is a Research Associate at the Private Enterprise Research Center. His primary research areas are labor economics and public policy economics. Dr. Rettenmaier and the Center's Director, Thomas R. Saving, have presented their Medicare reform proposal to U.S. Senate subcommittees and to the National Bipartisan Commission on the Future of Medicare. Their proposal has also been featured in the Wall Street Journal, New England Journal of Medicine, Houston Chronicle and Dallas Morning News. Dr. Rettenmaier is the co-principal investigator on several research grants and also serves as the editor of the Center's two newsletters, PERCspectives on POLICY and PERCspectives. He is co-author of a book on Medicare, The Economics of Medicare Reform, and is an editor of Medicare Reform: Issues and Answers, which is forthcoming from the University of Chicago Press.