This report compares two alternative uses of the Social Security surpluses.
The plans differ in the way they dispose of projected Social Security surpluses over the next decade. Under both plans, the surpluses will vanish about the time the baby boom generation begins to retire. Moreover, because of other entitlement obligations, higher taxes will be needed beginning in the third decade of this century – no matter which plan is adopted.
However, how we dispose of the surplus today has a large impact on the solvency of Social Security during the years when today's young people will be drawing their retirement benefits.
Under one alternative, the surpluses are used to allow workers to invest some of their payroll taxes in personal retirement accounts (PRAs). We estimate that the total investment will equal about 2 percentage points of taxable payroll for the next 10 years. These funds will be invested in private securities, earning a much higher rate of return than the rate implicitly promised by Social Security. We assume that total benefits will continue to be paid as scheduled but that the growth of the private accounts will substitute for the government's obligations to pay benefits – thus reducing the need to raise payroll taxes in future years:
- Using the Congressional Budget Office's long-term forecasts, we find the payroll tax needed to pay benefits under the current system will rise from about 12.4 percent today to approximately 19 percent by the year 2050.
- However, with personal retirement accounts, Social Security obligations can be met in the year 2050 with about the same payroll tax that we have today.
The other alternative is to use the surplus to pay down government debt and use the interest savings (from lower debt) to pay benefits in the future years. Under this plan:
- By the year 2022, the government will have to start borrowing again.
- By the year 2029, we will have the same debt that we have today.
From that point forward, we have to make some assumptions about how the government will meet its obligations. We considered two options:
- Under Scenario One, the government maintains the same debt as it has under the PRA plan and increases taxes to meet its spending obligations.
- Under Scenario Two, the government raises taxes to match the PRA tax burden and borrows to fund any additional obligations.
Under Scenario One:
- The payroll tax will have to rise to 19.6 percent by the year 2050 (compared to 12.5 percent under the PRA plan).
- The payroll tax will have to rise to 21.3 percent by 2070 – almost twice the tax rate needed under the PRA plan.
To put this in perspective, if the burden of Medicare (parts A and B) is also expressed as a percent of payroll, the total burden of elderly entitlements under this plan will be 34.8 percent in 2050 and 37.3 percent in 2070. Thus, future workers will have to pay more than one-third of their income in taxes if promises to today's young people are to be kept.
Under Scenario Two:
- By the year 2050, the country will have four times as much debt as it will have under the PRA plan.
- By the year 2070, the country will have 35 times as much debt as it will have under the PRA plan.
Thus, although paying down debt initially frees us from government's outstanding debt, in the long run we end up with much greater debt because nothing has been done to solve the structural problem of Social Security.
[page]A surplus is political manna, enabling politicians to fund their favorite programs. Proposals offered during the presidential campaign included such noble causes as strengthening Social Security, making America debt free, improving health care, cutting taxes and providing prescription drug benefits under Medicare, to name a few. How these goals are pursued would produce markedly different fiscal results. The central issue in the debate boils down to how the Social Security surpluses are used, because how they are spent today determines the magnitude of tomorrow's surpluses.
The fundamental choice is between using the Social Security surpluses to reduce the federal debt and using them to prepay future Social Security benefits. All other policy choices derive from this choice. Thus, the bulk of our analysis deals with the choice between retiring debt and prepaying future benefits.
[page]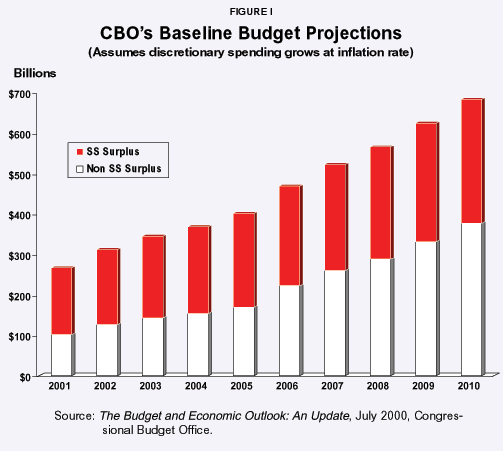
In July of this year, the Congressional Budget Office (CBO) issued three new estimates of federal finances, updating its earlier estimates with an even rosier picture of the future. The CBO projects that between 2001 and 2010, the federal government will collect between $4.6 trillion and $5.8 trillion more than it spends.1
"The fundamental choice is between using Social Security surpluses to pay down the debt and using them to prepay future benefits."
Figure I presents the CBO's most conservative estimates of the budget surplus between now and 2010. Like the other two forecasts, federal tax collections remain steady at about 20 percent of gross domestic product (GDP). In this estimate, discretionary spending on things like national defense is assumed to grow at the rate of inflation after 2000. As a result, discretionary spending falls from 6.2 percent to 5.2 percent as a share of GDP between 2000 and 2010. The other category that contributes significantly to the overall size of the surplus is the spending on interest payments.
- From 2000 to 2010 interest payments as a percentage of GDP fall from 2.3 percent to 0.4 percent.
- Over the same period the cumulative surplus will total at least $4.6 trillion.
- Of that total the Social Security surplus accounts for $2.4 trillion and the non-Social Security surplus for the remaining $2.2 trillion.
In the CBO's forecasts, the total budget surplus in each year – the combination of non-Social Security and Social Security surpluses – is used to pay down the existing federal debt held by the public.2
[page]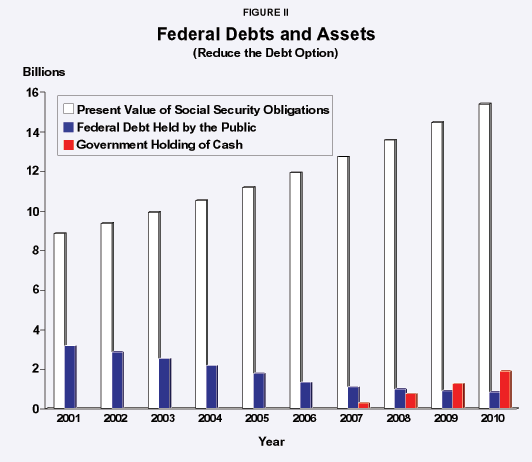
"The bonds in the Social Security Trust Fund are merely promises to impose taxes on future taxpayers."
Preserving the Social Security surplus for Social Security involves more than just depositing the funds into the trust fund. The bonds in the Trust Fund are merely promises to impose taxes on future taxpayers. As pointed out by both the Congressional Budget Office and the Office of Management and Budget, to redeem the bonds in the trust fund the government must raise taxes, reduce other expenditures or borrow. [See the sidebar.] The only way the surplus funds can contribute to future Social Security expenditures is by enhancing the future availability of consumption. We can do this by using any surplus to expand the nation's capital stock, thus increasing the country's ability to produce. Essentially, there are three options. Social Security's surpluses can be used (1) to pay down debt, (2) to invest in private capital markets using a single centrally held account or (3) to invest in capital markets via personal retirement accounts.3
Many are attracted to allowing workers to invest part of their Social Security taxes in personal retirement accounts. Upon retirement, the funds in these private accounts would pay for part or all of the promised Social Security benefits. If the contributions to private accounts are implicitly funded by the Social Security surplus, they will increase the nation's stock of productive assets, which will increase the nation's future income.
Paying down the national debt and establishing personal retirement accounts have similar economic consequences. Both actions inject new funds into the capital market. Regardless of what security is initially purchased – a government bond, a private bond, a private security, etc. – the injection of new funds expands the economy's capacity to create new capital (i.e., new machines, buildings, computers, etc.).
"Explicit debt — bonds held by the public — is estimated to be $3.4 trillion."
Explicit and Implicit Debt. There are two types of federal government debt. First, explicit federal debt in the form of bonds held by the public is estimated to be $3.4 trillion. This debt is backed by the full faith and credit of the U.S. government. A second type of debt is implicit. Examples are future promises to pay benefits under such programs as Social Security and Medicare. These promises are not backed by the full faith and credit of the government, and the Supreme Court has ruled that future Congresses are not bound by the promises of past Congresses. Nonetheless, many view these programs as establishing a political contract between generations. Reneging on such promises is likely to carry a heavy political cost.
Explicit debt has two bad consequences. First, it crowds out private investment. Every dollar borrowed by government in the credit market is a dollar not available for private borrowers. Second, explicit debt incurred today creates a burden for taxpayers tomorrow. And the act of collecting those taxes will likely discourage work, saving and investment, thus leading to another undesirable economic consequence.
In many respects implicit debt has some of these same economic effects. For example, Social Security's promise to pay future benefits reduces the incentive of today's workers to save. And the payroll tax collected to pay benefits to today's retirees reduces the ability of today's workers to save. In addition, as with explicit debt, implicit Social Security debt implies a higher tax burden on future generations.
We have chosen to define implicit Social Security debt as the present value of the system's accrued liabilities.4 In making this calculation we used a 5.5 percent real interest rate rather than the real government borrowing rate of 2.8 percent. The higher interest rate reflects the fact that this debt is not backed by the full faith and credit of the federal government and hence its payment is less certain than the government's redeeming of a bond.5 The appendix details our calculation of implicit debt.
"Even when explicit debt is paid off, the towering Social Security debt will keep growing."
Figure II presents the estimated implied Social Security liability in current dollars alongside the CBO's most conservative estimates of the debt held by the public and cash holdings under the assumption that the total surplus is used to reduce the explicit debt. In 2001 the implicit Social Security liability is estimated to be $8.8 trillion, or 86 percent of GDP. By 2010 the amount grows to more than $15 trillion, which is about equal to estimated GDP in that year. This debt, together with the debt held by the public less any government cash holdings, is the total indebtedness of the federal government. As seen in the figure, under the reduce-the-explicit-debt option, by 2009 the government's cash holdings will exceed the remaining government debt held by the public, so the government will no longer be in debt as "debt" is normally calculated. But despite the absence of explicit debt, the towering Social Security debt will keep growing.
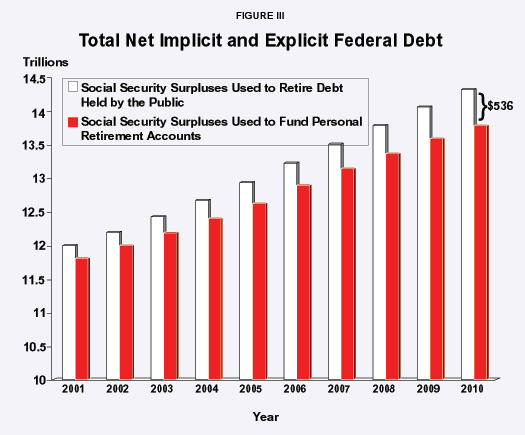
"Using Social Security surpluses to invest in stocks and bonds results in a total debt that is $536 billion less than if they are used to reduce debt."
Illustrating the Alternatives. Figure III shows the relative size of the combined implicit and explicit debts of the federal government under the two debt reduction options. The white bars show the path of total debt when Social Security and non-Social Security surpluses are used for debt reduction. The bars are the sum of the debt held by the public and the implicit Social Security debt less any accumulated cash. The CBO estimates that beginning in 2007 the government will have paid off all the mature debt instruments and will begin to hold cash assumed to earn the rate of return on Treasury notes. The black bars show the path of total debt when Social Security surpluses are invested in stocks and bonds and the resulting non-Social Security surpluses are dedicated to debt reduction. The lower total debt is defined as the sum of debt held by the public and implicit Social Security debt less the accumulated balances in personal retirement accounts. As indicated in the figure, using Social Security surpluses to invest in stocks and bonds results in a total debt that is $536 billion less than if the surpluses are dedicated solely to reducing debt held by the public.
"Under the pay-down-the-debt option, the government is debt free by 2013 and runs a surplus until 2022."
Why does the investment-in-assets option produce better results than paying down debt? Because of the difference between the historical average return on a representative portfolio of stocks and private bonds (5.5 percent) and the interest rate on government borrowing (2.8 percent). By not paying down debt, the government is effectively "borrowing" at a 2.8 percent rate of interest; by using the same money to invest in assets, it is replacing future Social Security obligations with assets that earn 5.5 percent per year.6 In other words, taking advantage of this "risk premium" plays a central role in our analysis.
To summarize, both the paying-down-debt option and the investing-in-assets option will increase the capital stock and add to the nation's means of production. However, investing in the private market has the additional advantage of improving the government's fiscal position relative to pure debt reduction.7
[page]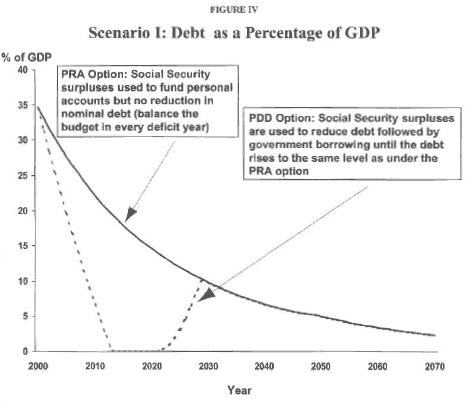
"Beginning in 2022 the government must either raise taxes or issue debt to balance the budget."
8Under the pay-down-the-debt option the government is debt free by 2013 and runs a surplus until 2022. Beginning in 2022 it must either raise taxes or issue debt to balance the budget. By 2029 the debt levels are the same under the two alternatives. Beyond 2029 we assume that taxes rise to balance the budget. By 2029 we will have the same debt that we have today. At this point, we have to make some assumptions about how the government will meet its obligations. We consider two options:
- Under Scenario One, the government maintains the same debt as it has under the PRA plan and increases taxes to meet its spending obligations.
- Under Scenario Two, the government raises taxes to match the PRA tax burden and borrows to fund any additional obligations.
"By 2029, the debt levels are the same under two alternatives."
Scenario I: Both Alternatives Hold the Same Long-Term Debt. As noted above, under the personal retirement account option Social Security surpluses are invested rather than used to pay down debt. As a result, we assume the nominal debt stays at its 2000 level. This debt as a percent of GDP is depicted by the solid line in Figure IV. The dashed line identifies the debt in the case in which the Social Security surpluses are used to retire debt. As illustrated in the figure, we allow the debt to rise to the same level as in the case in which the surpluses are used to fund PRAs.
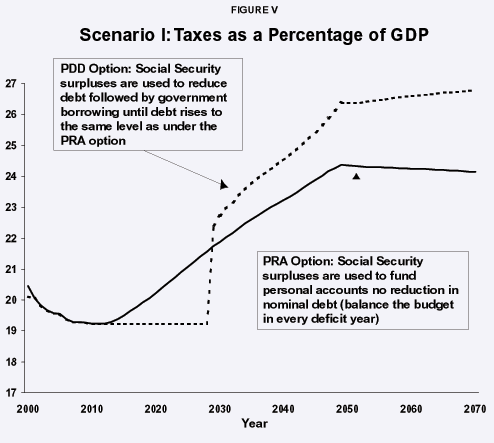
The tax schedules for the two scenarios are presented in Figure V. With PRAs, beginning in 2013 taxes must rise to balance the budget. Taxes will be higher under the PRA option until 2028, but beginning in 2029 and thereafter the pay-down-the-debt tax rates are higher. The abrupt increase in the pay-down-the-debt tax level in 2029 is the result of allowing the government to borrow between 2022 and 2029 to fund its fiscal deficit, but then requiring a balanced budget thereafter. The tax rates under the debt retirement option are higher because of treating Social Security separately. We can do this as long as the system is made solvent by taking the surpluses and investing them in private securities. Based on the CBO's forecasts of expenditures and our estimates of revenues including the constant interest payment, a real rate of return of 5.37 percent is required to make the system solvent.9 Given that this rate of return is close to the long-term market return, it is feasible to treat Social Security separately without need for tax collections above projected levels.
"If the surpluses are used to retire debts, the tax rate on payroll will rise to 18.8 percent."
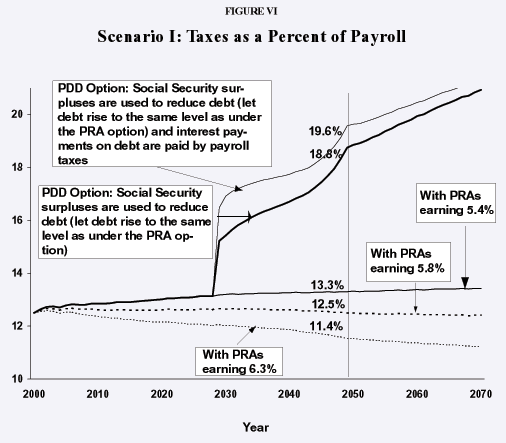
As Figure VI shows, with the PRA option – assuming a real market rate of return average of 5.4 percent – tax revenues as a percent of payroll will be roughly equal to the income rates reported by the Social Security trustees. In 2050 that rate is 13.3 percent. However, if the surpluses are used to retire debt, no savings are available to offset some of the expenses of the system, and the tax rate on payroll will rise to 18.8 percent. Furthermore, if payroll taxes are used to pay the interest on the debt, the tax rate will have to be 19.6 percent.
"With the pay-down-the-debt option, by 2050 the country will have four times as much debt as with the personal retirement account option."
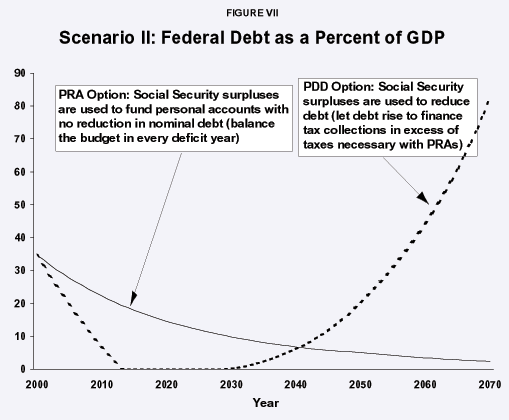
Scenario II: Both Alternatives Have the Same Long-Term Tax Rate Figure VII illustrates the second comparison of alternatives. This comparison treats the establishment of PRAs in the same way as in Scenario I. However, for the pay-down-the-debt option we assume that taxes are allowed to rise to the same levels as under the PRA option. Deficit financing is then used when the required revenues under the pay-down-the-debt option exceed those under the PRA option. As depicted in the figure, the debt under the PRA option follows the same schedule as before. The debt under the pay-down-the-debt option is identical to the debt shown in Figure IV until 2020, but in this case, rather than letting the debt rise to cover the shortfall, we let taxes rise until they are the same as taxes in the PRA option. Beginning in 2029 debt rises to cover the differential. From 2000 to 2040 the debt level is lower under the pay-down-the-debt option, but it is higher in subsequent years. By 2050 debt is 20 percent of GDP, compared to only 5 percent with the PRA option.
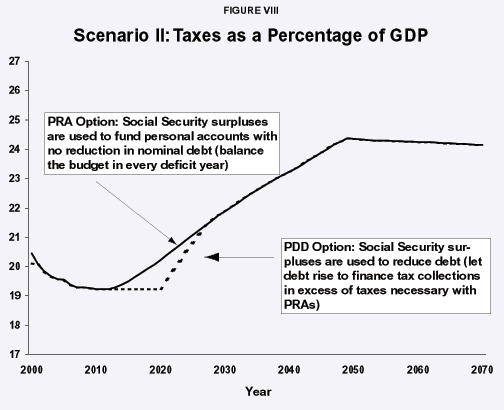
Figure VIII depicts the tax rates under the two options. From 2000 to 2029 taxes under the pay-down-the-debt option are less than or equal to taxes in the PRA option. From 2029 on, the tax schedules are the same, with deficit financing funding the shortfall between the two schedules of required taxes.
"The higher market rates of return and the sheer ability to save account for the superiority of the personal retirement account option."
As both comparisons indicate, in the long run prepaying Social Security benefits using the current Social Security surpluses has advantages over paying down the debt. The differences arise because individuals use their PRAs to help fund their Social Security benefits. The higher market rates of return and the sheer ability to save, as opposed to the government's inability to save, account for the superiority of the PRA option.
"Prepaying Social Security benefits with personal retirement accounts directs Social Security taxes toward their intended purpose."
The first question that must be addressed in the debate over the budget surplus is whether the Social Security surpluses should be used to pay down the debt held by the public or to prepay Social Security benefits. We limited our analysis to this question. How any non-Social Security surpluses are spent is another matter. We have suggested that prepaying Social Security benefits with personal retirement accounts is the best use of the Social Security surpluses. This directs Social Security taxes toward their intended purpose – to fund retirement benefits – rather than toward paying down debt. Establishing personal retirement accounts also gives back a share of the surplus to the taxpayers. Over the long run, investing the Social Security surpluses in stocks and bonds will enhance the government's fiscal position relative to using the surpluses to reduce the debt held by the public. Further, prepaying part of Social Security's future expenditures reduces the required payroll tax relative to maintaining the status quo.
To honor the commitments made to Social Security participants, we must acknowledge that these commitments are as much real debt as is the recognized national debt. Hence, in assessing the government's fiscal position under the alternative policy options for the Social Security surplus, we should look at their respective impact on both explicit and implicit debts, both on- and off-budget.
"The government will not improve its fiscal position more by using the Social Security surplus to pay down debt."
As we have seen, the total budget surplus is composed of the Social Security surplus and the non-Social Security surplus. How Social Security surpluses are spent affects the future sizes of non-Social Security surpluses. Using Social Security funds to retire the debt held by the public reduces interest payments and thereby increases the amounts that can be spent on tax cuts and spending initiatives. However, this does not mean the government's fiscal position would improve more by using the Social Security surplus to retire the explicit debt instead of allowing private retirement accounts. Although setting up private accounts will not have direct impact on the on-budget position, it will reduce future off-budget deficits.
"If private accounts are funded, Congress will have a hard time taking this investment opportunity away."
Both funding private accounts and paying down the national debt are splendid ideas that will enhance the nation's capital stock and ensure greater output in the future. However, the economic consequences of the two options really rely on their differing levels of credibility. As workers see their personal accounts grow, they will expect the opportunity to make the same investment next year. Congress will have a hard time taking this freedom away. But if Congress decides to spend some of the surplus rather than paying down the debt, few taxpayers will notice and the potential for increased national income simply will evaporate.
NOTE: Nothing written here should be construed as necessarily reflecting the views of the National Center for Policy Analysis or as an attempt to aid or hinder the passage of any bill before Congress.
[page]- The surplus estimates vary in accordance with assumptions concerning growth in discretionary spending on such items as national defense. More importantly, surplus estimates depend on using the surpluses in the early years to reduce government debt.
- The CBO notes that the reduction in debt held by the public is not exactly equal to the budget surplus. The reasons include changes in the government's cash balances and other borrowing requirements. From the projection in which discretionary spending grows at the inflation rate, the total surplus in 2000 is expected to be $232 billion, with the debt reduced by $224 billion. Also, beginning in 2007 a new line item representing accumulated excess cash appears in the projections. In 2007 $281 billion in cash is held in this account, and $1,081 billion in debt remains outstanding because not all of the debt is available for redemption at that time. Subtracting the excess cash account from the publicly held debt identifies the net explicit government indebtedness. By 2009 the accumulated excess cash is $1.2 trillion; the debt held by the public is $887 billion and the government is out of debt. If the Social Security surpluses are taken off-budget from this day forward, in the sense that they are invested in real assets like stocks and bonds, they are no longer available to reduce the debt and thereby reduce the interest payments that service the debt. It is typically stated that Social Security surpluses are being used to pay down national debt, but because money is fungible, we could equivalently say that the Social Security surpluses are being used to fund national defense and that general revenue funds are being used to pay down the debt.
- Instead of or in addition to investing in domestic equity markets, we could invest in other nations' capital or bonds. In either case, when we need additional output to allow workers to continue to enjoy the fruits of their labor – while at the same time providing for the growing number of retirees to maintain their standard of living – we could use the increased domestic or foreign output. Whether we invest in our nation's capital or that of other nations, real investments produce real income. Alternatively, the Social Security surplus can be invested in domestic government bonds, in paying current publicly held federal debt or in buying the debt of other countries. When Social Security expenditures begin to exceed revenues, the real assets in the Trust Fund can be sold. If these assets consist of equities, the Trust Fund will be selling their ownership of corporate America back to the public. If the assets consist of federal government bonds previously held by the public, the sale of these bonds will bring the publicly held debt back to its former level. If the assets consist of the bonds of foreign governments, the additional resources will come from those foreign nations.
- This definition differs from the concept of Social Security wealth as defined by Feldstein (1974). In that definition Social Security wealth is the sum of the net promises, in terms of the present value, to all the participants of the system. It is the difference between the present values of retirement benefits for the adult population and the present values of lifetime payroll taxes. In 1995 this net liability was estimated to be $7 trillion [Feldstein(1998)].
- Past changes to the program such as taxing benefits, increasing the retirement age and raising the taxable maximum are evidence of uncertainty. Current proposals to further increase the retirement age and to raise the taxable maximum make the returns earned by current and future taxpayers appear even more uncertain.
- This does not rule out the possibility that in any particular year the return on stocks and private bonds may fall below the interest rate on government borrowing. Indeed, MaCurdy and Shoven (1999) show that for a 10- or 20-year period, government bonds outperform a typical stock portfolio 25 percent of the time.
- In either case, the correct measure of additions to the capital stock is the capitalized value of the budget surpluses.
- The analysis that follows is based on the CBO's Long-Term Budget Outlook released on October 6, 2000. The CBO presents three forecasts that differ by how the budget surpluses are used. The most optimistic variant assumes that the total surpluses are saved. For this forecast, all surplus funds are used to pay down the federal debt. Once the net debt is retired in 2008, the government is assumed to hold assets that earn a rate of return equal to that earned on Treasury securities. Under this scenario, by 2030 the government holds assets equal to 49.5 percent of GDP. These asset holdings are used to finance future expenditures and persist until 2050. From then, new debt must be issued or taxes raised above their projected levels. The intermediate variant assumes that only Social Security surpluses are saved and used to retire debt and then buy assets once debt is zero. Under this scenario the net debt is zero by 2013. Between 2013 and 2027 the government holds assets, growing to 7.2 percent of GDP by 2020. By 2027 the assets are exhausted to cover deficits. The least optimistic variant assumes that none of the surpluses are saved, and all are spent on new programs or used to cut taxes. In this case the nominal debt held by the public does not rise and thus declines as a share of growing GDP. We use the intermediate variant as the baseline for our forecasts. We obtained the annual revenue and expenditure estimates from the CBO based on their "Save the Off-budget Surpluses" assumption. The CBO's annual series ends in 2049. The appendix describes how the forecasts are extended to the year 2070. We modify the CBO's forecast in one significant way: we assume that government does not hold assets. We make this adjustment due to the historical aversion to government holdings of financial assets. In the surplus years we assume either that taxes are cut or that surpluses are used on temporary spending programs.
- Over the duration of the CBO's long-term forecasts, until 2049, their estimates of Social Security expenditures are less than the Trustees. We calculated the rate of return that would be required to make the system solvent using both the CBO's and the Social Security Administration's forecasts. We calculate that a real rate of return of 5.37 percent is required to make the system solvent indefinitely using the CBO's forecasts and that a real rate of return of 6.29 percent is necessary to make the system solvent using the Social Security Administration's forecasts. Again, we assume that a constant interest payment is paid from the rest of the budget to Social Security based on the Trust Fund interest payment in 2000. For consistency with the rest of the expenditure projection we use the CBO's forecast. See the appendix for further details.
Auerbach, Alan J. "Quantifying the Current U.S. Fiscal Imbalance." National Tax Journal, 50:3:387-98.
Auerbach, Alan J., and Gale, William G. "Perspectives on the Budget Surplus." National Bureau of Economic Research, Working Paper 7837, August 2000.
Congressional Budget Office. The Budget and Economic Outlook: An Update. Congressional Budget Office, July 2000.
Congressional Budget Office. The Long-Term Budget Outlook: An Update. Congressional Budget Office, December 1999.
Kotlikoff, Laurence J. "Privatization of Social Security: How It Works and Why It Matters." IED Discussion Paper Series 66 (October 1995).
Feldstein, Martin, Editor. Privatizing Social Security. Chicago, Ill.: University of Chicago Press, 1998.
Feldstein, Martin. "Social Security, Induced Retirement, and Aggregate Capital Accumulation." Journal of Political Economy 82 (1974): 905-26.
MaCurdy, Thomas E., and Shoven, John B. "Asset Allocation and Risk Allocation: Can Social Security Improve Its Future Solvency Problem by Investing in Private Securities?" National Bureau of Economic Research, Working Paper 7015, March 1999.
Office of Management and Budget, Executive Office of the President. Budget of the United States Government: Analytical Perspectives Fiscal Year 2000. Washington D.C.: U.S. Government Printing Office, 1999.
Rettenmaier, Andrew J., and Saving, Thomas R. "The Economics of Medicare Reform." Kalamazoo, Mich.: Upjohn Institute for Employment Research, 2000.
Social Security Administration, Board of Trustees. The 2000 Annual Report of the Board of Trustees of the Federal Old-Age and Survivors Insurance and Disability Insurance Trust Funds, March 2000.
[page]
Social Security's Accrued Liability
The following equation identifies our estimate of Social Security's accrued liability at a point in time:
Accrued liabilities are equal to the present value of the benefits that all currently living taxpayers and retirees are expected to receive based on their earnings up to the year of the calculation. It is similar in concept to the method Kotlikoff (1995) suggested for crediting workers for their participation in Social Security. In the equation i identifies birth year, y0 is the starting year of the calculation, and r is the real rate at which future benefits are discounted. Nit represents the number of individuals born in year i who are alive in year t. Bit is the average benefit based on earnings up to year y0 received in year t by individuals born in year i. Because this calculation is based on accrued benefits it depends on earnings histories and is thus independent of earnings projections and future tax policy.
In practice the benefit calculation and the number of individuals are further separated into sex and education categories. Elsewhere we have presented our methodology for projecting Social Security taxable earnings by birth year, sex and education categories (Rettenmaier and Saving (2000)). For individuals born in 1933 and later, the benefits are derived from our earnings projections using the scheduled benefit formula. For individuals who retire in the future, zeros enter their earnings history between year y0 and their years of retirement. For older workers the benefits are taken from the average benefits reported Table 5.A1 in the 1997 Annual Statistical Supplement. The data include the average benefits for men and women by age and by type of benefit for retired workers, wives, and widows. Benefit amounts are converted to y0 using the Social Security Trustees intermediate estimate price level changes and are discounted to y0 using a real discount rate of 5.5 percent. Population is from the Census Bureaus middle series projection.
Extending the Budget Forecast to 2070
At the beginning of October the Congressional Budget Office released its long-term budget forecasts. The variant of the forecasts used here is referred to as the "Save the Off-Budget Surpluses" assumption. The CBO provides annual estimates out to 2049 of Gross Domestic Product (GDP) and federal tax receipts and the various expenditure categories as a percent of GDP. Federal debt held by the public and net interest payments also are provided. Beyond 2049 we assume that tax receipts, federal consumption expenditures and other expenditures retain the same share of GDP they had in 2049. GDP is estimated by letting GDP per worker grow at the rate of growth that existed over the last 20 years of the CBO forecast. The GDP estimates beyond 2049 are equal to the GDP per worker multiplied by the number of workers. The number of workers is obtained from the 2000 Trustees Report. Medicare and Social Security expenditures beyond 2049 are calculated by estimating expenditures per beneficiary by applying the growth rates in per beneficiary expenditures derived from the CBO's forecasts. Total Social Security or Medicare expenditures are obtained by multiplying the number of beneficiaries by the per-beneficiary estimates. Finally, total Medicaid expenditures are assumed to grow at the same rate as the Medicare expenditures.
[page]Dr. Liqun Liu is an Assistant Research Scientist at the Private Enterprise Research Center (PERC) at Texas A&M University. His primary research areas are taxation analysis and evaluation of government expenditures. His current focus is on the effects of reforming elderly entitlements. Dr. Liu serves as an investigator on several research grants at PERC. He has papers published or accepted for publication in National Tax Journal, Economic Inquiry, Journal of Institutional and Theoretical Economics and Review of Economic Design. He also has served as a referee for Economic Inquiry and has presented his research at many academic and public policy conferences.
Dr. Andrew J. Rettenmaier is a Research Associate at the Private Enterprise Research Center. His primary research areas are labor economics and public policy economics. Dr. Rettenmaier and the Center's Director, Thomas R. Saving, have presented their Medicare reform proposal to U.S. Senate subcommittees and to the National Bipartisan Commission on the Future of Medicare. Their proposal has also been featured in the Wall Street Journal, New England Journal of Medicine, Houston Chronicle and Dallas Morning News. Dr. Rettenmaier is the co-principal investigator on several research grants and also serves as the editor of the Center's two newsletters, PERCspectives on POLICY and PERCspectives. He is coauthor of a book on Medicare, The Economics of Medicare Reform, and is an editor of Medicare Reform: Issues and Answers, which is forthcoming from the University of Chicago Press.
Dr. Thomas R. Saving is the Director of the Private Enterprise Research Center at Texas A&M University. A University Distinguished Professor of Economics at Texas A&M, he also holds the Jeff Montgomery Professorship in Economics. Dr. Saving is a newly named trustee of the Social Security and Medicare Trust Funds. His research has covered the areas of antitrust and monetary economics, health economics, the theory of the banking firm and the general theory of the firm and markets. He has served as a referee or as a member of the editorial board of the major U.S. economics journals and is currently an editor of Economic Inquiry. Dr. Saving has authored many articles and two influential books on monetary theory. He has been president of both the Western Economics Association and the Southern Economics Association. After receiving his Ph.D. in Economics in 1960 from the University of Chicago, Dr. Saving served on the faculties of the University of Washington and Michigan State University, moving to Texas A&M in 1968. Dr. Saving served as chairman of the Department of Economics at Texas A&M from 1985-1991.