In less than a decade, members of the baby boom generation will begin reaching their retirement years. At that time, 77 million people will begin to leave the labor market. They will cease to be taxpayers and begin to receive Social Security and Medicare benefits. This will mark the beginning of an enormous conflict over resources. Indeed, it is probably no exaggeration to say that we are approaching generational warfare.
By the year 2030 – the midpoint of the baby boomer retirement years – the cost of elderly entitlement programs will be about double what it is today, relative to the national income. That means we will either have to double the payroll tax rate (currently 15.3 percent) or cut every benefit in half. If politicians refuse either to raise taxes or cut benefits, they will be forced to borrow – piling up a debt that will escalate each year. Beyond 2030, the financial crisis will continue to worsen indefinitely.
One way to appreciate the emerging conflict of economic interests is to compare the young and the old today. Seniors can forget about past taxes, since those are sunk costs. From here on out, they will receive far more benefits from government transfer programs (programs that redistribute resources among groups) than their share of the national tax burden. On average:
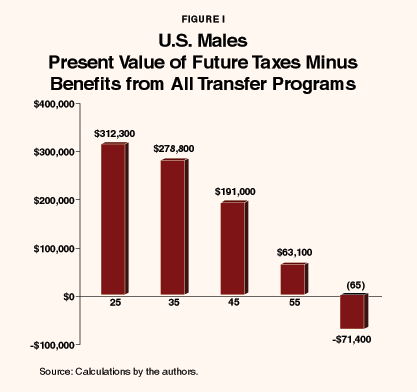
- A male reaching 65 years of age today can expect to receive $71,000 more in government "transfer" benefits (of all kinds at both the federal and state levels, but mainly from Social Security and Medicare) than he will pay in taxes (of all kinds at both the federal and state levels) before he dies.
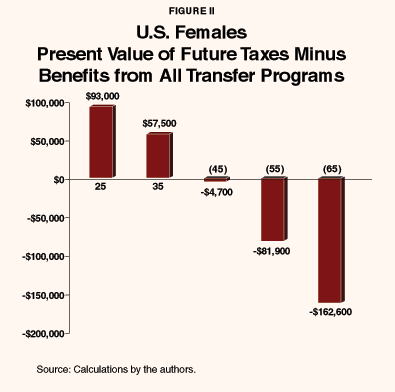
- A 65-year-old female can expect a net gain of more than twice that amount; she can expect $163,000 more in benefits than she will pay in taxes.
Small wonder that seniors continue to push for an expansion of the Social Security and Medicare programs!
A far different picture confronts people entering the labor market today. In general, they will pay far more in taxes than they will receive from transfer programs, and any expansion of elderly entitlements will make things worse. For example:
- A 20-year-old female can expect to pay $92,000 more in taxes than she will receive in transfer benefits over her lifetime.
- The future looks more than three times as bleak for her male cohort, who can expect to pay $312,000 more in taxes than he will ever receive in benefits.
The technique of measuring the expected taxes each age group will pay net of transfer benefits they can expect to receive is called generational accounting. These generational accounts measure how much each group is contributing to the cost of government. For example:
- An American born today can expect to pay 17.7 percent of his or her lifetime income over and above any transfer benefits he will receive.
- Bad as that may seem, the burden will be much worse for those born in the future.
- Grouping together all Americans not yet born, future generations can expect to pay 35.8 percent of their income over and above any transfer benefits – more than twice the tax rate today's newborns will face.
These numbers reflect current policies that are designed to shift the cost of benefits from Americans now living to those not yet born. Despite the current focus on government surpluses, elderly entitlement programs are generating a huge implicit debt that future generations will have to pay off. Put another way, we are borrowing from our grandchildren and their children without their consent.
What will happen if we do nothing, if we do not change tax rates or benefits? The burden awaiting future taxpayers will grow rapidly. For example:
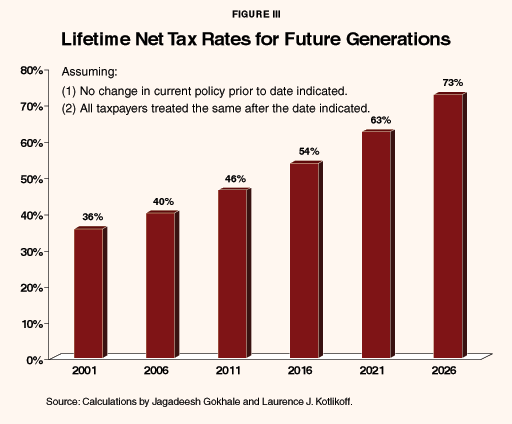
- If there is no change in elderly entitlement programs for the next 5 years, the net tax burden on all future generations combined will climb to 40 percent of their lifetime income.
- With no change in policy for 10 years, the lifetime net tax rate for future generations will reach 46 percent.
- After 20 years of no change in policy, future taxpayers will face lifetime tax rates of 63 percent.
Clearly, we are on an unsustainable path.
So what can we do? We can and must act immediately to correct the long-term funding crisis in Social Security and Medicare. Although the Social Security and Medicare trustees say the two programs are underfunded by about 3.3 percent of payroll, the situation is actually about three times worse. Indeed:
- We need an immediate and permanent increase in saving and investment equal to 10 percent of payroll.
- These funds need to be invested in interest-earning assets that can be sold in future years to pay benefits.
- The government can't use the presence of these funds (the fact that there would be a larger surplus) as an excuse to increase its purchases, raise Social Security or other benefit payments or cut other taxes.
Are there other ways to achieve generational equity that don't involve raising payroll taxes? Yes, but they are no less unpleasant. Specifically, generational equity could be achieved by:
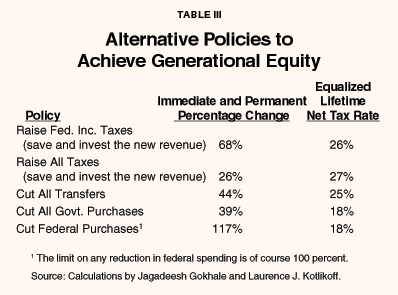
- Increasing federal income taxes by 68 percent or all (federal and state) taxes by 25 percent and investing the additional proceeds!
- Cutting by 44 percent government transfer payments, including Medicaid, food stamps and welfare, in addition to Social Security and Medicare!
Such draconian measures are unlikely to be adopted. Yet the numbers illustrate the extent to which the benefits elders enjoy today will have to be paid for by people not yet born.
[page]1Close your eyes and imagine it's 2030. What do you see? A country that's older than present-day Florida, a country where the number of walkers equals the number of strollers, a country with only 15 percent more workers to pay benefits to 100 percent more retirees – and a country with high and rising poverty rates among the elderly.
You also see a government in desperate trouble – raising taxes to unprecedented levels, cutting benefits drastically, cutting domestic government spending to the bone, borrowing beyond its capacity to repay and printing lots of money to "meet" its bills. And you see major tax evasion, high and rising rates of inflation, a growing informal sector, a rapidly depreciating currency, large capital outflows and more people leaving than entering the country. In short, you see an America in 2030 that looks a lot like Russia circa today.
"Whether by design or through neglect, our public officals have misled the nation about our fiscal condition."
But "gee," you say, "things can't get that bad. After all, the country's running a huge surplus. Social Security is in close to 75-year actuarial balance. Medicare and Medicaid spending is slowing down. The government can cut spending. Technical change will bail us out. We can let in more immigrants. Moreover, aging has its economic benefits. Old people own wealth. Wealth represents claims on capital. So more oldsters relative to youngsters means more capital per worker and, therefore, higher labor productivity. Finally, even if the government is undersaving for the future, the public will save on its own to make up the difference."
Is our ship of state heading into the perfect fiscal storm? Or will it reach a safe harbor well before America's 77 million baby boomers switch from changing diapers to wearing them? You can ask a lot of economists and get a lot of opinions. But there aren't two right answers to this question. And getting to the truth is well worth the investment – for our nation, for ourselves and for our children.
[page]This paper takes a careful look at our nation's fiscal finances. It questions the much-heralded short-term federal budget surpluses, scrutinizes Social Security's and Medicare's finances and examines the nation's overall long-term fiscal situation based on a new generational accounting for the United States. The message of this inquiry is very unpleasant. Whether by design or through neglect, our public officials have misled the nation about our fiscal condition and dug a financial hole from which it will take us years to climb out.
The Congressional Budget Office, under the thumb of its congressional masters, is one of the main culprits. Its practice of making decade-long surplus projections based on extreme assumptions about federal spending has lulled the country into believing we can afford to cut taxes, raise spending or both. The trustees of the Social Security and Medicare systems are no better. They systematically understate the long-term costs of these programs at a time when they are both underfunded by roughly 40 percent.
Learning the truth about Social Security's and Medicare's finances prompts the following question: Are the rest of the government's long-term finances sufficiently in the black to bail out these programs? The answer, based on the latest generational accounting, is an emphatic no. This analysis, produced with the help of John Sturrock of the Congressional Budget Office (CBO), shows a huge shortfall in the nation's overall long-term finances.
"There's a huge shortfall in the nation's overall long-term finances."
The new accounting incorporates the latest CBO long-run revenue and expenditure projections with two caveats. First, it extends into the future the Joint Committee on Taxation's (JCT) decade-long estimates of the revenue and expenditure impacts of the 2001 tax cut.2 Second, it assumes that federal discretionary spending will grow with the economy rather than decline by over one-fifth relative to gross domestic product (GDP) between now and 2010. By contrast, the CBO imagines that federal spending will stay fixed in real terms for a decade while the economy grows. This seems highly unlikely for reasons discussed below and is belied by the past year's experience in which discretionary spending grew as fast as the economy.
Non-economists reading this are likely to wonder if we're all living on the same planet and, if so, whether these findings are to be trusted. We are, and they are. All the data used in this analysis come straight from the same government agency – the CBO – that has delighted and misled us, whether intentionally or not, with its short-term budget surplus projections. The reality is that 77 million baby boomers are going to retire within 30 years and the federal government is ignoring and hiding the implications of this fact.
[page]In January of this year, the CBO released projections of 10-year cumulative federal surpluses equaling $5.6 trillion. In August they revised this projection to $3.4 trillion in light of the slowing economy and the 2001 tax cut. That's a huge drop for currency traders and others who were finding solace in our budget surplus. Assuming the decline in the surplus is accurately calculated, can we count on the remaining $3.4 trillion actually materializing? Unfortunately not, because the original $5.6 trillion estimate was unrealistic. The main reason why is the CBO assumption, embedded in both its January and August forecasts, that federal discretionary spending on everything from missile defense to cigars for the president will remain constant, adjusted for inflation, over the next 10 years. While the CBO is up front in its small print about making this assumption, and claims as its rationale the Deficit Control Act of 1985, the assumption is hardly common knowledge. Indeed, most members of Congress may not understand that the CBO is making no adjustment whatsoever in projected federal spending for either population or productivity growth and is envisioning a 20 percent decline by 2011 in the size of government relative to the economy.
As incredible as this may seem, it's actually an improvement over the CBO's past practice of assuming fixed nominal spending on the part of the federal government.3 Even the CBO now admits that practice was "unreasonable" and not "a viable guideline" for projecting spending into the future. But having convinced the nation that the times are flush and the surpluses huge, our elected officials are spending more and taxing less. And since the terrorist attack on September 11, 2001, things have gotten much worse.
"The CBO surplus projections assume federal discretionary spending will not increase over the next 10 years."
The historical record provides some perspective on the likelihood that the federal government could shrink so dramatically over the next 10 years. Federal purchases as a share of GDP are currently lower than at any time in the past 40 years. In the early 1960s, federal purchases were roughly 12 percent of national output. Today, they are 6 percent. In the early 1960s, defense spending was 9 percent of GDP. Today, it is 3 percent. Spending on international aid as a share of GDP is also very low by historical standards. So is the third category of spending – domestic, non-defense discretionary spending.
Domestic, non-defense discretionary spending is currently 3 percent of GDP. Not since the early 1960s has such a small share of GDP been spent by the feds on domestic affairs. In 1980, for example, that spending totaled 4.7 percent of GDP.
The fact that federal spending has already declined so dramatically relative to the economy makes a further decline unlikely. Indeed, if defense spending grows with the economy, which appears highly likely given our war against terrorism, real non-defense spending would have to fall by one-third over the next 10 years to satisfy the CBO's forecast! What if the CBO is wrong and discretionary spending grows with GDP? What happens to the 10-year surplus? It falls by roughly $1 trillion, almost a third of its current projected level.
[page]The latest CBO figures show that far from declining as a share of GDP, federal discretionary spending between FY 2000 and FY 2001 grew almost as fast as the economy. And the CBO's unofficial estimate is that federal spending between FY 2001 and FY 2002 will grow almost twice as fast as the economy! "On-budget" surpluses (non-Social Security and non-Medicare) are, it appears, gone for good. That's highly unfortunate because on-budget surpluses, indeed, massive on-budget surpluses, are critical to paying scheduled Social Security and Medicare benefits over time. Stated differently, the two programs' short-term off-budget surpluses fall far short of the extra funds they need to deal with their own long-term benefit commitments.
[page]Most Americans know that Social Security and Medicare face significant long-term financial problems. What they don't know is that these problems are about three times more severe than the trustees of the Social Security and Medicare programs acknowledge in their annual reports. Consider Social Security – the Old-Age Survivors and Disability Insurance (OASDI) program. According to off-the-record statements of its actuaries, Social Security's long-term actuarial deficit is 4.7 percent of taxable payroll – more than twice the amount acknowledged in the 2001 Social Security Trustees Report.4
"Problems with Social Security and Medicare are about three times more severe than the trustees acknowledge."
This means that in order to avoid substantial cuts in benefits, today's workers need to start contributing an additional 4.7 percent of each dollar they earn on top of the current payroll tax of 12.4 percent – a 38 percent increase! But unlike the past practice of spending surplus revenues on other programs, the 4.7 percent must be invested in assets that earn interest and can be sold to pay benefits in future years. Whether the assets are held in private accounts or by the government is irrelevant from a financial point of view.
The discrepancy between the actual deficit and the one acknowledged in the trustees report reflects a difference of time horizon. The trustees report looks out only 75 years, whereas we need to consider the entire future. While 75 years may seem like a long-enough horizon, projected Social Security deficits in 76 years and beyond are extremely large – on the order of three-quarters of a trillion dollars per year, measured in today's dollars.
For this reason, the practice of projecting only 75 years guarantees that future trustees reports will reveal an increasingly bleak future. Next year's report, for example, will look into the future 76 years from today. The year after that, 77 years. In the year 2015, the report will show a really huge 75-year funding shortfall – not because of any real change between now and then, but because of the practice of artificially limiting the horizon for each year's projection.
Recall that the Greenspan Commission, headed by current Federal Reserve Board Chairman Alan Greenspan, was charged in 1983 with the task of putting Social Security on a firm long-term financial footing. But because of the practice of making 75-year projections, the commission's projection in 1983 ignored 18 additional years of very large annual deficits that are included in the current 75-year projection. It turns out that about a third of today's 75-year funding shortfall could have been anticipated back in 1983.
[page]A 38 percent increase in worker contributions – even if saved and invested – most likely will not suffice to address Social Security's problems. The 38 percent figure is computed using the actuaries' intermediate economic and demographic assumptions. But the "intermediate" nature of these assumptions is questioned by top economists and demographers. Indeed, the Social Security Advisory Board's 1999 Technical Panel recommended changes in the assumed intermediate rates of increase in life expectancy, real wage growth and interest on government securities.
The most important of these changes involves projections of lifespan extension. The Technical Panel recommended a four-year increase in the life expectancy used in the actuaries' intermediate assumptions. In demographic terms, four years is a huge increase. In advocating this increase, the Technical Panel pointed out that the actuaries were assuming it would take Americans 50 years to start living as long as the Japanese currently live. The Social Security trustees paid mostly lip service to the Technical Panel's recommendation. They too are under political pressure to make the system look good. Consequently, they raised life expectancy assumption by only one year.
Overly optimistic Social Security forecasting is not new. As just indicated, from the perspective of 1983, only about a third of the current 75-year OASDI funding shortfall is due to the truncation of the projection horizon. The remaining two-thirds is divided roughly evenly between overoptimistic economic and demographic assumptions and methodological mistakes in forecasting.
"Social Security is short 40 percent of the funds needed to avoid substantial benefit cuts."
Taken together, the Technical Panel's recommended assumptions raise the increase needed to achieve true long-run solvency from 4.7 to almost 6 percent of payroll. Given the current 12.4 percent OASDI tax rate, this means workers should be saving and investing 50 percent more! If one assumes that the Social Security Trust Fund is available to pay benefits, the system has only about 60 percent of the current and future resources it needs to continue paying benefits through time. Stated differently, Social Security is short 40 percent of the funds it needs if we are to avoid substantial benefit cuts.
However, the Trust Fund's assets are liabilities of the U.S. Treasury. So Trust Fund "assets" can be used to pay benefits only if the government raises other tax rates. If one believes that every dollar of assets accumulated in the Social Security Trust Fund has led, on balance, to an extra dollar of debt owed by the Treasury, one could argue that Social Security has no real assets and is actually 50 percent broke rather than 40 percent broke. We will return to this issue later.
[page]The current Medicare payroll tax rate for hospital insurance (the HI or Part A program) is 2.9 percent. The Medicare tax is levied on all labor earnings, whereas the OASDI tax is levied only on earnings up to the Social Security covered earnings ceiling, which is currently $80,400. In addition, the supplementary Medical Insurance program (SMI or Part B) currently accounts for two-fifths of total Medicare expenditure. This program is 25-percent-financed by participant premium payments from the enrollees and 75-percent-financed by general revenue.
Like the OASDI trustees, the Medicare trustees use a 75-year truncated projection horizon and make the same longevity assumptions. And like the OASDI trustees, they report a major funding shortfall over this period. According to their calculations, the 75-year actuarial deficit in the HI program is 1.46 percent of payroll. (For reasons that aren't clear, Medicare's trustees do not specify the income tax hike needed to eliminate the 75-year Medicare Part B funding gap.)
"Workers need to contribute more than twice as much as at present to eliminate the Medicare deficit."
In a recent analysis of Medicare's long-term costs, Harvard economist David Cutler and Federal Reserve economist Louise Sheiner extended the Medicare trustees' projection beyond the 75-year horizon. They also measured, as a percent of total labor income, the future costs of paying for the 75 percent of the SMI program not funded by enrollee premiums. Cutler and Sheiner found that the long-term actuarial deficit in both parts of Medicare is 4.1 percent of payroll. Thus, the real deficit is almost three times that acknowledged by the Medicare trustees.5
To eliminate it, workers need to contribute more than twice as much as they do at present – an increase in payroll taxes from 2.9 percent to 7.0 percent! As with Social Security, these increased funds would need to be invested in interest-earning assets that could be sold to pay future benefits. Again, whether the assets are held privately or by the federal government is irrelevant from a financial point of view.
[page]The Medicare trustees are much more optimistic than they were just three years ago. In their 1997 report, they projected that in 2030 Medicare spending would equal 7.14 percent of GDP. In 1999, they projected 2030 spending would total only 4.87 percent of GDP. The 2.27 percent of GDP discrepancy between these numbers is enormous when you consider that Medicare expenditures are currently about 2.6 percent of GDP. Hence, between 1997 and 1999, the Medicare trustees assumed away an amount of 2030 spending on Medicare that, when scaled relative to the economy, equals 87 percent of the current program. The optimism is greater the farther out one looks. For 2070, the trustees assumed away an amount of Medicare spending that exceeds the size of the current program when scaled by the size of the economy!
The fact that the Medicare trustees' projections are so different today than they were only three years ago means three things. First, the trustees are anchoring much of what they expect Medicare to spend in future years to very recent spending levels. Second, in applying the recent slower growth rate of Medicare spending to the distant future, they are ignoring the fact that Medicare growth has slowed in the past due to cost-containment policies and for other reasons, only to speed up thereafter. Third, there is no guarantee that the much higher future costs projected in 1997 won't be projected again in a few years. Indeed, recent double-digit rate hikes in HMO fees reported in the Northeast and other parts of the country suggest that Medicare costs may already be on the rise.
[page]"By 2030 we will have to double the payroll tax rate, cut every benefit in half – or borrow and pile up debt."
The combined employer-employee OASDHI payroll tax rate is now 15.3 percent. Adding to this the 6.0 and 4.1 percent additional saving and investment that is needed to secure Social Security's and Medicare's finances brings the total required contribution to 25.4 percent.6 This calculation illustrates the magnitude of the fiscal burden facing current and future workers. Further, saving and investing an additional 10 percent of labor income will suffice to correct the Social Security system's long-term imbalances only if implemented immediately. Any delay will necessitate even higher rates in the future if benefits are to be paid in full.
By the year 2030 – the midpoint of the baby boomer retirement years – the cost of elderly entitlement programs will be about double what it is today, relative to the national income. That means we will either have to double the current 15.3 percent payroll tax rate or cut every benefit in half. If politicians refuse either to raise taxes or cut benefits, they will be forced to borrow – piling up debt that will escalate each year. Beyond 2030, the financial crisis will worsen indefinitely.
American workers already face high marginal tax rates. Indeed, when one factors in payroll taxes, federal income taxes, the implicit marginal taxation of the earned income tax credit, state income taxes, local wage taxes, state sales taxes, federal excise taxes and other features of our tax-transfer system, it is hard to find any workers who don't surrender 50 cents or more of each dollar earned to government, either when they receive the dollar or when they spend it. Putting American workers into marginal tax brackets that are 10 to 15 percentage points higher will substantially reduce their incentives to work. It will also dramatically increase the economic distortions arising from the tax system, since these distortions grow with the square of total effective tax rates on labor supply and saving.
To sum up, the Social Security system has only about three-fifths of the long-term revenues it needs to pay its bills. Getting the remaining two-fifths through higher taxation would seriously impair the operation of our economy, not to mention the well being of today's and tomorrow's workers. But are such draconian tax hikes or huge future benefit cuts really needed? Or can Social Security and Medicare be rescued by the rest of the government's operations? Answering this question requires putting all of the government's fiscal activities on an equal footing. This is one of the objectives of generational accounting.
[page]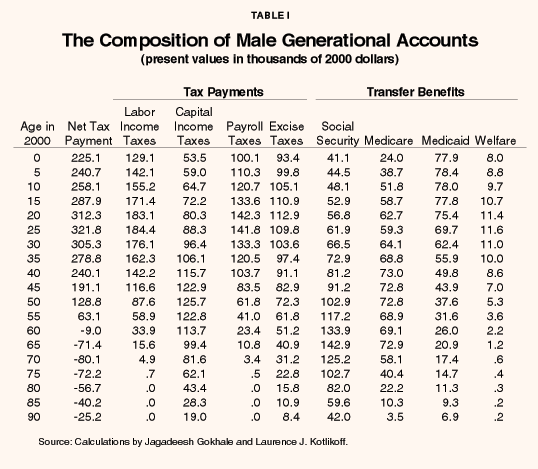
"Generational accounts tell us how much citizens in each age group will pay toward the cost of government."
Generational accounts are present value measures. They represent the sum of the present values of the future net taxes citizens at each age can expect to pay over their remaining lifetimes, given current policy. In this context, "net taxes" are defined as taxes paid minus any transfer payments the taxpayers receive. These generational accounts tell us how much citizens in each age group will pay toward the cost of government, disregarding those programs that redistribute resources from one group to another. The cost of government refers to the present value sum of all of the government's future purchases of goods and services plus its official net debt; that is, its official financial liabilities minus its official financial assets, including the value of its public-sector enterprises. Obviously, bills not paid by current generations must be paid by future generations.7
Generational Accounts of People Alive Today. Tables I and II report a new set of generational accounts that take into account the 2001 tax cut and assume that federal discretionary spending grows with the economy. The accounts were constructed using a 4.0 percent real discount rate and assuming a 2.2 percent rate of growth of labor productivity. The discount rate is roughly the current prevailing rate on long-term inflation-indexed U.S. government bonds. The productivity growth rate, while rather high relative to the past quarter-century's experience, is the one currently projected by the CBO. The accounts are present values discounted to 2000. They incorporate the CBO's latest short- and long-term projections (apart from the adjustment for discretionary spending growth) as well as the JCT's estimates of the implications of the tax cut.
"A 65-year-old male can expect a net gain of about $71,000 from government over the rest of his life."
Table I shows the level and composition of the accounts for males. These figures are averages. They take into account the fact that some members of each cohort will pay more and others will pay less in net taxes. They are also actuarial averages, reflecting the fact that some cohort members will die earlier than others. As the table shows:
- A male reaching 65 years of age today can expect to receive about $143,000 in benefits from Social Security and about $73,000 in benefits from Medicare by the time he dies.
- Since he is retired or about to retire, payroll taxes and income taxes on wage income will be small from here on out, but by the time he dies he can expect to pay $41,000 in sales taxes (through consumption expenditures) and more than twice that in income taxes on his pension and investment income.
- From all government programs, this individual can expect to receive $237,900 in transfer benefits over the rest of his life and pay $166,700 in taxes.
- Thus his expected net gain from interacting with the government for the rest of his life is about $71,000 in present value terms.
"A 20-year-old male can expect a lifetime net loss of $312,000 from interaction with government."
A representative female at age 65 can expect less in Social Security benefits, but more from Medicare and Medicaid. [See Table II.] The reason: her lower average wages produce smaller monthly checks from Social Security, but because she is expected to live more years than a representative male, she will make greater use of the health care system. Like her male cohort, her primary taxes will be sales taxes on consumption spending and income taxes on her pension and investment income. But since the average female has accumulated less capital, taxes on her capital income are much less than for the male. All told:
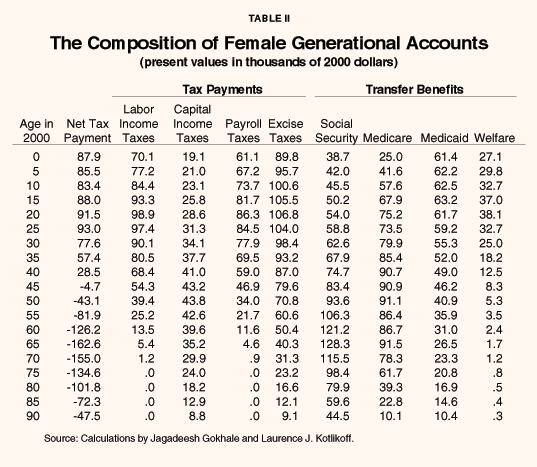
- A 65-year-old female can expect to pay $85,500 in taxes for the remainder of her life, while receiving $248,000 in transfer benefits.
- Thus her expected gain from interacting with the government is about $163,000 in present value terms, more than twice the gain for her male cohort.
"The older one is, the better the deal one can expect in transacting with government."
A very different picture confronts young people who are entering the labor market today. In present value terms, the expected benefits from Social Security and Medicare are much lower and expected taxes much higher than for those nearing their retirement years. Specifically,
- A 20-year-old female can expect to pay $320,600 in taxes for the remainder of her life, while receiving $229,000 in transfer benefits.
- On balance, she can expect to lose almost $92,000 through her interactions with government.
- A 20-year-old male can expect about the same transfer benefits as his female cohort, but will pay significantly more in taxes – $518,600 by the time he dies.
- On balance, a male worker entering the labor market today can expect to pay $312,000 more in taxes than he will receive in benefits over his lifetime – more than three times the loss expected by his female cohort.
In general, the tables show that women at all ages can expect to do significantly better in their relationship with government than will men. But a more dominant feature of the tables is the divergent interests of the young and the old.
"Women of all ages can expect to do better than men in their relationship with government."
Generational Differences. The net present values for males and females at different ages are shown in Figures I and II. In general, the figures show that the older one is, the better the deal one can expect in transacting with government. Moreover, at about age 45 for females and age 60 for males people switch from being net losers in their relationship with the state to net winners. Note, however, that the losses for those younger than age 25 become smaller the younger one is because more years are discounted before the individuals reach their peak taxpaying years. [See Tables I and II.] The accounts also become smaller for those beyond age 65 for women and age 70 for men. As the expected remaining years of life diminish, so do the expected benefits from transfer programs.
The most striking feature of Tables I and II and Figures I and II is the divergence in economic interests of the young and the old. Measured only in dollars and cents, the young would gain enormously if government transfer schemes were abolished altogether. Short of that, they have an economic interest in limiting the size of elderly entitlement programs and the taxes they pay to support them. The elderly have exactly the opposite economic interests. They gain from the expansion of elderly entitlement programs, even if they must pay somewhat higher taxes to support the expansion.
Another interesting feature of Tables I and II is how Medicare will grow relative to Social Security:
- Today's 20-year-olds can expect to receive more in Medicare benefits than they will receive in Social Security benefits over the course of a lifetime.
- Despite that fact, their current Social Security payroll tax rate is more than four times the tax rate for Medicare.
"Our policies today will force future taxpayers to bear a burden more than twice as great as our own children."
People Alive Today vs. People Not Yet Born. Many scholars have noted that seniors on Social Security are receiving benefits far in excess of what they paid in Social Security payroll taxes. That assessment also applies to Medicare. In this sense, today's retirees did not pay their own way. They shifted much of the burden of their benefits to younger workers.
But what about everyone alive today? As a group, are we paying our own way? Or are we shifting the cost of our benefits to taxpayers not yet born? One way to answer these questions is to consider a child born today:
- If we take the present value of expected taxes minus expected transfer benefits for a newborn and divide by the newborn's expected lifetime income, we have a measure of the child's lifetime contribution to the cost of government.
- The lifetime tax rate for today's newborn's is 17.7 percent of income.
How does that compare to the expected lifetime tax for future newborns? One way to answer this question is to assume for the moment that we could even out the tax burden for all future generations so that every age group not yet born would face the same lifetime tax rate. The results are as follows:
- Whereas the lifetime net tax rate for today's newborn is 17.7 percent, the average lifetime tax rate for all future newborns is 35.8 percent.
- On the average, our policies today will force future taxpayers to bear a burden more than twice as great as the one our own children will bear!
"With no change in policy, in 20 years taxpayers will face lifetime tax rates of 63 percent."
Keep in mind that the above comparison assumes that all future generations pay this same net tax rate. If instead one assumes no change in policy for the next couple of generations, the net tax rate for generations born later on will escalate rapidly. [See Figure III.] For example:
- If there is no change in elderly entitlement programs for the next five years, the net tax burden on all future generations combined will climb to 40 percent of their lifetime income.
- With no change in policy for 10 years, the lifetime net tax rate for future generations will reach 46 percent.
- After 20 years of no change in policy, future taxpayers will face lifetime tax rates of 63 percent.
Clearly we are on an unsustainable path.
The comparison of the generational accounts of current newborns and the accounts of future newborns provides a precise measure of generational imbalance. The accounts of these two sets of parties are directly comparable because they involve net taxes over entire lifetimes. If future generations face, on a growth-adjusted basis, higher net tax rates than do current newborns, current policy is not only generationally imbalanced, it's also unsustainable.
Generational accounting is a fundamentally new way of looking at government finance. It not only provides precise measurements of the size of fiscal problems, it also helps resolve important policy questions.
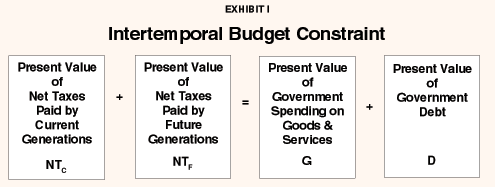
The Intertemporal Budget Constraint. As Exhibit I shows, generational accounting over time is constrained by the following equation:
(1) NTC + NTF = G + D
"If people today enjoy transfer program benefits they do not pay for, they shift the cost to taxpayers not yet born."
where NTC is the sum of net taxes paid by current taxpayers (people alive today), NTF is the sum of net taxes paid by future taxpayers (people not yet born), G is government purchases of goods and services, D is government debt, and all terms are expressed as present values. Equation (1) simply imposes the requirement that all government spending must be paid for by someone.
Now suppose we hold fixed the government's expected future purchases of goods and services as well as the current debt. Then the budget constraint tells us that any change in the net tax burden on current taxpayers requires an offsetting change in the expected burden for future taxpayers:
(2) ΔNTC = – ΔNTF
So if people today enjoy transfer program benefits they do not pay for, they shift the cost of those benefits to taxpayers not yet born. The primary goal of generational accounting is to measure the magnitude of these changes.
Deficit Delusion and the Need for Generational Accounting.8 Most fiscal analysts realize that official government debts do not include implicit liabilities. They also realize that Social Security and Medicare are financed partly through general revenues. As mentioned, in the case of Social Security, the government collects income taxes on Social Security benefits, and in the case of Medicare, the government pays most of Part B with general revenues. What most fiscal analysts fail to realize is that the division of government liabilities between implicit and explicit (official) is entirely in the eyes or mouth of the beholder. The same holds for assessing the share of any particular program that is financed by general revenue. Two observers of the same fiscal reality can use different but equally valid fiscal labels, report entirely different levels of implicit and explicit debts and reach quite different conclusions about the fiscal condition of particular programs. Generational accounting solves this problem.
Generational Accounting versus Deficit Accounting. A critical feature of generational accounting is that the size of the fiscal burden confronting future generations (the term NTF above) is invariant to the government's fiscal labeling – how it describes its receipts and payments. The values of NTF as well as government spending on goods and services (G) are independent of language and are economically well defined. By contrast, values for the reported size of official government debt (D) and the tax burden for the current generation of taxpayers (NTC) are not well-defined.
"The size of the deficit depends on the set of words used to measure it."
Suppose, for example, that the U.S. government chose to label this year's roughly $500 billion in contributions to the Social Security system as "loans" instead of "taxes." Also suppose that instead of calling the future benefits it promises to pay current workers in exchange for these contributions "transfer payments," it instead calls them "return of principal plus interest" on these loans less an "old age tax" (levied at the time contributors receive their benefits). This alternative set of words would leave the U.S. government reporting a $500 billion larger deficit this year, putting the overall budget in deficit to the tune of about $300 billion. A year from now, the government's debt (D) would be larger but so would the generational accounts of currently living generations (NTC) since their future "old age tax" would now be included in their accounts. Since D and NTC will both be larger by the same amount, the burden on future generations (NTF), is unchanged. The economic position of each generation would also be unaffected by the alternative set of labels. Each worker would hand the government the same amount of money this year and receive from the government the same amount of money in the future. The only difference would be in the words the government uses to describe these flows.9
That the government uses one set of words to describe what it's doing does not make those words sacrosanct. Each of us is free to use our own set of words to describe the government's actions. Since each set of words results in a different measure of the deficit, which is correct? The answer is, there is no correct measure. Nothing in economic theory leads one to choose one measure over another. Stated differently, economic theory does not pin down the absolute size of D and NTC, just their difference. Since G is economically well defined, so is NTF, which equals G minus the difference between D and NTC.10
A corollary of the fact that NTC by itself is not well defined is that components of NTC are not well defined. This means that breaking up the government's transfers and taxes and calling some "Social Security" and others "Medicare" has no economic basis. While the government may call a payment it receives from a worker a "payroll tax contribution to pay for Social Security benefits," the worker herself might call it a "payroll tax contribution to pay for building antiballistic missiles." Since money is fungible, economics offers no way to say who is right. But using the government's language makes the Social Security system's finances appear to be in better shape than using the worker's language.
"Generational accounting looks at all government programs simultaneously and assesses overall balance."
The ongoing confusion in our national discussion of Social Security's finances and the reality of its trust fund is simply this point writ large. The government may have the Treasury hand the Social Security Trust Fund an IOU and claim that it has helped to "fund" the system and improve its long-term finances. The man on the street may observe that the Social Security trust fund is simply internal bookkeeping – that this asset is offset by an offsetting liability of the Treasury, and that there is no real asset or improvement in the system's finances. We live in a free country, where everyone can choose her or his own language. If the government wants to say that Social Security is in fine shape and the rest of the government's finances are in bad shape, and someone else wants to say that Social Security is in bad shape but the rest of the government's finances are in good shape, who's to stop them? The argument is intrinsically meaningless. The only meaningful fiscal analysis entails looking at all the government's programs simultaneously and assessing overall intertemporal and generational fiscal balance, which is precisely what generational accounting does.
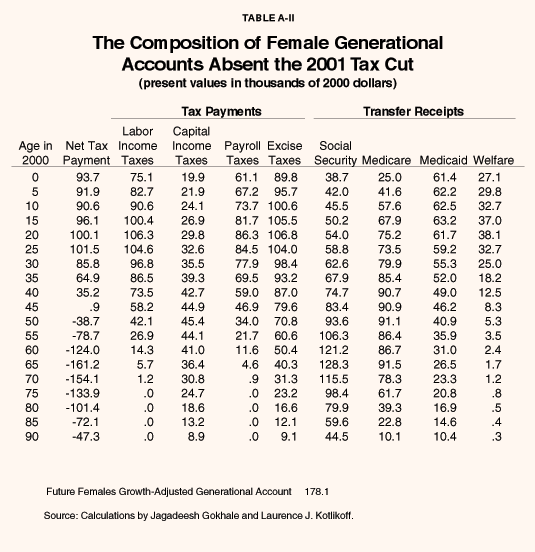
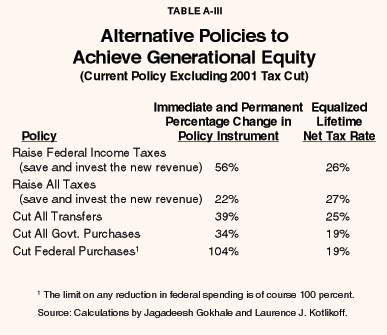
Digging a Deeper Hole – The Impact of the 2001 Tax Cut. The Bush tax cut helped make a terrible situation significantly worse. Had the 2001 tax cut not been enacted, future generations would have faced net tax rates that were 80 percent rather than 96 percent larger than those facing current generations. Tables A-I and A-II repeat Tables I and II but assume that the 2001 tax cut had not been enacted. Table A-III repeats Table III under the same assumption. With the Bush tax cut, the lifetime net tax rates are 18.65 percent and 34.69 percent for newborn and future generations, respectively. Hence, the Bush tax cut worsened the generational imbalance (the percentage difference between the 34.69 percent and 18.65 percent rates) by about one-fifth at a time when it already was huge.
"Generational equity would require large tax increases, large spending cuts or both."
What was the alternative to the tax cut? President Bush's defenders will argue that but for the tax cut, Congress would have spent the funds on other programs – including expanding elderly entitlements and thus (implicitly) creating even greater burdens for future taxpayers. The ideal, of course, would have been to sequester the funds and invest them.
Can We Be Rescued by Higher Economic Growth? It's worth noting that higher productivity growth would not necessarily reduce the imbalance in generational policy. Indeed, assuming a 3 percent productivity growth rate, the imbalance is 139.0 percent; i.e., future generations face lifetime net tax rates that are 2.4 times those facing today's newborns. While the percentage difference in these lifetime net tax rates grows, the absolute size of each declines with higher productivity growth.
A more basic problem is that higher growth isn't likely to happen. The reason is that the higher tax burden associated with the demographic transition will siphon off lots of saving and culminate in less, not more, capital per worker. Rather than mitigate our fiscal dilemma, the economy's performance will likely exacerbate it.
[page]As we've seen, the imbalance in U.S. generational policy is gigantic. To get a different sense of its size, consider alternative policies the government would have to undertake to equalize the net tax rates of newborns and future generations to achieve generational balance. The first column in Table III lists five such policies. The first policy involves raising federal income taxes. To be precise, suppose the government were to eliminate its generational imbalance by immediately and permanently raising the federal corporate and personal income tax by a given percentage. (Note that the revenue from this tax increase would have to be invested in interest-earning assets that could be sold in future years to pay benefits and that these assets could be held in individual private accounts.) How large would the tax hike have to be? The answer is 68 percent! Hence, based on the government's fiscal language, the current surplus is far too small compared to what is needed to achieve generational equity. An alternative to raising just federal income taxes is to raise all federal, state and local taxes. In this case, an across-the-board tax hike of 26 percent could deliver generational equity.
An alternative to raising taxes is to cut spending, including transfer payments or government purchases of good and services. Cutting all Social Security, Medicare, Medicaid, food stamps, unemployment insurance benefits, welfare benefits, housing support and other transfer payments by 44 percent is one way to eliminate the generational imbalance. Two final options considered in the table are immediately and permanently cutting all government purchases by 39 percent or (and this is easy) cutting just federal purchases by 117 percent.
"Our government is assuming away our fiscal problems rather than confronting and correcting them."
Cutting all government purchases to achieve generational balance would leave future generations paying in net taxes the same 18 percent share of lifetime earnings as current newborns are expected (under current policy) to pay. In contrast, either raising taxes or cutting transfer payments would mean higher lifetime net tax rates for those now alive. As Table III indicates, these alternative policies would leave newborns and all future generations paying roughly 26 cents out of every dollar earned in net taxes. This net tax rate is over 8 cents more per dollar earned than newborns are now forced to pay. The payoff from having newborns as well as everyone else who is currently alive pay more in net taxes is a reduction in the net tax rate facing future generations of close to 10 cents per dollar earned.
[page]Our government, through its various fiscal agencies, is assuming away our fiscal problems rather than confronting and correcting them. In so doing, it disserves both us and our children. Notwithstanding the rosy fiscal projections, our country has a huge imbalance in its generational policy. Without dramatic and immediate changes in policy, our grandchildren and their grandchildren are likely to face lifetime net tax rates that are twice those we face.
"Without dramatic change in policy, our grandchildren and their grandchildren are likely to face net tax rates twice those we face."
Replacing Social Security with a compulsory private saving system represents a way to keep the next generation from facing much higher payroll tax rates. But this "cure" is not painless, since paying off the unfunded liabilities of the existing system entails a real sacrifice. Still, careful simulation studies by academic economists demonstrate that the economic losses to current generations would be modest compared to the gains that would accrue to future generations. Privatizing Social Security and paying off all its unfunded liabilities may be the most responsible course of action, but it's also the least likely to be chosen through our political process. Hence, baby boomers and other Americans can look forward to various tax hikes and benefit cuts, many of which are likely to arise within the Social Security program. Social Security is already a bad deal for most American workers, and alternative ways of "reforming" the system through tax hikes and benefit cuts will make a bad deal worse. Precisely who gets hurt and by how much will depend on the particular policies chosen.
Can Americans protect themselves from what's coming? Yes, but it will require saving at rates that far exceed what most American households typically achieve. And how one saves may be as important as how much one saves. In particular, the notion that saving in tax-deferred form lowers everyone's lifetime taxes and permits higher lifetime spending is belied by Gokhale and Kotlikoff's forthcoming NCPA study.11
To conclude, a major generational storm is on the horizon. It's a big one. And, at long last, we had better get ready.
NOTE: Nothing written here should be construed as necessarily reflecting the views of the National Center for Policy Analysis or as an attempt to aid or hinder the passage of any bill before Congress.
[page]- Sections of this paper draw heavily on Jagadeesh Gokhale and Laurence J. Kotlikoff, "Social Security's Treatment of Postwar Americans – How Bad Can It Get?" in Martin Feldstein, ed., The Distributional Effects of Social Security Reform (Chicago: University of Chicago Press, 2001).
- According to the JCT projections, the percentage loss in federal income tax revenues from the 2001 tax cut peaks in 2010. We use this 2010 percentage loss in forecasting federal income tax revenues beyond 2010.
- Last year's CBO baseline made an even more extreme assumption, namely that discretionary spending would stay fixed/frozen in nominal terms. Even the CBO acknowledges that its use of the baseline freeze was unreasonable. In its January 2001 budget forecast it states, "Last year, CBO presented two other benchmarks for discretionary spending – a freeze level and the statutory limits on discretionary spending. Lawmakers sometimes use a freeze in appropriations – or the current year's amounts without adjustment for inflation – to gauge the impact of proposed levels of discretionary spending for the upcoming fiscal year. However, recent trends in appropriations probably make it unreasonable to assume a freeze in the baseline over the next 10 years. Throughout most of the 1990s, CBO's baseline for discretionary spending assumed adherence to the statutory limits that were originally enacted in 1990 (and extended in 1993 and 1997). However, the discretionary spending limits expire after 2002, and it is clear from appropriations enacted in recent years that they are no longer a useful measure of current policy or a viable guideline for projecting discretionary spending in the future. (For example, the adjusted limit on discretionary outlays for 2002 – $576 billion – is about $71 billion below CBO's estimate of discretionary outlays for 2001.)"
- 2001 Annual Report of the Board of Trustees of the Federal Old-Age and Survivors Insurance and Disability Insurance Trust Funds.
- David M. Cutler and Louise Sheiner, "Generational Aspects of Medicare," Federal Reserve Board, Finance and Economics Discussion Series, 2000-9 (January 2000). Available online at http://www.federalreserve.gov/pubs/feds/2000/200009/200009pap.pdf
- A total of 18.4 percentage points of this 25.4 percent rate would be applied only to OASDI-covered earnings; the remaining 7 percentage points would be applied to all earnings.
- This is the zero-sum nature of the government's intertemporal budget constraint, the basic building block of modern dynamic analyses of fiscal policy.
- This discussion of generational accounting draws heavily on Niall Fergeson and Laurence J. Kotlikoff, "The Degeneration of the Euro," Foreign Affairs, March 2000.
- The remaining lifetime budget constraints of current workers would also be unaffected by the language change, since the "old age tax" has the same present value as the current "payroll tax." The fact that the worker might not survive to pay the "old age tax" is immaterial, since his estate could be described with the alternative set of words as being assessed the tax. One might object that the worker could arrange for his estate tax to be smaller than the amount of tax due. But this objection is overcome by describing the worker as being forced to a) buy a life insurance policy that pays an amount equal to the old age tax in the year the "benefit" is paid, b) buy an annuity that pays an amount equal to the old age tax in the year the "benefit" is paid, and c) make the government the owner of both policies. The premiums for these two policies would exactly exhaust the amount of the worker's contributions. Hence, the same government coercion that forces the worker to make current "tax" contributions could force the worker to purchase "private insurance contracts." The company receiving these premium payments can be viewed as lending them to the government (i.e., investing its reserves in government bonds). The government's repayment of the principal plus interest on the bonds would then be used by the insurance company either to pay off the annuity policy if the worker lives to the date he'd collect "benefits," or to pay off the life insurance policy if the worker dies before that date. The fact that such institutional arrangements differ from what we think are our current institutions is simply a matter of labeling.
- Some economists have referred to the need to add implicit government liabilities to explicit ones in calculating the government's true debt. The difference D-B is precisely the sum of explicit plus implicit liabilities, since it adds together the government's official debt and its commitments to transfers to the currently living public, net of the taxes they are projected to pay.
- Jagadeesh Gokhale and Laurence J. Kotlikoff, "Who Gets Paid to Save?" National Center for Policy Analysis, forthcoming study.
David M. Cutler and Louise Sheiner, "Generational Aspects of Medicare," The American Economic Review, 90 (2), May 2000, 303-7.
Jagadeesh Gokhale and Laurence J. Kotlikoff, "Faulty Assumptions: The Crack in the Budget Façade," The Milken Institute Review, First Quarter 2001a, 24-32b.
Jagadeesh Gokhale, Laurence J. Kotlikoff and Todd Neuman, "Does Participating in a 401(k) Raise Your Lifetime Taxes?" NBER Working Paper No. 8341, June 2001b.
Laurence J. Kotlikoff, "Generational Policy," in Alan J. Auerbach and Martin Feldstein, eds., The Handbook of Public Economics, Second Edition, forthcoming, North Holland, 2002.
Laurence J. Kotlikoff, Kent Smetters and Jan Walliser, "Finding a Way Out of America's Demographic Dilemma," NBER Working Paper No. 8258, April 2001.
[page]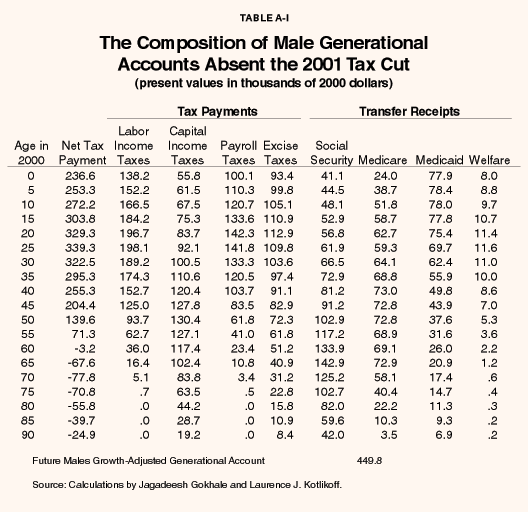
Jagadeesh Gokhale is a senior economic advisor with the Federal Reserve Bank of Cleveland and works in the areas of public finance, macroeconomics and applied microeconomics. He received his doctorate in economics from Boston University. He has published papers on national saving, private pensions, wealth inequality and generational accounting in top academic journals and books. Dr. Gokhale has coauthored several chapters on U.S. fiscal policy in the Budget of the United States Government, and has testified before the Senate Budget Committee on U.S. Social Security reform. In his work on labor markets, he has analyzed the relationship between worker productivity and compensation and the impact of firms' wage and employment structures on corporate ownership patterns. Dr. Gokhale has published articles in the Quarterly Journal of Economics, the Journal of Economic Perspectives, the Review of Economics and Statistics and a number of publications of the National Bureau of Economic Research.
Laurence J. Kotlikoff is Professor of Economics at Boston University, Research Associate of the National Bureau of Economic Research, Fellow of the Econometric Society, a member of the Executive Committee of the American Economic Association and President of Economic Security Planning, Inc., a company specializing in financial planning software. Professor Kotlikoff received his B.A. in Economics from the University of Pennsylvania in 1973 and his Ph.D. in Economics from Harvard University in 1977. From 1977 through 1983 he served on the faculties of economics of the University of California, Los Angeles and Yale University. In 1981-82 Professor Kotlikoff was a Senior Economist with the President's Council of Economic Advisers. Professor Kotlikoff has served as a consultant to the International Monetary Fund, the World Bank, the Harvard Institute for International Development, the Organization for Economic Cooperation and Development, the Swedish Ministry of Finance, the Norwegian Ministry of Finance, the Bank of Italy, the Bank of Japan, the Government of Russia, the Government of Bolivia, the Government of Bulgaria, the Treasury of New Zealand, the Office of Management and Budget, the U.S. Department of Education, the U.S. Department of Labor, the Joint Committee on Taxation, the Commonwealth of Massachusetts, The American Council of Life Insurance, Merrill Lynch, Fidelity Investments and other major U.S. corporations. He has provided expert testimony on numerous occasions to committees of Congress. Professor Kotlikoff is coauthor (with Alan Auerbach) of Macroeconomics: An Integrated Approach, author of Generational Accounting, What Determines Savings?, coauthor (with Alan Auerbach) of Dynamic Fiscal Policy, coauthor (with Daniel Smith) of Pensions in the American Economy, and coauthor (with David Wise) of The Wage Carrot and the Pension Stick, and has published extensively in professional journals, newspapers and magazines.