What is the economic reward for working? The answer is surprisingly complicated. Going to work, earning a living, and spending one's earnings over time raises a variety of taxes and government benefits and lowers a variety of taxes and benefits – and not just in the current year, but in all future years as well.
If you save and invest some of you current earnings and spend the proceeds in the future, you'll raise your future capital income taxes as well as consumption taxes. You'll also limit your ability to qualify for the receipt of future income- and asset-tested government tax credits and welfare benefits. Earning more today will also affect the calculation of your future Social Security benefits as well as the federal income tax assessed on those benefits.
In order to sort through all of these effects, we consider a two-earner couple at various levels of income. The couple has two children and they are assumed to take advantage of a wide array of tax avoidance opportunities, including the mortgage interest deduction, the earned-income tax credit, and the child tax credit. When qualified, the couple also receives the full array of transfer benefits, including Food Stamps and Medicaid.
By incorporating all of the fiscal policies that affect households through time, our model is able to calculate the lifetime consequences of a lifetime of employment. We conclude that:
- The overall fiscal system is highly progressive, particularly at the low end of the income distribution.
- Americans at every income level face a lifetime marginal net tax rate greater than 50 percent.
- That is, for every dollar they earn, they will lose more than 50 cents in higher taxes and reduced transfer benefits.
Furthermore, the highest marginal net tax rates are not imposed on the highest-income families. They are imposed on those with the lowest earnings. For example:
- At two times the minimum wage ($42,800), working couples get to keep less than 30 cents out of each dollar they earn.
- At 1.5 times the minimum wage ($32,100), they get to keep less than 20 cents out of each dollar they earn.
- By contrast, a couple earning $200,000 a year gets to keep 44 cents.
The disincentives to work at the low end of the income scale are even worse if we compare part-time with full-time work:
- A minimum-wage couple that moves from half-time to full-time work will lose 97 cents out of every extra dollar they both earn.
- At 1.5 times the minimum wage, the couple will lose $1.06 for every extra $1.00 they earn; for this couple, working more literally means having less.
What causes these marginal tax rates to be so high? In general, loss of transfer benefits is more important for lower-income families, while direct taxes on income are more important for higher-income families. Among full-time working couples:
- At $32,100 (1.5 times the minimum wage), two-thirds of the marginal net tax rate consists of the loss of transfer benefits, while a little more than one in five dollars is lost to income and payroll taxes.
- At $64,300 (triple the minimum wage), half of the marginal net tax rate consists of a loss of benefits, while two in five dollars are lost to income and payroll taxes.
- At $321,400 (15 times the minimum wage), four in five dollars of the marginal net tax are lost to income and payroll taxes.
Marginal net tax rates for low-income families are so draconian because our system makes a very generous package of welfare benefits available to people who do not work and then begins taking away those benefits at a steep rate as they begin to earn a modest income. In our model, for example:
- A couple with two children can expect $489,100 in lifetime benefits if they never work.
- However, if both spouses work full-time and each earns about $16,000, the loss of Medicaid and other welfare benefits will cost them two-thirds of their income over the whole of their worklife.
When all taxes and benefits are considered, the American fiscal system is fairly progressive – at least toward the lower half of the income spectrum. That is, the lower your income, the more generously you are treated. But the price of that generosity is lifetime marginal net tax rates that make working for a living very unattractive.
[page]1Does it pay to work? That is a tough question to answer. In general, more work means a higher income and, therefore, higher taxes. A higher income usually also leads to fewer entitlement benefits (such as Food Stamps). Moreover, the effects of working today are not limited to today's higher taxes and today's loss of entitlement benefits. Income earned today also affects future taxes and future benefits. In particular, there are five important links between today's decisions and their future consequences:
- Earning more today typically leads to more saving and, therefore, more assets and more income from assets in the future; however, that higher future capital income will result in higher future income taxes.
- More assets and more income in the future also will mean fewer future benefits from entitlement programs that are linked to the income and assets of the recipients (such as Medicaid).
- Earning more today typically will lead to more consumption in the future because asset accumulation makes more consumption possible; however, that higher consumption will result in higher consumption taxes.
- Earning more today will lead to higher Social Security benefits in the future.
- More non-Social Security income in the future, caused by higher earnings and more saving today, will increase the tax on future Social Security benefits.
"To determine if work pays, we must consider lifetime taxes paid and government benefits lost as a result of working."
Calculating the Costs and Benefits of Working. As the above list indicates, understanding the full consequences of deciding to work requires taking into account all future taxes workers will pay plus all future transfer payments workers will lose from going to work. To illustrate this lifetime tax analysis, we have chosen a representative two-earner couple. The couple is assumed to rent in the early years and eventually buy a house. They have two children, who grow up and attend college. Over time, the couple has many opportunities to interact with the tax system by, for example, taking advantage of the mortgage interest deduction and the child tax credit, deciding whether to itemize deductions, paying Federal Insurance Contribution Act (FICA) taxes, paying state income taxes, and using their after-tax earnings to pay sales taxes.
We assume that couples enter the labor market at a specific wage and that their income grows by 1 percent per year in real terms, and we consider this couple at different income levels. For example, if they earn a low income they benefit from the Earned Income Tax Credit (EITC) and the credit for retirement account contributions. If they earn a high income, they are penalized by the phase-out of itemized deductions and by the alternative minimum tax. We approach entitlement benefits in a similar way. If they earn a low income, the family qualifies for "welfare" benefits including cash assistance, Food Stamps and Medicaid. As their level of income or assets rises, these benefits phase out.
Our approach is also probabilistic. In any given year, there is some chance one or both spouses will die. The death of a spouse triggers entitlement benefits for the remaining spouse and the children (such as survivors benefits under Social Security). These benefits are also affected by what the deceased spouse was earning. We calculate expected taxes and expected benefits for the couple. We do so by calculating the taxes and benefits for each possible lifetime. To get an expected result, we sum over all possible lifetimes, each weighted by its probability of occurring.
Our approach is also comprehensive. We include every major tax and transfer program. In the case of taxes, we include employer-paid taxes, whether corporate income taxes or employer-paid FICA taxes.
"A low-income couple with children is eligible for many tax benefits and transfers that aren't available to middle-income workers."
The Complexity of the U.S. Tax and Transfer Benefit Programs. It is difficult to exaggerate the complexity of the taxes and transfer programs American workers face. Mastering the federal income tax alone is a major challenge because it has so many special provisions. These include the inflation-indexation of tax brackets, the partial and graduated taxation of Social Security benefits above two noninflation-indexed thresholds, the treatment of retirement account contributions and withdrawals, the phase-out of itemized deductions, the Earned Income Tax Credit, the child tax credit, the alternative minimum tax, and the recently legislated credit to low-income households for contributing to retirement accounts.
As if the federal income tax were not difficult enough to decipher, almost all states have income taxes with their own special provisions. For example, Massachusetts has an exemption for the elderly, a child deduction, a rental deduction, and a deduction for employee-paid payroll taxes. Compared to these state taxes, the FICA payroll tax seems straightforward.
As the various interrelated social welfare programs have grown, the U.S. system of transfer benefits has become extremely complicated. It now includes Food Stamps, Medicaid, traditional welfare – renamed Temporary Assistance for Needy Families (TANF), Supplemental Security Income (SSI), housing assistance programs, the Low-Income Home Energy Assistance Program (LIHEAP), the Special Supplemental Nutrition Program for Women, Infants and Children (WIC), and several other programs.
Software Program. Understanding the effective net tax on work requires an intertemporal model capable of carefully determining tax and transfer payments at each stage of a person's life cycle, based in part on economic choices in prior periods. This study uses ESPlanner, a financial planning software program developed by Economic Security Planning, Inc., to study the net tax levied on workers with different earnings capacities. ESPlanner smooths households' living standards subject to constraints on their capacities to borrow. In so doing, it makes highly detailed, year-by-year federal and state income tax and Social Security benefit calculations. [See Appendix for details.]
Reporting the Results. In expressing the results of this study, we have chosen multiples of the minimum wage. A full-time worker earning the minimum wage of $5.15 an hour will earn $10,700 a year. When both spouses earn the minimum wage, their family income will be $21,400. If both spouses earn twice the minimum wage ($10.30 an hour), their joint annual income will be $42,800.
[page]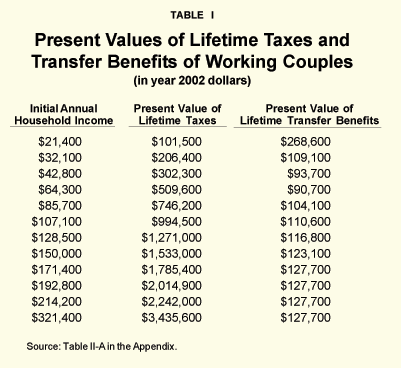
In order to assess the consequences of going to work, we need to calculate over a lifetime the extra taxes paid and extra benefits received or sacrificed as a result of that decision. In what follows, all lifetime taxes and transfer benefits are reported as present values.
"At different income levels, a two-earner couple faces different lifetime tax burdens and lifetime benefits."
Lifetime Taxes. Table I presents the couple's expected lifetime taxes and benefits, measured in current dollars. If we ignore the lowest income levels, the table shows:
- A couple earning twice the minimum wage can expect to pay more than $300,000 in taxes over the course of their lifetimes – an amount equal to about seven times their initial annual income.
- A couple earning about $100,000 can expect to pay close to a million dollars in lifetime taxes – an amount equal to almost 10 times their initial annual earnings.
- At higher levels of income, expected lifetime taxes tend to be between 10 and 11 times initial annual earnings, regardless of the amount earned.
On the tax side, then, our system is mildly progressive. As a percent of lifetime income, the tax burden rises modestly as income rises, then levels off once income rises above $100,000.
The Composition of Lifetime Taxes. One reason why the overall tax system is not more progressive is that people pay different types of taxes at different income levels. Although the rate structure of the federal income tax system is fairly progressive, payroll taxes tend to be proportional to income (although typically capped at a certain income level) and consumption taxes tend to be regressive, taking a larger portion of lower family incomes. In general, the tax burden borne by lower-income families tends to be weighted toward proportional and regressive taxes. As Figure I shows:
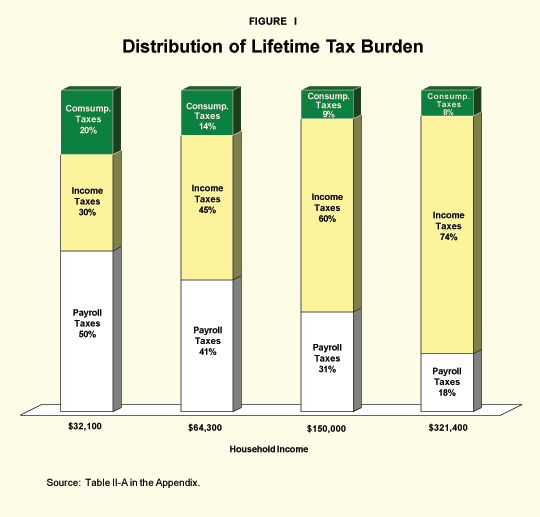
- For a family earning $32,100 a year (1.5 times the minimum wage), half the taxes paid are payroll taxes and only 30 percent are income taxes.
- By contrast, for a family earning $321,400 (15 times the minimum wage), three-fourths of all taxes are paid in the form of income taxes, and less than one in five tax dollars comprises payroll taxes.
Lifetime Transfer Benefits. Returning to Table I, note that a couple in which both spouses initially earn the minimum wage and remain at the bottom of the income ladder throughout their working lives can expect to pay more than $100,000 in taxes over their lifetime. However, they can expect to receive back almost $270,000 in benefits. Thus a low-income household gets a very good return on its taxes. (Note, however, that it is very difficult to work full time and earn only a minimum wage income for four to five decades.) Going beyond the lowest income level, Table I shows that:
- A couple earning twice the minimum wage ($42,800) can expect to receive about $94,000 in lifetime entitlement benefits, measured in current dollars.
- At four times the minimum wage ($85,700), the couple's expected entitlement benefits rise to $104,000.
- At an income level of about $150,000, the couple's entitlement benefits reach about $127,000, where they remain, regardless of the size of the family's income.
"A high-income couple pays three-fourths of its taxes in the form of income taxes."
Unlike taxes, which tend to be proportional to income once a certain income level is reached, transfer benefits tend to be constant once a certain income level is reached. This means that benefits as a percent of income tend to fall as income rises.
- At twice the minimum wage, couples can expect to get back about $1 in transfer benefits for every $3 they pay in taxes.
- At four times the minimum wage, couples can expect to get back less than one in seven dollars they pay in taxes.
- At about $200,000 in income, they can expect to get back less than one in 16 tax dollars.
"About 70 percent of the transfer benefits of a minimum wage couple is Medicaid, while Social Security is three-fourths of the benefits of high-wage couples."
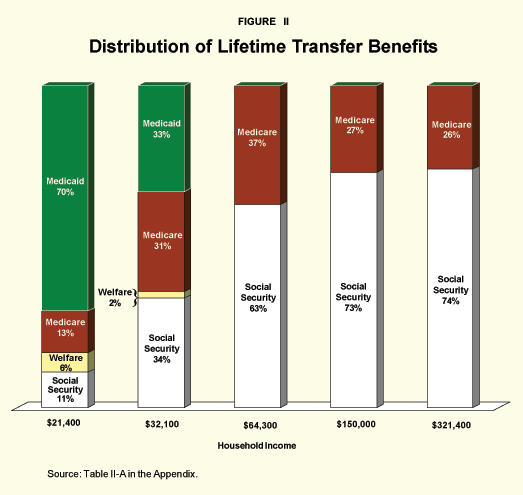
Composition of Transfer Benefits. The principal reason why transfer programs tend to be more progressive than the tax system is that many programs are means-tested. Although rich and poor alike participate in Medicare and Social Security, only low-income families have access to means-tested benefits, the most important of which is Medicaid. As Figure II shows:
- About 70 percent of all transfer benefits received by a couple earning the minimum wage over the course of their working lives consists of Medicaid benefits, and only one in four dollars is in the form of Social Security and Medicare benefits.
- By contrast, a couple earning $150,000 (seven times the minimum wage) receives all of its transfer benefits in the form of Social Security (73 percent) and Medicare (27 percent).
"The system as a whole is quite progressive, especially over the bottom end of the income distribution."
Policy Implications. From these observations, we can draw three conclusions with important public policy implications. First, most Americans can expect to get back in the form of entitlement benefits only a fraction of what they pay in taxes, although they do receive other government services that presumably are worth paying for. Second, the system as a whole is quite progressive, with low- and moderate-income families having a more favorable relationship with the state than higher-income families. Third, most of the progressivity in our system comes on the benefit side rather than on the tax side of fiscal policy.
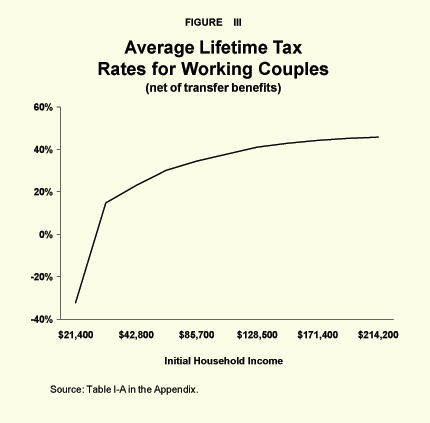
One way to appreciate the amount of overall progressivity in the system is to calculate an average lifetime net tax rate, defined as the ratio of lifetime taxes net of any transfer benefits received to lifetime income. The result of that calculation is shown in Figure III. As in Table I, Figure III shows that a couple in which both spouses earn the minimum wage over the whole of their working lives can expect to receive far more in transfer benefits (including EITC refunds) than they pay in taxes. (Yet, as noted above, it is very difficult for someone to stay at the minimum wage over the whole of a work-life.) At 1.5 times the minimum wage, the couple experiences a positive net tax burden, however, and above that figure those who earn more pay more of their income (on net) to the state. Overall, the system is progressive, but as income rises it becomes only mildly so.
To those for whom progressivity is an important value, these results should be heartening. Yet this progressivity comes at a terrible price. Many entitlement benefits, it turns out, are available to people whether they work or not. And when they decide to work, the withdrawal of benefits plus the imposition of taxes creates very high marginal tax rates.
"All full-time working households face marginal tax rates higher than 50 percent."
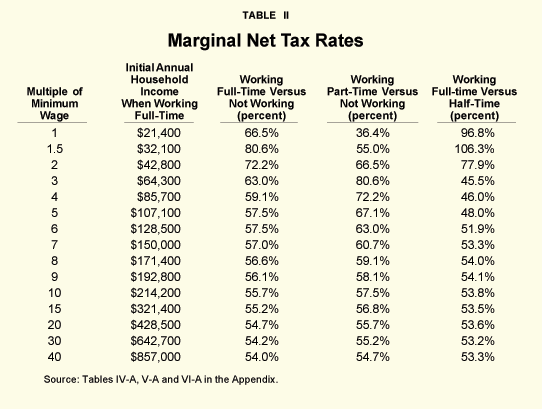
Working Versus Not Working. To calculate marginal tax rates, we ignore benefits to which people are entitled whether they work or not. We want to identify changes in taxes paid and benefits received as a result of the decision to work rather than not work. The additional taxes paid plus the net reduction in transfer benefits received divided by the income from working is called the marginal net tax rate. These are depicted in Table II.
The first thing to note is that all full-time working households face marginal net work tax rates in excess of 50 percent! In going to work, all American households hand over half or more of every dollar they earn to state and federal government in taxes paid net of benefits received.
The second thing to note is that the lowest-income households face the highest marginal net tax rates:
- The marginal net tax rate of households earning 1.5 times the minimum wage is 81 percent; families at this income level keep less than one-fifth of the income they earn.
- At two times the minimum wage the marginal net tax rate is 72 percent; these families keep less than 30 cents out of each dollar they earn.
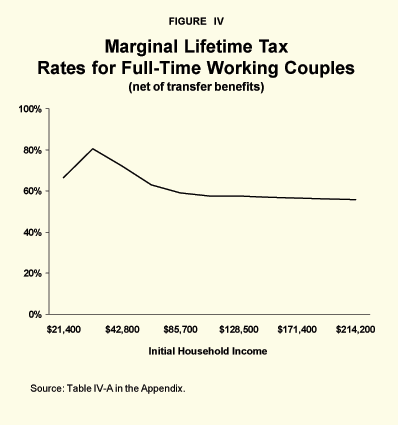
The third thing to note is that at higher income levels, marginal net tax rates decline as income rises. On the whole, marginal net tax rates tend to be regressive, imposing the highest burdens on those with the lowest earnings. [See Figure IV.]
Perhaps the most striking feature of Table II is that the minimum wage household faces a 67 percent net marginal tax on working full time. This family keeps only one in every three dollars it earns on net! The principal reason is that households in which no one works receive very substantial transfer benefits. Many of these benefits are either entirely lost or greatly reduced when household members go to work full time. In addition, the household must pay federal income, state income, and FICA taxes on its earnings. Offsetting these factors is the increase in Social Security benefits associated with working and the availability of the Earned Income Tax Credit.
"A minimum wage household faces a 67 percent marginal net tax on full-time work."
Households earning 1.5 times the minimum wage also lose benefits when they go to work. In addition, they lose virtually all of their Earned Income Tax Credits. In addition, their higher earnings limit the degree of progressivity of the Social Security benefit schedule.2 This is the reason marginal net tax rates are higher for households earning 1.5 times the minimum wage than for those with higher incomes.
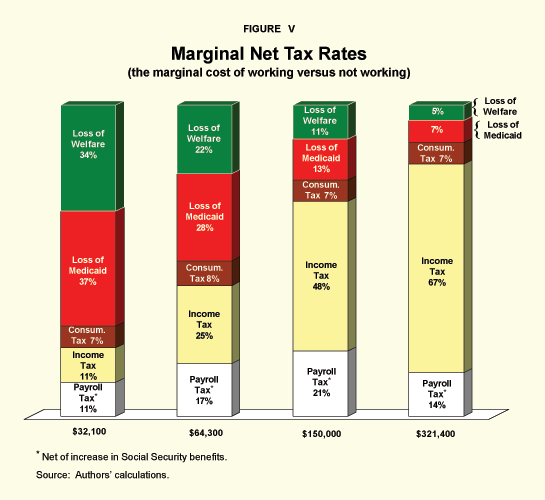
The Composition of Marginal Net Tax Rates. Figure V shows the composition of marginal net tax rates for couples at different income levels. Note that the lower the family's income, the more important the loss of the transfer benefits is. Conversely, the higher the family's income, the more important direct taxes on income are. For example:
- At $32,100 (1.5 times the minimum wage), two-thirds of the marginal net tax rate consists of the loss of transfer benefits, while a little more than one in five dollars is lost to income and payroll taxes.3
- At $64,300 (triple the minimum wage), half of the marginal net tax rate consists of a loss of benefits, while two in five dollars are lost to income and payroll taxes.
- At $321,400 (15 times the minimum wage), four in five dollars of the marginal net tax are lost to income and payroll taxes.
Working Part-Time. Table II also shows marginal net tax rates for those who go from no work to part-time work and from part-time to full-time work. As the table reveals, fiscal policy discourages full-time work more than half-time work for low- and moderate-income couples:
- At the minimum wage, the marginal net tax rate on going to work half-time is 36 percent versus 67 percent for working full-time.
- At 1.5 times the minimum wage, the rate for half-time work is 55 percent versus 81 percent for full-time work.
- At two times the minimum wage, the rate for half-time work is 67 percent versus 72 percent for full-time work.
Thus fiscal policy encourages families at the bottom of the income ladder to work half-time rather than full-time, if they work at all. However, at higher income levels, these incentives are reversed.
- A family earning three times the minimum wage faces a marginal net tax rate of 81 percent for half-time work versus 63 percent for full-time work.
- At four times the minimum wage, the rates are 72 percent for half-time versus 59 percent for full-time.
"For low-income workers, the marginal cost of working is mostly lost benefits."
Another way of looking at this issue is to ask what happens to people who move from half-time to full-time work. As Table II shows:
- A minimum-wage couple that moves from half-time to full-time work will lose 97 cents out of every extra dollar they both earn.
- At 1.5 times the minimum wage, the couple will lose $1.06 for every $1.00 they earn; for this couple, working more literally means having less.
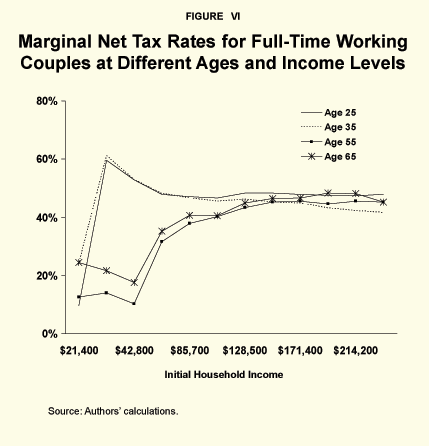
Marginal Net Tax Rates at Different Ages. Figure VI shows marginal net tax rates for couples at different ages. Note that at higher income levels, marginal net tax rates are roughly the same regardless of the amount earned. However, at lower income levels, there is a significant difference. Specifically:
- At 1.5 times the minimum wage, the marginal net tax rate is 60 percent and 61 percent for couples ages 25 and 35 respectively.
- At ages 55 and 65, these rates drop to 14 percent and 22 percent respectively.
The difference stems from taxes and spending programs that relate to children and are means-tested. These programs impose steep marginal net tax rates on young couples. It is ironic that the very fiscal policies designed to help children are the ones most responsible for discouraging low- and moderate-income families from working.
[page]To accurately measure lifetime average and marginal net tax burdens, we have included in fine detail every major tax and transfer program affecting American households. What emerges is a picture of a fiscal system with six characteristics:
- Our fiscal system is highly progressive over the bottom half of the income distribution. Couples working full-time and earning the minimum wage get back 32 cents in benefits (net of taxes) for every dollar they earn, while couples earning $64,000 (or three times the minimum wage) pay 30 cents in taxes (net of benefits) per dollar earned. Over the top half of the income distribution, the system is only mildly progressive.
- Most of the progressivity in our fiscal system comes from means-tested spending programs rather than taxes, and these are concentrated at the bottom of the income ladder.
- Workers at every income level face very steep lifetime marginal tax rates. Virtually all full-time American workers lose more than half of their earnings in taxes and forgone transfer benefits.
- The very highest marginal net tax rates are imposed on the lowest-income earners, largely because of the withdrawal of means-tested transfers and tax benefits. Indeed, working couples in the bottom half of the income distribution keep only a third or less of the income they earn, on net.
- If low-income household members work at all, our system strongly encourages them to work part-time rather than full-time. Couples earning 1.5 times the minimum wage actually reduce their standard of living if they work full-time rather than half-time.
- The principal reason for very high marginal net tax rates for low-income households is the existence of means-tested tax and welfare benefits tied to children. For example, a 25-year-old couple with children, earning 1.5 times the minimum wage, gives up 60 cents for every dollar earned; the marginal net tax rate on the same couple drops to 14 percent at age 55, when they are well past the child-rearing years.
Overall, our system is very generous to those at the bottom of the income ladder. But the price of that generosity is an incentive structure that strongly discourages those with the lowest skills from participating in the labor market.
NOTE: Nothing written here should be construed as necessarily reflecting the views of the National Center for Policy Analysis or as an attempt to aid or hinder the passage of any bill before Congress.
[page]- This study is based on Jagadeesh Gokhale and Laurence J. Kotlikoff, "Does It Pay to Work?" revised, November 2002. Laurence Kotlikoff is deeply grateful to The Smith Richardson Foundation, Boston University, Economic Security Planning, Inc., the Employment Policies Institute, and the National Institute on Aging for research support. The views expressed here and findings reported here are solely those of the authors and not those of their respective institutions.
- Higher-earning couples experience the loss of benefits when they go to work. But the higher their level of earnings, the smaller is this loss as a share of the increase in spending associated with working.
- Note: These are payroll taxes net of increases in Social Security benefits.
Jagadeesh Gokhale is a senior economic advisor with the Federal Reserve Bank of Cleveland and works in the areas of public finance, macroeconomics and applied microeconomics. He received his doctorate in economics from Boston University. He has published papers on national saving, private pensions, wealth inequality and generational accounting in top academic journals and books. Dr. Gokhale has coauthored several chapters on U.S. fiscal policy in the Budget of the United States Government and has testified before the Senate Budget Committee on U.S. Social Security reform. In his work on labor markets, he has analyzed the relationship between worker productivity and compensation and the impact of firms' wage and employment structures on corporate ownership patterns. Dr. Gokhale has published articles in the Quarterly Journal of Economics, the Journal of Economic Perspectives and the Review of Economics and Statistics and has authored a number of papers for the National Bureau of Economic Research.
Laurence J. Kotlikoff is Professor of Economics at Boston University, Research Associate of the National Bureau of Economic Research, Fellow of the Econometric Society, a member of the Executive Committee of the American Economic Association and President of Economic Security Planning, Inc., a company specializing in financial planning software. Professor Kotlikoff received his B.A. in Economics from the University of Pennsylvania in 1973 and his Ph.D. in Economics from Harvard University in 1977. From 1977 through 1983 he served on the faculties of economics of the University of California at Los Angeles and Yale University. In 1981-82 Professor Kotlikoff was a Senior Economist with the President's Council of Economic Advisers. Professor Kotlikoff has served as a consultant to the International Monetary Fund, the World Bank, the Harvard Institute for International Development, the Organization for Economic Cooperation and Development, the Swedish Ministry of Finance, the Norwegian Ministry of Finance, the Bank of Italy, the Bank of Japan, the Government of Russia, the Government of Bolivia, the Government of Bulgaria, the Treasury of New Zealand, the Office of Management and Budget, the U.S. Department of Education, the U.S. Department of Labor, the Joint Committee on Taxation, the Commonwealth of Massachusetts, the American Council of Life Insurance, Merrill Lynch, Fidelity Investments and other major U.S. corporations. He has provided expert testimony on numerous occasions to committees of Congress. Professor Kotlikoff is coauthor (with Alan Auerbach) of Macroeconomics: An Integrated Approach; author of Generational Accounting, What Determines Savings; coauthor (with Alan Auerbach) of Dynamic Fiscal Policy; coauthor (with Daniel Smith) of Pensions in the American Economy; and coauthor (with David Wise) of The Wage Carrot and the Pension Stick. He has also published extensively in professional journals, newspapers and magazines.