Medicare is in need of reform. In a few years, as medical costs escalate and baby boomers retire, Medicare and Social Security will place significant burdens on the federal budget:
- By 2030, about the midpoint of the baby boomer retirement years, deficits in Social Security and Medicare will require 37 percent of federal income taxes.
- This means that within three decades the federal government will either have to eliminate more than one-third of all the income-tax-funded services it currently provides or increase the income tax burden by more than one-third.
As the next generation of retirees replaces the baby boom generation, the financial picture for Social Security and Medicare will worsen, not improve. For example:
- By 2050, when today's college students begin to retire, Medicare and Social Security will require 54 percent of all federal income tax revenues in addition to all dedicated taxes and premiums.
- By 2070, the two programs combined will require almost 75 percent of all income tax revenues – leaving only one out of four dollars for all other federal government functions.
The Medicare and Social Security systems are committed to pay future benefits to retirees and workers. Currently, the cost of these future commitments are not reported as federal government debts. If they were, how much would the federal government owe – assuming we ended the two programs and paid only those benefits that have already been earned? The answer:
- The present value of accrued Social Security obligations in 2001 was $12.9 trillion.
- The present value of accrued Medicare obligations was $10.3 trillion for Medicare Part A benefits and $6.6 trillion for Part B benefits.
- And in 2001, the unofficial debt of these entitlement programs combined was $29.8 trillion, more than10 times the official federal debt.
If Congress passes a Medicare prescription drug benefit similar to that proposed in 2002 by House Republicans, federal obligations will immediately increase by an amount equal to more than 80 percent of the outstanding national debt.
What can be done? For the short run, we recommend fundamental reform. Rather than spending more, we recommend better use of the dollars we are already spending. Specifically:
- An integrated health insurance program should replace Medicare Part A, Medicare Part B and private medigap insurance.
- The new program should be comprehensive, offering catastrophic coverage and prescription drug benefits.
- Seniors should be able to enroll in any of a number of competing private health plans that offer these benefits, including HMOs and Medical Savings Account plans.
- With catastrophic coverage eliminating the need for medigap insurance, greater cost sharing and competition below the deductible will ensue.
A number of reform proposals would allow seniors who enroll in private plans to reselect a plan every 12 months. A long-term contract would be better, allowing seniors to switch plans only if they are unhappy with the plan they are in; a beneficiary's movement would prompt a severance payment from one plan to the other to compensate for any losses created by the move.
The principal advantage of long-term contracts is that they can remove an insurer's incentive to avoid enrolling the sickest beneficiaries and then underserve them after enrollment.
- Over a 12-month period, the most costly enrollees are the sickest (often those near death).
- Over a longer period, say, for the remainder of the enrollees' lives, the most expensive enrollees are those who are healthiest at the time of enrollment.
In general, seniors of the same age cohort cost Medicare about the same near the end of their lives, regardless of the age at which they die. However, before their death, those who live the longest will tend to require the most Medicare dollars because they will have more years to consume benefits.
At the time a person enters a health plan, his or her future health costs are very difficult to predict. We arrayed seniors who were born in 1912 into quintiles (fifths) according to the amount they spent on health care at ages 65 to 69. The results:
- One-third of those who were the lowest-cost beneficiaries from 65 to 69 years of age continued to cost the least for the rest of their lives; the other two-thirds rose to a higher-cost quintile.
- Of those who were the highest-cost beneficiaries at ages 65 to 69, only 27 percent cost the most for the rest of their lives; the remaining 73 percent fell to a lower-cost quintile.
- For each of the three middle quintiles, remaining lifetime spending was almost random, based on spending during the first five years.
An important part of this proposal is that movements of beneficiaries from one plan to another will necessitate compensation payment between the two plans. Plan X and Plan Y will agree to a beneficiary's move if the loser is compensated for its losses. The two plans would also have to agree on the amount of compensation.
[page]A debate on how to reform Medicare is on the horizon. President Bush has outlined the sort of reform he will support: one that allows beneficiaries to remain in traditional Medicare or to switch to private health plans with the added carrot of prescription drug coverage. Medicare reform is also a priority for Senate Majority Leader Bill Frist, suggesting that action may occur soon.
Reform ultimately boils down to two questions. (1) Who will pay for retirees' medical care? (2) Can we contain the growth in the amount we spend? To stem the growth in Medicare spending, we must consider all reform options. In addition, we have to think carefully about how to divide the burden between taxpayers and beneficiaries.
In this paper, we review the case for reform, survey recent Medicare changes and reform proposals, estimate the cost of the prescription drug proposals, and analyze several short- and long-term Medicare reform options.
[page]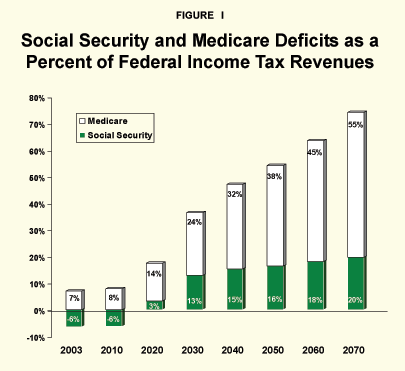
"By 2030, Social Security and Medicare deficits will require 37 percent of federal income taxes."
In a few years, Medicare and Social Security will significantly burden the federal budget as medical costs escalate and as baby boomers retire. Currently, Medicare requires general revenue transfers equal to 7.0 percent of income taxes. By 2026, it will claim 20 percent of federal income taxes in addition to dedicated payroll tax and premium revenues.1 When Social Security's claims on general revenues are added to Medicare's, the estimated future burden of elderly entitlements grows significantly. If prescription drug benefits are added, the burden on our children and grandchildren will be even greater.
The Combined Burden of Medicare and Social Security. Whereas Medicare currently requires a general revenue transfer, Social Security enjoys an offsetting surplus. The two programs combined will provide a small net transfer to the federal budget for the next five years. Once the baby boomers begin to retire, however, the financial picture will worsen rapidly. For example:2
- By 2030, deficits in Social Security and Medicare will require 37 percent of federal income taxes. [See Figure I.]
- This means that, within three decades, the federal government will either have to eliminate more than one-third of all the services currently funded by federal income taxes or increase the income tax burden by more than one-third.
The year 2030 is about the midpoint of the baby boomer retirement years. As the subsequent generation replaces the baby boomers, the financial picture for Social Security and Medicare continues to worsen. For example:
- By 2050, when today's college students begin to retire, Medicare and Social Security will require 54 percent of all federal income tax revenues in addition to all dedicated taxes and premiums.
- By 2075, the two programs combined will require almost 75 percent of all income tax revenues – leaving only one out of four dollars for all other functions of the federal government.
"By 2050, Medicare and Social Security will require 54 percent of all federal income tax revenues."
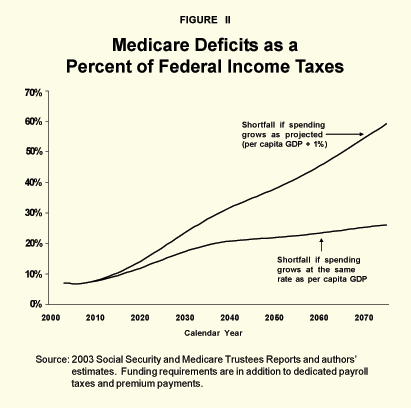
As a further indication of Medicare's budgetary burden, Figure II shows the program's funding shortfalls as a percent of federal income taxes using two assumptions about future costs. The upper line shows the costs as projected in the 2003 Trustees Reports. Those reports project that per capita spending will ultimately grow at a rate equal to the growth in per capita gross domestic product (GDP) plus 1 percent. The growth rate assumption is based on the recommendations of a technical review panel convened in 2000. However, suppose reforms could hypothetically reduce spending growth to the rate of increase in per capita GDP (the lower line in Figure II). Even then, Medicare would require substantial budget transfers, in addition to dedicated payroll taxes and premium revenues.3 While much lower than the currently projected shortfalls, Medicare's general revenue transfers would continue to exceed Social Security's.
Of course, Medicare's costs could grow faster than the Trustees are forecasting – say at a rate equal to the growth of per capita GDP plus 2 percent.4 That would be consistent with the experience of recent years and would imply that medical care would consume 60 percent of GDP by 2075. Further, Medicare and Social Security combined would consume more than 100 percent of income taxes.
"Adding a prescription drug benefit to Medicare would create a new commitment for the federal government."
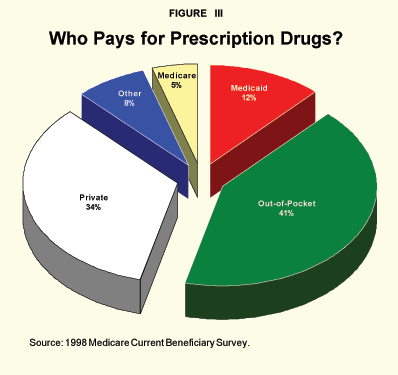
The Cost of Adding Prescription Drugs to Medicare. Adding a prescription drug benefit to Medicare would create a new commitment for the federal government. In 1998, Medicare paid for 5 percent of beneficiaries' prescription drugs. Medicaid paid 12 percent, beneficiaries paid 41 percent out of their own pockets, private insurance paid 34 percent, and other payers covered the remaining 8 percent of spending.5 [See Figure III.]
A number of proposals would expand Medicare to cover more of these costs. For example, the House of Representatives passed a bill last summer that would have created a separate benefit package with a separate voluntary premium. It had the following features: a $250 deductible, a $34 monthly premium, a 20 percent copay between $251 and $1,000, a copay of 50 percent between $1,001 and $2,000, and no coverage above $2,001 until a $3,700 cap on out-of-pocket expenditures was reached.
"Currently, Medicare pays 5 percent of prescription drug costs for beneficiares."
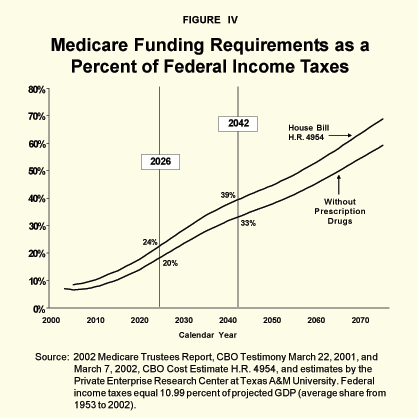
We estimate that under this House bill beneficiaries or other payers would be responsible for 73.4 percent of prescription drug spending, and Medicare would pay the remaining 26.6 percent.6 Figure IV summarizes the results.7 The bill would increase Medicare's claims on federal income taxes from 20 to 24 percent in 2026 and from 23 to 39 percent in 2042, the projected exhaustion years for the Hospitalization Insurance (HI) and Old-Age, Survivors and Disability Insurance (OASDI) Trust Funds, respectively.
"Under last year's House Republican bill, Medicare would pay 27 percent of drug costs."Cautions. These estimates are probably conservative. Since the rising cost of drugs would turn a modest benefit into a major cost if the deductible, premiums, copay ranges and catastrophic coverage threshold were not indexed, the bill indexes these parameters to the cost of prescription drugs. However, basing forecasts on the assumption that full indexation takes place probably underestimates the future cost of the legislation. The history of Supplemental Medical Insurance (SMI) premiums shows why. Originally, SMI premiums were set to cover 50 percent of SMI costs, which are mainly physicians' and clinic fees. But by 1982, the premium covered only 25 percent of SMI costs. The deductible for SMI started at $50 and has been $100 since 1991. This means that the deductible has risen at an annual rate of 1.9 percent, while SMI spending per capita has grown at an average rate of 11.8 percent, more than 6 times faster. As this indicates, Congress has allowed the beneficiaries' share of the cost to fall.
One final caveat is that projected spending does not account for changing third-party payments. Once the price consumers pay falls, the amount they demand naturally will rise. Also, as Medicare begins to pay for prescription drugs, employers may begin to drop such coverage for retired workers.
"Prescription drug benefits would increase Medicare's claims on income taxes."
The federal government, through Medicare and Social Security, has committed to pay future benefits to retirees and workers. Currently, these implied obligations are not reported as federal government debts. But firms that offer pensions to their employees must report accrued pension debts. And like private pensions, Social Security and Medicare have well-defined eligibility requirements and, in the case of Social Security, a benefit formula. Thus, it is possible to calculate the accrued obligations of our elderly entitlement programs at a point in time.
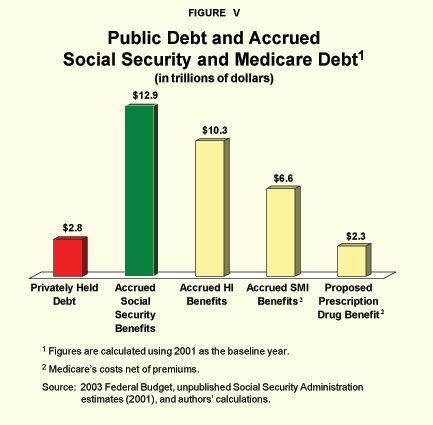
"Social Security and Medicare accrued benefits are 10 times the size of the privately held national debt."
Current Social Security and Medicare Implied Debt. Our elderly entitlement commitments arise as benefits accrue to workers who participate by paying taxes. Retirees receive Social Security benefits in the form of survivors, disability and retirement benefits, the bulk being retirement benefits. One's Social Security pension is based on the 35 highest annual earnings years, with earnings indexed for wage growth. Older workers who have completed 35 years of work are entitled to full Social Security benefits. Younger workers have lower accrued benefits, because they typically have lower earnings and fewer years in the labor force. Accrued benefits are those to which people are entitled today, assuming that we ended the two programs and paid off all liabilities. They can be calculated for any worker, regardless of age, as long as that worker is eligible. Medicare benefits accrue to all workers and their spouses after 10 years of paying Medicare payroll taxes.
"A Medicare drug benefit would create obligations equal to 82 percent of the privately held national debt."
Figure V shows the accrued Social Security8 and Medicare9 obligations alongside the debt held by the public, using the measure described above. As the figure shows:
- In 2001, the debt held by private investors stood at $2.8 trillion.
- The present value of accrued Social Security obligations that year amounted to $12.9 trillion.
- The present value, in 2001, of Medicare's accrued liabilities was $10.3 trillion for Medicare HI benefits plus $6.6 trillion for SMI.10
- Thus, the unofficial debt of the two entitlement programs was more than 10 times the size of privately held federal debt.
The Effects of a Prescription Drug Benefit. The purpose of calculating accrued debt is to make Congress and the public aware of the cost of creating a new entitlement. For example, adding the prescription drug benefit to Medicare without other reforms increases Medicare's total accrued obligations by 13.5 percent. Using our estimates of Medicare's future annual spending on prescription drugs and allocating costs to current beneficiaries, we estimate that the House's Medicare prescription drug benefit would increase Medicare's accrued liability by $2.3 trillion – equivalent to issuing bonds equal to 82 percent of the current privately held national debt.
House Democrats last summer pushed for a drug benefit that was more than twice as large as that the Republicans passed. Had the Democrats succeeded, additional accrued federal obligations would have more than doubled.
[page]Clearly, we are on an unsustainable path. That is one reason for the current interest in Medicare reform. Recent changes in Medicare are relevant to the prospects for reform, and some interesting ideas are being proposed. The following is a brief review.
"The House Democrats' proposal was twice as expensive as the Republican proposal."
Recent Legal Changes. Prior to the passage of the Balanced Budget Act (BBA) of 1997, the Hospital Insurance Trust Fund was quickly approaching exhaustion. By shifting some of the costs of home health care from the HI program – Medicare Part A – to the Supplemental Insurance (SMI) program – Medicare Part B – along with other reforms, the BBA postponed the Trust Fund's exhaustion. While this did not reduce Medicare's total burden on taxpayers, constraints on payments to providers and a more complete plan to risk-adjust payments to private insurers promised to affect costs.
The payment constraints were short-term solutions, and some were relaxed in 1999 by the Balanced Budget Refinement Act. The risk-adjusted payment mechanism was to be developed for Medicare's payments to newly established Medicare+Choice providers. Until 1997, payments to these HMOs were based on county cost factors, such demographic characteristics as the age and sex of their beneficiaries and whether the beneficiaries participated in Medicaid or the Disability Insurance program. Since 1997, the Centers for Medicare and Medicaid Services (CMS), formerly the Health Care Financing Administration, has developed a more comprehensive way to risk-adjust payments.
Beginning in January 2004, a new risk-adjustment model, the Hierarchical Condition Category (HCC), will calculate a prospective payment for each Medicare enrollee based on age, sex and whether the enrollee has experienced a "selected significant disease." The preliminary version of the HCC model uses 61 significant disease categories to predict an enrollee's expected spending in the following year. In 2004, 30 percent of payments to Medicare+Choice providers are scheduled to be risk adjusted.11
National Bipartisan Commission on the Future of Medicare. The 1997 Balanced Budget Act established the National Bipartisan Commission on the Future of Medicare to develop reforms in anticipation of the baby boomers' retirement. The commission's product, the Breaux-Thomas proposal, did not receive the needed 11 of 17 commission member votes to be recommended to Congress. However, Breaux-Thomas had many features that are relevant to the current debate.
"The Breaux-Thomas proposal would allow beneficiaries to choose their health plans."
The distinguishing component of Breaux-Thomas was a premium support system that would allow beneficiaries to choose from a menu of health plans. The health plans would compete against one another in providing a standard benefit package. Plans could offer more benefits and could set their own deductibles and copays. Private plans and the government fee-for-service plan would offer optional prescription drug coverage. Lower-income beneficiaries would be guaranteed access to the plans offering prescription drugs. Beneficiary premium payments would cover, on average, 12 percent of the standard package's cost.
Breaux-Thomas also recommended combining Parts A and B, lowering deductibles and copays, and providing prescription drug benefits to lower-income retirees as the premium support system was phased in. It further recommended raising the eligibility age to follow Social Security's schedule.
The proposal expected the premium support system to reduce Medicare's growth rate by 1 to 1.5 percentage points below the projected growth at that time. Even so, the commission recognized that the Medicare burden would grow.12
The Bush Administration Proposal. The president's strategy for reforming Medicare includes giving beneficiaries the choice of remaining in traditional Medicare or moving either to a privately run health care plan (similar to the Bipartisan Commission's plans) or to managed care plans (such as Medicare+Choice).
Those remaining in traditional Medicare would receive a discount card, expected to reduce their prescription drug spending by up to 25 percent. Those choosing the traditional Medicare option also would receive coverage against high out-of-pocket spending on prescription drugs.
The second option, "Enhanced Medicare," would give Medicare enrollees choices similar to those in the Federal Employees Health Benefit program. All plans would offer a standard prescription drug benefit at least as generous as that of traditional Medicare, would cover preventive care, and would close the catastrophic gaps in traditional Medicare – at no additional cost to beneficiaries.
A new agency, the Medicare Center for Beneficiary Choices (MCBC), would administer Enhanced Medicare. Plans interested in participating in the new program would compete for patients by submitting bids to the MCBC. Participants would not be constrained in their choice of doctors. It is not clear whether payments to participating insurers would be adjusted for the risks associated with the pool of beneficiaries who choose their plan.
The third option, Medicare Advantage, is a continuation of Medicare+Choice, a managed care program. This option would bid to provide the same expanded services as Enhanced Medicare. Managed care plans limit patients' choices of doctors, but in exchange offer expanded coverage or lower cost sharing.
"The president's proposed reforms would cost $400 billion over the next 10 years."
The president's 2004 budget projects the added costs of his proposed reforms at $400 billion over the next 10 years. By comparison, the prescription drug bill passed by the House of Representatives last summer was projected to add $389 billion to Medicare's costs. Because the House bill would have relieved some of the burden now borne by Medicaid, the net impact on the federal budget was projected to be $337 billion over 2003 to 2012.
[page]While adding prescription drug coverage is a costly proposition, prescription drugs have an important place in any reformed Medicare program. Because Medicare beneficiaries pay for drugs out of pocket, but pay for physician visits and surgical procedures with Medicare money, they perceive the former to be more expensive than the latter. This encourages too much spending on physician therapies and hospital therapies and too little on drug therapies. Covering prescription drugs and doctor visits the same way could reduce total treatment cost. But without broader reforms that reduce the federal government's role in retiree health payments or reduce the growth of Medicare costs, a new benefit represents additional burdens for future taxpayers.
What reforms would reduce the federal government's role? To begin, we must reconsider all of Medicare. Beneficiaries must have incentives to control their own spending. In addition, beneficiaries must have a health care package that meets the market test – that provides coverage comparable to that available in the marketplace. Private sector health insurance contains two elements that Medicare lacks: prescription drug benefits and catastrophic coverage.
Short-term Reforms. One option is to combine Medicare Part A and Part B and add prescription drug benefits and catastrophic coverage to the package. As with conventional private health insurance, one overall premium would be paid to one plan.13 Deductibles and copayments would be limited to a maximum out-of-pocket amount. A Medical Savings Account (MSA) owned by the beneficiary could cover this larger cost sharing. The beneficiary could use unspent funds on nonmedical needs. This would give users of the health care system an incentive to monitor providers, services and bills in order to reduce Medicare's monitoring cost.
The greater level of cost sharing we recommend raises legitimate concerns about lower-income retirees' access to health care. These retirees could get a subsidized MSA, just as Medicaid now covers low-income retirees' medigap insurance costs.
Another concern about greater cost sharing is that retirees will forgo care below the deductible. The Rand Health Insurance Experiment found that increased use of "free" medical care had little effect on health outcomes.14 In a free society, individuals must make their own choices. Medicare should provide retirees with access to health care that is affordable not only for them but for taxpayers as well.
"Medicare was modeled on a Blue Cross plan popular in 1965; Blue Cross has since changed, but Medicare has not."
Under the current system, Medicare is publicly funded but privately administered – in most places by Blue Cross Blue Shield. The BCBS role is strictly administrative, however. The federal government determines the Medicare benefit package. When Medicare was created in 1965, Congress largely followed the design of a Blue Cross plan popular at the time. In the years since, medical science and medical economics have changed. So have Blue Cross and other private plans. But the Medicare program has remained static due to political pressures. This stasis has caused many of the problems our paper considers.
To allow Medicare to evolve through time, competing private sector insurers must be allowed to offer different types of benefits and prices to attract different enrollees.
The Bipartisan Commission and the president's recent proposal suggest that the Federal Employee Health Benefits Program (FEHBP) could become a model for Medicare reform. Under FEHBP, individuals enroll annually in competing health plans and all enrollees in a plan pay the same premium. There are problems associated with competitors receiving premiums that are unrelated to expected costs, such as altering the quality of care or screening out sicker potential enrollees. To overcome these problems, payments must be risk adjusted. That means competing health plans will have to be paid different premiums for different patients, based on their risk class.
An alternative is to encourage lifetime enrollment in health plans at risk-adjusted premiums. In such a system, the initial premium paid to a plan would reflect expected health care costs. Any movement among plans would require one plan or the other to make compensating payments. These issues are addressed more fully below.
Long-term Reforms. Even with successful cost-reducing reforms, Medicare's burden on future taxpayers will continue to grow with the size of the retired population. Prepaying health care spending is one way to shift the future burden to current taxpayers. In this way, each generation would pay its own way. In a previous work, we analyzed prepaid retirement health insurance accounts.15 Prepayment not only transfers some of the future burden to current workers, but it also increases the savings rate and thereby the country's future productive capacity and income.
In our proposal, we envisioned that all new retirees would have a prepaid account sufficient to pay remaining lifetime health care spending. We suggested that retirees would be able to choose from a menu of health care plans and sign lifetime contracts. Long-term contracting can potentially address cost growth by giving health plans the incentive to manage care over beneficiaries' lifetimes.
[page]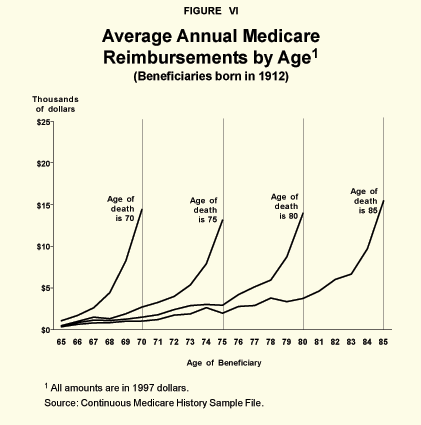
"Even with successful cost-reducing reforms, Medicare's burden on future taxpayers will grow with the size of the retired population."
Several issues about long-term contracting arise. The first arises when insurers attempt to attract or avoid customers based on their expected health care costs. The second is the expenditure risk insurers would face over the length of a lifetime contract. Expenditure risk arises from price level changes, technological advances and market adjustments to the new form of contracting. The third issue in long-term contracting is the ability of beneficiaries to move to other insurers should they become dissatisfied with their care. The fourth is how insurers would deal with end-of-life spending.
Health Risks versus Longevity Risks. Adverse selection and screening are hurdles in every insurance market. Screening by insurers is a particular problem in the Medicare market. As noted above, CMS is currently developing more precise ways to risk-adjust prospective payments to Medicare+Choice providers. These prospective payments are for a one-year contracting period. In the context of long-term contracting, beginning with initial entry into Medicare at age 65, risk adjusting takes on another dimension. Insurers must consider longevity risks in addition to the typical medical care risks over a one-year health insurance period.
When contracts run to the end of a beneficiary's life, these two risks oppose one another. Individuals who are in ill health at age 65 represent high immediate health expenditure risks, but they are also more likely to die at younger ages. Conversely, individuals in robust health at age 65 have low expected spending in the next few years, but they may have more years of receiving benefits.
"Thirty percent of annual Medicare spending is on patients in the last two years of life."
The lifetime spending patterns associated with various ages of death are depicted in Figure VI for Medicare beneficiaries born in 1912.16 The four series of annual spending are for beneficiaries dying at the ages of 70, 75, 80 and 85. Note the three points of interest about this graph. First, average annual spending rises in the year of death and in the years immediately preceding.17 Medicare spending on beneficiaries in their last two years of life accounts for upward of 30 percent of Medicare's total reimbursements every year.18 Second, spending in the last year of life for this group was fairly constant in real 1997 dollars – with spending of $14,421, $13,137, $13,973 and $15,476 for those who died at the ages of 70, 75, 80 and 85, respectively. Finally, even though the cost of death is roughly the same for the four groups of beneficiaries, those who live longer spend more Medicare dollars in the intervening years.
"Medicare spends more on those who live longer than on those who die earlier."
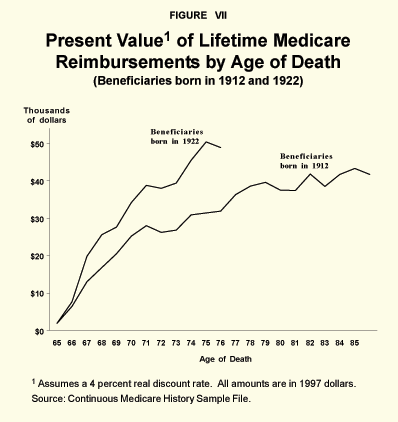
Figure VII illustrates the same point in a different way. The figure shows the present value of spending between the age of 65 and the age of death, using a 4 percent real discount rate, for individuals born in 1912 and 1922. The two series show that Medicare spends more on beneficiaries who survive to higher ages than those who die earlier.
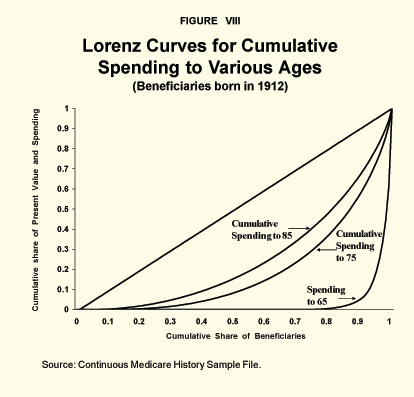
"In 1977, 5 percent of beneficiaries accounted for more than 80 percent of Medicare spending among individuals born in 1912."
The Concentration of Spending: Lorenz Curves and Gini Coefficients. Another way of looking at the trade-off between health care risks and longevity risks is illustrated in Figure VIII, which graphs three Lorenz curves for beneficiaries born in 1912. A Lorenz curve is a depiction of a distribution's inequality and a convenient way of summarizing Medicare's spending distribution. It relates the cumulative share of beneficiaries to the cumulative share of Medicare spending, after spending has been sorted from lowest- to highest-cost patient. The Lorenz curve for spending at age 65 for the beneficiaries born in 1912 reflects the fact that more than 70 percent had no reimbursements in 1977. Further, the lowest 95 percent of beneficiaries accounted for less than 20 percent of aggregate spending at age 65. This implies that 5 percent of beneficiaries account for more than 80 percent of spending. If spending were uniformly distributed (if spending by all beneficiaries was the same), the Lorenz curve would fall on the 45 degree line in Figure VIII. Lorenz curves farther from the 45 degree line indicate more inequality in health care costs.
As the period over which spending occurs is lengthened, the degree of inequality diminishes and the Lorenz curve moves closer to the 45 degree line. The Lorenz curve for cumulative spending to age 75 is to the left of the curve for spending at age 65. The curve for cumulative spending to age 85 shows a further reduction in inequality.19
The Lorenz curve can be summarized by a single statistic known as the Gini coefficient. The coefficient is equal to the area between the Lorenz curve and the 45 degree line, divided by the total area of the triangle to the southeast of the 45 degree line. The coefficient thus ranges between 0 and 1, with numbers close to 0 reflecting rather equally distributed reimbursements and coefficients close to 1 reflecting unequally distributed reimbursements.
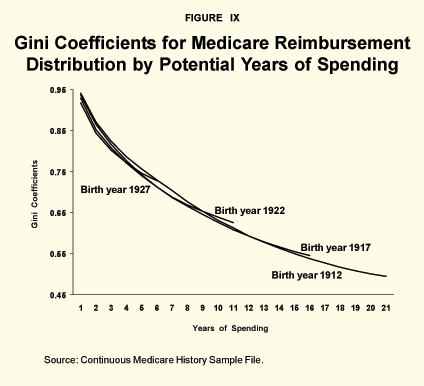
"The longer the time horizon, the more equal is Medicare spending across all beneficiaries who enter the program in a given year."
Figure IX depicts the Gini coefficients for four birth years for successively longer computation periods. As was expected from the Lorenz curves in Figure VIII, the Gini coefficients decline as the years over which spending is aggregated increase. The coefficient for the 1912 birth year is 0.94 for spending at the age of 65, 0.61 for spending to the age of 75, and 0.49 for spending to the age of 85. The coefficient series for each birth year indicate that inequality declines at a declining rate. The separate series also show that the degree of within-birth-year inequality has declined at age 65, but as more years are added the degree of inequality is similar across birth years.
"Regardless of the birth year, longer time horizons lead to less concentration of spending among a few high-cost beneficiaries."
The previous graphs showed that as the period lengthened, the degree of inequality in the reimbursement distribution declined. Thus, insurers of long-term contracts would face a dramatically different distribution than they would face with one-year contracts. However, this evidence, combined with the evidence on spending by age of death, does not necessarily indicate that longer-term contracts pose a simpler insurance problem. Spending is less concentrated among high-cost users, but it is not uniformly distributed.20
Spending Dynamics: Movement among Quintiles. Yet another way of approaching this issue is to ask how well past spending predicts remaining lifetime spending among Medicare beneficiaries. Table I shows how well spending between ages 65 and 69 predicts remaining lifetime spending for beneficiaries born in 1912.21 Spending for the two computation periods is sorted from lowest to highest and divided into five equal-size groups of beneficiaries, or quintiles. Moves between quintiles are then tabulated. The first row in the table identifies the movements of beneficiaries who were in the bottom quintile for spending between 65 and 69 years of age. One-third of these beneficiaries were in the same quintile in the remaining lifetime spending distribution. Another 21 percent migrated to the second, 18 percent to the middle, 15 percent to the fourth, and 13 percent to the top quintile. Overall:
- One-third of those who were the lowest-cost beneficiaries from ages 65 to 69 continued to be the lowest-cost beneficiaries for the rest of their lives.
- The other two-thirds rose to a higher-cost quintile.
- Of those who were the highest-cost beneficiaries at ages 65 to 69, only 27 percent continued to be the highest-cost beneficiaries for the rest of their lives.
- The remaining 73 percent fell to a lower-cost quintile.
If spending between 65 and 69 years of age were a perfect predictor of remaining lifetime spending, all members of each group (100 percent) would fall in the same quintile in both periods. If the initial location were completely unrelated to subsequent spending, 20 percent of each original group would fall into each of the remaining lifetime spending quintiles.
The second, middle and fourth quintiles show great mobility in both directions. For example, beneficiaries originally in the second quintile were almost uniformly distributed in the remaining lifetime spending quintiles. The pattern suggests that remaining lifetime spending for each of the three middle quintiles is almost random, based on spending during the first five years.
"Only one-third of those who were the lowest-cost beneficiaries from ages 65 to 69 have the lowest cost for the rest of their lives."
Expenditure Risks. The second concern with long-term contracting is the risk insurers would face as spending on medical care rises relative to the increase in national income. Continuing with our previous example, people born in 1912 who died at the age of 75 spent $31,915 before they died, on the average. By contrast, people born in 1922 who died at the age of 75 spent $48,865 before they died. That is an increase of 53 percent, even though the age difference between the two groups is only 10 years. How can insurers cope with this risk? Rising expenditures can be addressed by indexing Medicare's annual per capita premium payments to health plans to reflect spending growth among all beneficiaries or spending growth in the private market.
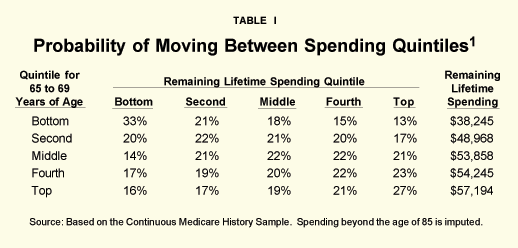
Movement among Health Plans. Beneficiaries may find that they would like to move to another insurer because they relocate or because they have become dissatisfied with their current insurer. In the event of a move, the receiving insurer would voluntarily accept only patients who bring with them a premium that covers the present value of their expected future Medicare reimbursements. For example, the last column in Table I reports the present value, at age 70, of remaining lifetime spending for each quintile. These amounts approximate the remaining lifetime spending expected for a beneficiary at age 70 in each of the quintiles. If the premium does not cover this amount, a severance payment from the original insurer could make up the deficiency. As John Cochrane has shown, severance payments solve many of the problems associated with long-term contracting.22
The system might work like this. Assume that each year Medicare pays an insurer a premium on behalf of each beneficiary. The premium payments continue for a prespecified number of years so that they equal the present value of expected spending for each beneficiary when the beneficiary entered the plan. Payment adjustments can take into account unexpected changes in medical care expenditures. At any point in time, the Medicare premium payment thus may be less than, greater than, or equal to the expected annual costs for the beneficiary at that time.
Now consider that a beneficiary chooses to move from Plan X to Plan Y. If Medicare makes a payment exactly equal to the beneficiary's expected health care costs, no severance payment would be required. If Medicare's payment to Plan X exceeds the expected cost of care because the beneficiary's expected costs have declined, Plan X would suffer an economic loss from the move. To induce Plan X to agree to the transfer, Plan Y would receive a reduced payment from Plan X equal to the beneficiary's lower expected cost, but Plan X would continue to receive the original stream of annual payments.
How should the amount of compensation be determined? Ideally, by the marketplace. Plan X and Plan Y will agree to the exchange if the loser is compensated. The amount of compensation would be determined by voluntary agreement.
Notice that Medicare's payments under this scenario are administratively determined, but the marketplace would determine the compensation plans receive from each other. Insurers can set premiums based on a beneficiary's risk – and beneficiaries can move between plans.
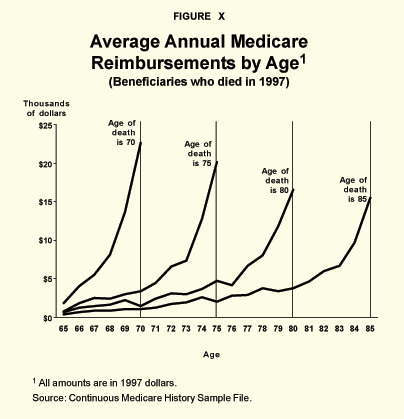
"People born in 1912 have about the same costs of dying, regardless of the year in which they die."
Plans likely will develop a comparative advantage in certain specialties. Under these circumstances, one plan will have lower costs than another to achieve the same outcome. This would create opportunities for both the health plans and beneficiaries to gain.23
End-of-Life Spending. We saw in Figure VI that people born in the same year have about the same costs of dying, regardless of the year in which they die. This may appear surprising. One might have anticipated that the cost of dying at, say, age 70 would be lower than at age 85, given rising health care costs. In order for the cost of dying to be roughly the same over the 15-year period, the health care system must be systematically spending less on 85-year-olds at the time of death than it spends on 70-year-olds at the time of death, in any given year.
"Medicare spends less on older patients than it spends on younger patients who die in the same year."
Figure X shows that this is the case. The figure depicts the cost of care in the year of death for people who died in 1997. As the figure shows, Medicare spent less on older patients than on younger patients who died that year. For example, average spending in the last year of life on those who died at age 70 was $22,649. This is 45 percent more than the $15,576, spent on those who died at age 85.24
Why does the heath care system spend less on older patients near the end of life? Perhaps older patients are less able to benefit from expensive procedures, especially invasive procedures. The value of renal dialysis and kidney transplants, for example, is thought to decline with age. Possibly the health care system makes implicit cost-benefit decisions. Since younger patients have more potential remaining years of life, they promise a larger payoff than do older patients, for the same procedure.
Regardless of the actual explanation for the pattern in Figure X, a reformed Medicare system should not give health plans an incentive to systematically underprovide care to the sick or those near the end of life.
Two forces will help minimize the problem and improve incentives over the current system. First, allowing patients to move from plan to plan should lead to better monitoring by the patients themselves. Second, requiring plans to compensate each other for their losses when beneficiaries switch plans will create a "market for sick people."
[page]The United States, along with the rest of the developed world, is facing the retirement of the postwar baby boom generation. Sustaining our elderly entitlement programs into the future in their current forms will result in a significantly higher burden for our children and grandchildren. The Medicare program must prepare for both a rapidly growing retiree population and increasing costs per retiree. Only a reformed Medicare program will be able to cope.
One suggestion is to combine Parts A and B, add prescription drug coverage, and eliminate catastrophic coverage gaps. For those who prefer a fee-for-service alternative to managed care, we recommend raising the deductible and copays up to an out-of-pocket maximum, and allowing individuals to supplement their coverage with a Medical Savings Account.
"Long-term contracts and severance payments would give health plans incentives to accept the sickest patients."
Absent other reforms, these changes will not prevent increases in future taxpayer burdens. Another reform that many find attractive is to offer these benefits conditional on a beneficiary selecting from a menu of private insurance providers. The allure of this reform is that health plans would compete on price; but with uniform (community-rated) premiums and open enrollment, adverse selection and screening could be a serious problem. The continued advancements in risk adjusting prospective payments to Medicare + Choice providers holds promise in overcoming adverse selection problems. But as long as CMS continues to set the payments to insurers, this solution is far from perfect.
Long-term contracts with severance payments is a better way of overcoming screening on the part of insurers and other associated problems. The main benefit of long-term contracting is that it relieves CMS of its price-setting role. Although Medicare payments would continue to be set administratively, health plans would compensate each other for their losses when beneficiaries move from one plan to another. Health plans would have to compete on the amount of compensation they require to accept transfers. The plans would have to consider both longevity and health risks in setting compensation levels.
NOTE: Nothing written here should be construed as necessarily reflecting the views of the National Center for Policy Analysis or as an attempt to aid or hinder the passage of any bill before Congress.
[page]Remaining lifetime spending for the 1912 birth cohort, last observed at age 85 in 1997, is imputed using the experience of the 1897 birth cohort that reached age 100 in 1997. Data are available for the 1897 birth cohort for the ages 77 to 100 and are used as follows. First, imputations are limited to members of the 1897 cohort who survived to age 85. Their real Medicare reimbursements are then discounted to age 65 using a 4 percent rate. Reimbursements between ages 80 and 85 are summed for each enrollee, as are reimbursements between ages 86 and 100. The ratio of post-85 reimbursements to the reimbursements between ages 80 and 85 is then calculated for each beneficiary who survives to age 85. Spending ratios cannot be calculated for beneficiaries who had no spending between ages 80 and 85. Also, the top and bottom 1 percent of ratios are set to the 99th and 1st percentile, respectively. These ratios are used to impute remaining lifetime reimbursements for the 1912 birth cohort by applying them to this cohort's members' summed reimbursements between ages 80 and 85.
The older cohort's ratio of spending after age 85 to spending between ages 80 and 85 is assigned to the younger cohort by first stratifying the two samples by spending quintiles and sex, then randomly matching within these cells. Spending between ages 80 and 85 for members of the 1912 cohort who survive to age 85 are ranked and divided into quintiles. Within quintiles they are divided between men and women and randomly assigned a spending ratio from the 1897 birth cohort similarly categorized by quintile and sex. The spending ratio is then used to impute remaining lifetime spending after the age of 85 for survivors to age 85.25
[page]- The projected transfers for 2026 are pertinent because this is when the Hospital Insurance (Part A) Trust Fund is expected to be exhausted. Trust Fund exhaustion has been considered the bellwether of the system's financial status, but beginning in 2013, Part A spending will exceed payroll tax revenues, necessitating transfers from the rest of the budget.
- In making these estimates, future federal individual and corporate income taxes are assumed to remain at their 2001 share of Gross Domestic Product (GDP), which was 10.99 percent. This assumption is based on the 50-year average income tax share of GDP, from 1953 to 2002. During that period, income taxes as a percent of GDP ranged from a high of 13.7 percent in 1952 to a low of 9.3 percent in 1984, 1986 and 1992.
- The transfers under the lower growth rate assumptions are 11, 19 and 22 percent of federal income taxes in 2020, 2040, and 2060, respectively.
- The Trustees' high-cost projection assumes that per capita spending grows 2 percent faster than per capita GDP for a number of years beyond the initial 25-year period, and then decreases to the intermediate assumption of GDP plus 1 percent by 2052.
- Based on the Medicare Current Beneficiary Survey Cost and Use File, Medicare's share of prescription drug spending grew to 8.1 percent in 1999.
- The estimates of Medicare's payments as described in House bill H.R. 4954 are derived from the prescription drug expenditure distributions as presented in March 22, 2001, Congressional Budget Office (CBO) testimony.
- The first 10 years of projected prescription drug costs are from the March 2002 CBO testimony. To estimate costs beyond 2012, we used the conservative assumption that costs grow at the same rate as the combined cost of the HI and SMI programs and assumed Medicare will pay for 26.2 percent of prescription drug spending.
- The accrued Social Security benefits depicted in the figure are based on estimates by Goss (1999) and updated by the Social Security Administration. See Stephen C. Goss, "Measuring Solvency in the Social Security System," in Prospects for Social Security Reform, Olivia S. Mitchell, Robert J. Meyers, and Howard Young, eds. (Philadelphia: University of Pennsylvania Press, 1999), for a description of this measure, which is referred to as the "maximum transition cost." More recent unpublished estimates of maximum transition cost are available from the Social Security Administration. The maximum transition cost as reported includes the offsetting effects of the Social Security Trust Fund. Because we do not separately report Trust Fund debts in Figure V, the offset is removed from the maximum transition cost.
- Accrued Medicare benefits are assigned to individuals age 28 and above in 2001. We chose 28 based on the assumption that individuals are fully vested in Medicare by that age. Accrued benefits are equal to 100 percent of the present value of anticipated HI benefits. To reflect the fact that beneficiaries pay premiums equal to 25 percent of SMI, only 75 percent of anticipated SMI spending is included in the calculation. Like the calculation for Social Security, we apply life tables and discount future benefits at the government borrowing rate. Medicare's accrued liability is larger than Social Security's because workers and their spouses are fully vested in Medicare after 10 years of program participation, while workers with fewer than 35 years of participation are only partially vested in Social Security.
- See Liu Liqun, Andrew J. Rettenmaier and Thomas R. Saving, "Meaningful Measures of Fiscal Deficit and Debt: The Case for Incorporating Entitlement Debts," PERC Working Paper No. 0211, May 2002, Private Enterprise Research Center, Texas A&M University.
- The HCC model replaces the Primary Inpatient Diagnostic Cost Group, or PIP-DCG, model currently in use. The PIP-DCG model's major drawback has been that risk adjustments were limited to inpatient diagnoses, which affect only about 20 percent of enrollees. There have also been concerns that its reimbursements for healthy individuals are too high. The HCC promises to produce more accurate reimbursements and to reduce the data collection burden on participating providers.
- The commission also recommended redefining the system's "solvency." Under the definition suggested, insolvency would occur when Medicare's spending from general revenues exceeded 40 percent of the program's total spending. See the Breaux-Thomas proposal at http://thomas.loc.gov/medicare/bbmtt31599.html.
- The inclusion of catastrophic coverage will lead to the demise of medigap insurance, which for most retirees converts Medicare into a first-dollar coverage policy. It is this first-dollar coverage that ensures beneficiaries do not care about cost and have no financial incentive to monitor health care providers. Closing the gaps in Medicare will eliminate the need for medigap.
- Joseph P., Newhouse, Free for All? Lessons from the Rand Health Insurance Experiment (Cambridge, Mass.: Harvard University Press, 1996).
- Andrew J. Rettenmaier and Thomas R. Saving, The Economics of Medicare Reform (Kalamazoo, Mich.: W.E. Upjohn Institute for Employment Research, 2000).
- The data used to produce this graph and the ones that follow are from the Continuous Medicare History Sample. The data are a 1 percent sample of all Medicare beneficiaries and are available from 1974 to 1997. It is thus possible to observe beneficiaries born in 1912 from age 65 to age 85. At the end of the sample period, 42 percent of the beneficiaries born in 1912 were alive (survived to age 86). All reimbursements were converted to 1997 dollars using the Personal Consumption Expenditures price deflator.
- For a presentation of annual Medicare spending by age of death for individuals who died in 1990, where the deflator was based on the rate of change in Medicare spending on elderly beneficiaries, see James Lubitz, Beebe James and Colin Baker, "Longevity and Medicare Expenditures," New England Journal of Medicine, Vol. 332 (15), April 1995, pages 999-1003. The authors also estimate cumulative lifetime spending by age of death using the 1990 cross-sectional experience rather than the present value of spending within birth years.
- See Andrew J. Rettenmaier and Zijun Wang, "Explaining the Growth of Medicare: Part II," NCPA Brief Analysis No. 408, August 6, 2002, National Center for Policy Analysis.
- Each calculation considers the same group of beneficiaries: all those originally in the sample at age 65. Should an individual die between age 65 and the last age in the summation, his or her reimbursements end in the final year of life.
- Predictability of remaining lifetime spending based on past spending patterns is still an open question. Several papers have addressed year-to-year persistence in health care spending, as has the risk-adjusted prospective payment system for Medicare+Choice providers. See Daniel Feenberg and Jonathan Skinner, "The Risk and Duration of Catastrophic Health Care Expenditures," Review of Economics and Statistics 76 (1994), pages 633-47; and Matthew Eichner, Mark B. McClellan and David A. Wise, "Insurance or Self-Insurance? Variation, Persistence, and Individual Health Accounts," in Inquiries in the Economics of Aging, David A. Wise, ed. (Chicago: University of Chicago Press, 1998), pages 19-45.
- We observe this birth year from 65 to 85 years of age. However, total lifetime spending is not known for a significant share of these beneficiaries, given that more than 42 percent are alive at the end of the period for which we have data. To overcome this limitation, we impute remaining lifetime spending for those still alive at age 85. The imputed values are derived from the experience of the beneficiaries born in 1897 who are observed to the age of 100. The imputation procedure is described in the appendix. Combining the imputed values with the actual values, we then consider how spending between ages 65 and 69 is related to remaining lifetime spending. Only individuals who are alive at the age of 69 are included in the comparison.
- John H. Cochrane, "Time-Consistent Health Insurance," Journal of Political Economy, Vol. 103 (3), June 1995.
- Individual beneficiaries may, and probably will, make premium payments to the plans. Such payments do not change the fundamental analysis of this section.
- Spending in the year of death represents, on average, six months of spending.
- For the fraction of beneficiaries who had no reimbursements between 80 and 85 years of age in each cohort, a different imputation procedure is used. First, the location in the remaining lifetime spending distribution is found for members of the 1897 birth year. This location is randomly assigned by sex to members of the 1912 birth year who also had no spending between ages 80 and 85. Based on that location, remaining lifetime spending is assigned.
Dr. Andrew J. Rettenmaier is the Executive Associate Director at the Private Enterprise Research Center at Texas A&M University. His primary research areas are labor economics and public policy economics with an emphasis on Medicare and Social Security. Dr. Rettenmaier and the Center's Director, Thomas R. Saving, have presented their Medicare reform proposal to U.S. Senate Subcommittees and to the National Bipartisan Commission on the Future of Medicare. Their proposal has also been featured in the Wall Street Journal, New England Journal of Medicine, Houston Chronicle and Dallas Morning News. Dr. Rettenmaier is the co-principal investigator on several research grants and also serves as the editor of the Center's two newsletters, PERCspectives on Policy and PERCspectives. He is coauthor of a book on Medicare, The Economics of Medicare Reform (Kalamazoo, Mich.: W. E. Upjohn Institute for Employment Research, 2000) and an editor of Medicare Reform: Issues and Answers (The University of Chicago Press, 1999).
Dr. Thomas R. Saving is the Director of the Private Enterprise Research Center at Texas A&M University. A University Distinguished Professor of Economics at Texas A&M, he also holds the Jeff Montgomery Professorship in Economics. Dr. Saving is a trustee of the Social Security and Medicare Trust Funds. His research has covered the areas of antitrust and monetary economics, health economics, the theory of the banking firm and the general theory of the firm and markets. He has served as a referee, or as a member of the editorial board, of several major U.S. economics journals and is currently an editor of Economic Inquiry. Dr. Saving has authored many articles and two influential books on monetary theory. He has been president of both the Western Economics Association and the Southern Economics Association. After receiving his Ph.D. in Economics in 1960 from the University of Chicago, Dr. Saving served on the faculties of the University of Washington and Michigan State University, moving to Texas A&M in 1968. Dr. Saving served as chairman of the Department of Economics at Texas A&M from 1985-1991.