Social Security and Medicare have made future promises far in excess of tax revenues that will be collected at current tax rates. The difference between what has been promised to current and future generations and what will be collected from taxes dedicated to fund these programs is an "unfunded liability."
How large are the federal government's unfunded obligations? That depends on how we measure them.
- If we confine our horizon to the next 75 years, as government actuaries have traditionally done, the unfunded liability is about $18 trillion in today's dollars – more than six times as much as the federal government's outstanding bonds.
- If we focus only on people who are already participating in the system (either as beneficiaries or as taxpayers), the government's net debt is more than $24 trillion – more than twice our current gross domestic product (GDP).
- If we consider only benefits that have been accrued so far (i.e., if we ended the program tomorrow and only paid benefits people have already earned), the debt is about $30 trillion – about three times the size of our GDP.
- If we look indefinitely into the future – and include not only people who are participating today, but all future generations who will pay taxes and draw benefits – the U.S. government's Social Security and Medicare unfunded obligations are equal to almost $50 trillion in today's dollars.
What does it mean to say that we have $50 trillion in unfunded obligations? It means that in order to ensure the government will keep all its promises, we need to have $50 trillion on hand right now, invested at a rate of return of about 6 percent. The failure to have these funds on hand and invested today means that the overall obligation will become larger and grow through time. It also means that the programs are severely underfunded at today's tax rates. To close the funding gap, we will have to endure either substantial tax increases or significant benefit cuts in future years.
[page]What is a debt? Most people have financial debts such as mortgages, credit card balances, and car loans. They may also have financial debts owed to them in the form of certificates of deposit or corporate bonds. All these debts have two critical features: (1) they are owed to an individual or business, and (2) they represent an obligation to pay that is enforceable in a court of law.
The federal government also has debts. Like private debts, there are bonds held by the public and by foreign investors. But unlike private debts, there also are promises to pay such benefits as Medicare and Social Security. Should these commitments count as part of the government debt? On the one hand, the government's promises to pay Medicare and Social Security benefits are not enforceable in a court of law. Future Congresses can revoke the promises of past Congresses. On the other hand, workers and retirees have changed their savings behavior because they expect to receive Social Security and Medicare. They are thus acting as if they have an implicit bond from the federal government. This is one reason why breaking such commitments is very difficult.
There has been significant interest in recent years in accounting for the size of Medicare and Social Security obligations, both within government agencies and among academics.1 While a number of federal publications report measures of Social Security and Medicare obligations, they do not report them as debt. The reason why is summarized in the accompanying sidebar on the "Official Rationale." While Social Security and Medicare benefits are considered "obligations" of the federal government, according to the reasoning, they are not considered "liabilities" because the government can unilaterally increase or decrease those benefits. However, the fact that the government can alter its promises to future retirees does not mean that the unfunded obligations should not be reported as liabilities.
In this paper we propose adding Social Security and Medicare entitlement commitments to the federal government's balance sheet as debts on par with the debt held by the public to arrive at what we call the total debt. We argue that this comprehensive debt represents a more accurate measure of the extra tax burden on future generations than the official debt.2
Although the terms deficit and debt are often used interchangeably, they measure different things. As a public accounting convention, the deficit measures yearly increases in government borrowing, while the outstanding debt is accumulated government borrowing. Because government budgeting is so complex, and economic activities are by nature multidimensional, the appropriate measure of the government's deficit or debt at a given point in time depends in some ways on the context in which the measure is being used. [See the sidebar on "The Need for a Comprehensive Measure of Debt."]
[page]Is it possible to construct a meaningful annual measure of government fiscal policy that provides year-by-year accountability in straightforward accounting terms and in a manner consistent with the dynamic nature of fiscal policies? We believe so, and the main goal of this paper is to discuss several competing measures. We will discuss four different approaches along with the advantages and disadvantages of each.3
"The prepetuity open-group includes all current and future workers and beneficiaries, and assumes the system gose on forever."
The Perpetuity Open-Group Obligation. This measure is calculated by subtracting the present value of all future scheduled revenues from the present value of all future expected benefit payments. Future benefits and revenues are projected into the infinite horizon and discounted to the present using the long-run government borrowing rate. The term "open-group" indicates that new participants, in addition to those who are currently paying taxes or receiving benefits, are included in the calculation.
One criticism of this calculation is that it includes benefits to people not yet born, including all future generations. How do we know what these future citizens will think about Social Security or what benefits they will demand during their retirement years? On the other hand, in order to keep its promises to current workers, the government will need revenues from the next generation of unborn taxpayers. It seems unlikely that these future citizens will be willing to pay taxes their entire working lives and then forgo their own benefits. The same may be said of the generation that follows the next generation, the generation that follows that one, and so forth, indefinitely into the future.
The perpetuity open-group calculation is worth paying attention to precisely because once you start a pay-as-you-go system (in which each generation of taxpayers pays the previous generation's benefits), it is difficult to end.
"The 100-year closed-group includes everyone who is now in the system."
The 100-Year Closed-Group Obligation. This measure is equal to the present value of scheduled benefits less scheduled tax payments for people who are currently participating, either as taxpayers or as beneficiaries. As a practical matter, this includes everyone who is 15 years of age or older in the year in which the calculation is made. The term "closed-group" signifies that benefits for people below age 15 and people not yet born are ignored.
The advantage of this approach is that it is limited to people who are currently in the system and to whom an implicit promise has been made. It identifies the magnitude of the obligation new entrants to the system will have to pay to current participants in addition to the taxes that will be collected at the current tax rate. The potential disadvantage of this measure is that new entrants in the system will generate corresponding benefit claims as they pay taxes. For example, this approach assumes that new entrants like today's 14-year-olds pay payroll taxes for their entire work lives, but it ignores their retirement benefits.
The Accrued Obligation. This means the present value of all accrued benefits – that is, the sum of all benefits that have already been earned by each current participant, based on his or her past participation in the program. Since the calculation ignores new participants, the measure implicitly ignores future benefits that will be earned, even by those currently paying taxes. It also excludes any future payroll tax payments made by participants. Since it is primarily retrospective and only counts accrued benefits, with no offsetting future payroll tax revenues, of the four measures discussed here, it is the most similar to a firm's accrued pension liability. The accrued benefits measure has been referred to as the maximum transition cost in that it represents the cost of ending the system tomorrow and making good on the benefits that have been accrued by all current participants.
"Accrued obligations are the benefits people have already earned."
It can also be thought of as the current value of assets that would need to have been set aside in the past to pay for the benefits owed to current participants. This calculation would be the right one to make if we were going to end the system tomorrow. But given that the system is not prepaid, paying off the liability will require taxes from new workers who will expect to receive benefits of their own. Nonetheless this is the best measure of the implicit liability of the Social Security or Medicare system.
The 75-Year Open-Group Obligation. This measure, similar in construction to the perpetuity obligation, is equal to the present value of the difference between scheduled revenues and benefit payments for the next 75 years. The group is open to new participants. This is the calculation government actuaries have historically made and reported in the annual Trustees Reports of the Social Security and Medicare trust funds.
As in the previous two cases, this measure assumes we can have a cutoff point, beyond which we can ignore the benefits of those who have been paying taxes. In this case, the assumption is that we can ignore the benefits of someone who retires 75 years from now even though we are counting all the taxes we expect to collect from that person throughout his or her work life.
"The 75-year open-group is the system over the next 75 years, including current and future participants."
The 75-year open-group calculation has another problem. Although Social Security and Medicare finances will be in deficit much of the next 75 years, they will be even worse in all subsequent years. Thus, as we advance through time, each year's new calculation is worse than that of the previous year. Readers of the Trustees Reports are reminded that the outlook for elderly entitlements worsens each year as the time horizon is lengthened to include one more very bad year.
Relationships among the Four Measures. Together these four measures provide comprehensive methods of measuring the unfunded liabilities of Social Security and Medicare. Note that the last three measures are subsets of the first and the third measure is a subset of the second. The 100-year closed-group calculation is that part of the perpetuity open-group obligation that applies to current participants and the accrued obligation identifies that portion of the 100-year closed-group's benefits that have already been earned. The 75-year open-group unfunded obligation is simply the first 75 years of the perpetuity open-group obligation. The relation among these four measures is described in greater detail in the Appendix.
[page]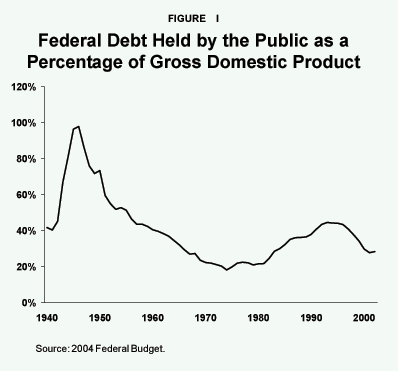
The conventional measure of the federal government's outstanding debt is the debt held by the public. This debt includes government bonds held by the Federal Reserve System as well as privately held bonds. Figure I shows this federal debt as a percent of Gross Domestic Product (GDP) for the years 1940 to 2002. For this period, the debt reached its highest level, 98 percent of GDP in 1946. By 1974 it had fallen to 18.2 percent of GDP. It is often noted that the debt grew substantially during the 1980s, climbing from 21.6 percent of GDP to 36.3 percent between 1980 and 1988. However, these figures do not account for changes in the entitlement debt during this period. The total debt burden, including entitlement debt, actually fell during these years due to structural changes in Social Security. Over the remaining years the government debt held by the public topped out at 44.6 percent of GDP in 1993, and by 2002 it stood at 28.4 percent.
Figure II shows three measures of the Social Security system's unfunded obligations relative to the federal debt held by the public for the years 1973 to 2002.4 The 75-year open-group and 100-year closed-group estimates show the effects of legislative changes in 1977 and 1983. Prior to 1983, the 75-year open-group unfunded obligation exceeded the government debt held by the public; from 1983 to 1993, it was less than the government debt held by the public; but from 1994 to the present it was again in excess of the government debt held by the public. Since 1994 the 75-year open-group unfunded obligation has been in the range of 41 to 46 percent of GDP. The 100-year closed-group is consistently larger than the 75-year open-group calculation. In the years since the 1983 reforms, the 100-year closed-group obligation has ranged from 103 to 125 percent of GDP. The final measure of Social Security's obligations depicted in the graph is the accrued benefits measure. Accrued benefits have been calculated since 1996 and have ranged from 118 to 132 percent of GDP. Recall that accrued benefits are based on accruals from the past participation of current workers and beneficiaries and that future payroll tax payments are not subtracted.
Social Security Unfunded Liabilities. In the 2003 Trustees Report, the present value of the difference between the system's revenues and expenditures over the next 75 years is projected to be $4.9 trillion.5 Including the $1.4 trillion trust fund as an offsetting asset, or dedicated funding source, lowers this unfunded obligation to $3.5 trillion. New this year is an estimate of the infinite horizon unfunded obligation. That number is a whopping $11.9 trillion without the trust fund or $10.5 with the trust fund offset.6
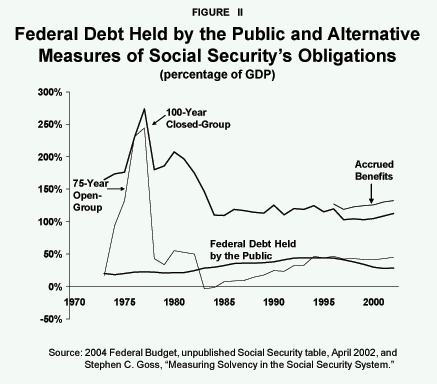
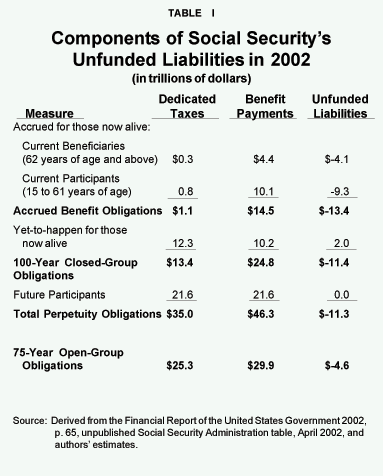
Table I identifies the relationship among the four measures of Social Security's unfunded obligations for the year 2002.7 Tax revenues and benefit payments can be divided among three groups: current beneficiaries, current workers, and future participants. Current beneficiaries are individuals 62 years of age and older in 2002, current workers are individuals 15 to 61 years of age in 2002, and future participants are those who in 2002 were under 15 years of age and all those yet to be born. The first row in the table indicates that current beneficiaries have already earned (accrued) the right to collect $4.1 trillion in benefits over and above the taxes they will pay on those benefits. This amounts to $111,286 per beneficiary.
The next row shows that current participants have also already earned the right to $10.1 trillion. Offsetting this figure is $800 billion in taxes that will be paid as the accrued benefits are received, for a net accrued benefit of $9.3 trillion. Summing over those amounts results in net accrued benefits of $13.4 trillion. This is also referred to as the maximum transition cost measure.8
The fourth line shows that current workers will in the future pay additional taxes of $12.3 trillion and earn additional benefits of $10.2 trillion. The combination of the current beneficiaries and current participants form the 100-year closed group. The difference between their taxes and benefits is -$11.4 trillion (line 5).
"Viewed in perpetuity, Social Security has an unfunded liability of $11.4 trillion."
Line 6 shows the present value of tax revenues from and benefit payments for future participants who are not in the system today. As the table shows, taxes and benefits are both equal to $21.6 trillion.9 Thus future workers could pay their own way at the current tax rate and if the taxes were invested. All of the unfunded liability for the Social Security system is associated with the current participants. We should point out that a pay-as-you-go entitlement system that is solvent will always have a significant debt for its closed group. However, in a solvent system, taxes scheduled to be raised from future participants would have a surplus exactly equal to the debt owed to the current participants. With current tax rates and scheduled benefits, future participants' net contribution to paying off the debt of the current generations is essentially zero, and thus they will not provide the needed surplus of $11.4 trillion. Thus, the long-run unfunded liability (the perpetuity calculation) is almost identical to the unfunded liability for current participants (the 100-year closed-group liability).
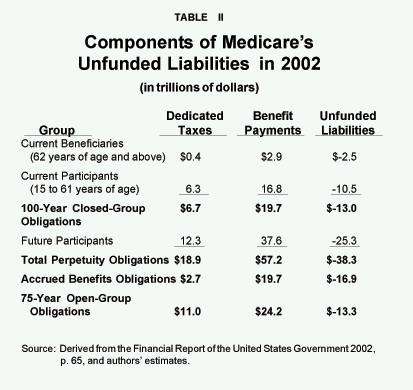
Medicare Unfunded Liabilities. Table II shows similar calculations for Medicare. The 100-year closed-group Medicare unfunded liability is $13 trillion, the accrued debt is $16.9 trillion, and the perpetuity unfunded obligation is $38.3 trillion.10 Because of the expectation of rising medical care spending, future participants are a significant net burden on Medicare.11 Their benefits will exceed their tax payments by more than $25 trillion. Summing over current and future participants, Medicare debt exceeds the accrued Social Security debt by more than three to one.
Accrued Benefits for Seniors. Although Congress is poised to enact a prescription drug benefit for seniors on the theory that they need relief from the financial burdens of out-of-pocket medical expenses, the reality is that seniors are much wealthier than most people realize. The right to draw Social Security benefits for the rest of their lives is analogous to a private pension. It is an "asset" whose value can be calculated. Similarly, the right to participate in Medicare is analogous to ownership of a private health insurance plan. The value of this "asset" can also be calculated. In general we estimate that:
- For the average senior citizen, the right to continue collecting Social Security benefits for the rest of life is worth about $111,286 in today's dollars.
- The right to participate in Medicare for the rest of life is worth $70,701 for each senior, on the average.
- This means that, in addition to all other assets, the average senior's combined Social Security and Medicare benefits are worth about $181,987.
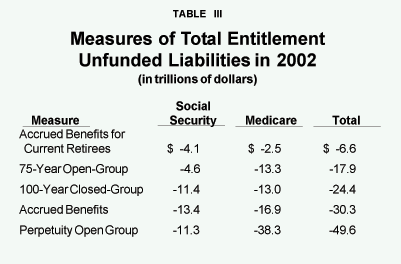
Total Entitlement Liabilities. Table III combines Medicare's and Social Security's unfunded obligation measures. If we include only payments to current beneficiaries, the debt is $4.1 trillion for Social Security and $2.5 trillion for Medicare. The total of $6.6 trillion is still more than double the size of outstanding government bonds. Including liabilities owed to both current workers and current beneficiaries, on the other hand, the entitlement debt measures are significantly larger:
- The combined unfunded liabilities over the next 75 years are $17.9 trillion.
- Using the 100-year closed-group measures produces debts of $11.4 and $13.0 for Social Security and Medicare, respectively, for a total of $24.4 trillion.
- Using the accrued liabilities measure produces a $13.4 trillion debt for Social Security and a $16.9 trillion debt for Medicare, for a total of $30.3 trillion.
- Finally, the combined perpetuity unfunded obligation is $49.6 trillion, with Medicare accounting for more than three-fourths.
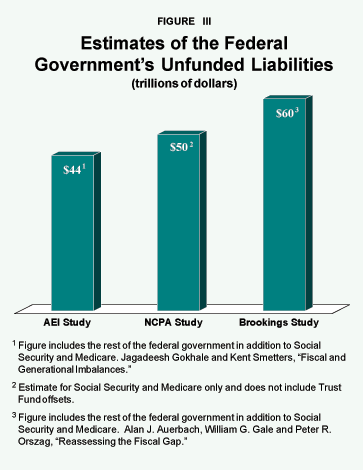
While these estimates may appear startling, other authors have estimated perpetuity shortfalls of similar magnitude. Recently, Gokhale and Smetters12 estimated that Medicare and Social Security combined produced a shortfall of $43.6 trillion dollars in 2002, when all future dedicated revenues and benefit payments are considered. Including the rest of the federal government, they estimate the total federal fiscal imbalance at $44.2 trillion.13 In a similar vein, Auerbach, Gale and Orszag (2003) have calculated a long-term fiscal gap of $59.7 trillion.14 [See Figure III.]
We have discussed four ways to measure the financial status of the Medicare and Social Security programs. The two open-group measures include new participants, those younger than 15, who have not paid any taxes and are not "owed" any benefits, as well as those not yet born. In contrast, both the 100-year closed-group measure and the accrued benefits measure try to identify the net legal commitment to people currently in the system, but they differ in definition. Their difference represents two different philosophies in the accounting profession with regard to measuring liabilities of public pension systems.
"Four measures can be used to evaluate Social Security and Medicare reforms."
Both the 100-year closed-group unfunded liabilities and the accrued benefits meet the criteria that the liabilities are owed to someone who is currently alive today (that is, who is 15 or older).15 Consider these liabilities from the point of view of a beneficiary. To a current worker who stops working and contributing to Social Security or Medicare today, the present value of the retirement benefits the government owes underlies the accrued benefits measure.16 To a current worker who will continue to contribute to Social Security or Medicare until age of 62, the present value of the retirement benefits the government owes, net of the taxes workers are obligated to pay, underlies the 100-year closed-group unfunded liabilities. The difference in the two measures arises in whether we think of Social Security and Medicare as programs that are endable or necessarily ongoing.
The National Council on Government Accounting (NCGA) proposed a measure of pension debt similar to closed-group unfunded obligations, based on the continuation of a public employee's future employment.17 But the Financial Accounting Standards Board (FASB) proposed measuring the rights already earned and ignoring anticipated future accruals.18
[page]In this paper, we argue the case for incorporating entitlement debt into the government's debt and deficit measures. Although benefits and taxes can be changed by legislation, measuring and reporting these entitlement debts serves an important purpose. By adding entitlement debt to the government's financial reporting, we get a clearer picture of government's fiscal position at a given time. A total debt figure is more appropriate than the official debt as a measure of the extra tax burden imposed on future generations by government entitlement programs. We have discussed four different measures of entitlement obligations. We have suggested that the concept of "debt" should be restricted to promises made to people currently alive. The 100-year closed-group measure and the accrued liability measure both fit this notion of debt.
However, while the 100-year closed-group calculation identifies the burden that future participants will have to pay, it does not account for the new benefits the future participants will accrue as they pay taxes. The accrued benefit calculation identifies the system's debt at a point in time, but within the context of a pay-as-you-go program, paying off this liability will require tax revenues and concomitant additional benefit accruals. These two measures most closely fit the definition of a debt mentioned at the outset of this paper. However, some have argued that they do not adequately summarize the financial position of generational transfer programs like Social Security and Medicare.
There is a similar problem with the historical use of the 75-year unfunded obligation by Social Security actuaries. These calculations get significantly worse each year because each successive calculation extends the horizon to include one more year of deficit. This year, the perpetuity unfunded obligation is almost 2.5 times the size of the 75-year unfunded obligation.
"The perpetuity measure is important because these programs are very difficult to end."
The advantage of the perpetuity calculation is that it measures the total size of future unfunded obligations, assuming the system is never changed. The calculation is interesting precisely because it is very difficult to end, or substantially change, a pay-as-you-go system. There are legitimate concerns about making estimates that extend into the indefinite horizon. However, these concerns must be weighed against the problems that arise when a shorter horizon is considered. Shorter time horizons, of whatever magnitude, implicitly assume that we can collect taxes in the final year of the period without generating benefit payments the following year.
Together, the four measures provide comprehensive accounting of the current magnitudes of the Social Security and Medicare burdens on current and future generations. They also provide excellent tools for evaluating the generational impacts of reforms that increase or decrease taxes or benefits.
NOTE: Nothing written here should be construed as necessarily reflecting the views of the National Center for Policy Analysis or as an attempt to aid or hinder the passage of any bill before Congress.
[page]- Though the federal government does not formally report Social Security and Medicare obligations as liabilities, it does report on the programs' solvency in a variety of publications. The dollar values of the unfunded obligations over the next 75 years and over the infinite horizon now appear in the Social Security Trustees Report. For years, the Social Security Administration has calculated the system's 75-year unfunded obligations as well as the net obligations owed to current program participants. Since 1996 it has also calculated the accrued obligations owed to current participants. The unfunded obligation for the Hospitalization Insurance portion of Medicare for the next 75 years was also reported in the most recent Trustees Report. For the last three years, the Treasury Department has examined the two programs' 75-year unfunded obligations in the Financial Report of the United States Government 2000, 2001, 2002, U.S. Department of the Treasury. The Treasury report details the components of expected tax revenues and benefit payments by current and future participants. The Office of Management and Budget provides some similar accounting in Analytical Perspectives, Budget of the United States Government, Fiscal Year 2004, Office of Management and the Budget, 2003. Further, the generational accounting literature, following Auerbach, Gokhale and Kotlikoff (1991), has grown substantially and has emphasized the importance of more complete measures of federal deficits and debts. See Alan J. Auerbach, Jagadeesh Gokhale and Laurence J. Kotlikoff, "Generational Accounts: A Meaningful Alternative to Deficit Accounting," in David Bradford, ed., Tax Policy and the Economy, Vol.5 (Cambridge, Mass.: MIT Press, 1991), pages 55-110.
- As pointed out by Robert Haveman, although prone to labeling games, the official deficit measure is not devoid of information on the relative burdens government is imposing on existing vs. future generations. See Robert Haveman, "Should Generational Accounts Replace Public Budgets and Deficits?" Journal of Economic Perspectives, Vol. 8, No. 1, Winter 1994, pages 95-112. The comprehensive measure of the debt would include privately held government bonds and implicit promises to current participants in Medicare and Social Security.
- Absent from these brief descriptions is the offsetting effect of the Social Security and Medicare trust funds. Given that redemption of the bonds in the trust funds will require future resources, we have excluded them from the discussion. However, the Trustees Reports, and unpublished Social Security tables, include the trust fund offsets in their calculation of the obligations. Additional detail on the calculation of accrued Medicare and Social Security benefits is given in subsequent discussions.
- There is not a historical time series for the perpetuity unfunded obligation, but there are at least several years of estimates for the other three unfunded obligation measures. The 75-year open-group and the 100-year closed-group unfunded obligation series are available beginning in 1973, while the first accrued benefits measure is available in 1996.
- Reported in Table IV.B6 of the 2003 Trustees Report.
- Trust fund offsets make sense only if the trust funds hold assets that can be used to fund benefit payments. Under current practices, every asset of the trust funds is a liability of the treasury. Summing over both parts of government leaves a net value of zero. It is in this sense that the trust funds consist of IOUs the government has written to itself.
- Tables I and II are based on the Financial Report of the United States Government, 2002, the 2003 Annual Report of the Board of Trustees of the Federal Old-Age and Survivors Insurance and Disability Insurance Trust Funds, unpublished estimates by the Social Security Administration's Office of the Actuary, and our estimates of Medicare's perpetuity unfunded obligation.
- The maximum transition cost and the 100-year closed-group estimates are from the unpublished estimates by the Social Security Administration's Office of the Actuary. A description of the maximum transition cost estimate is provided in Stephen C. Gross, "Measuring Solvency in the Social Security System," in Olivia S. Mitchell, Robert J. Meyers and Howard Young, eds., Prospects for Social Security (Philadelphia: University of Pennsylvania Press, 1999).
- These are estimated using the relationships between the perpetuity unfunded obligation and the 100-year closed-group obligations, and the perpetuity actuarial deficit of 3.8 percent, as reported in the 2003 Trustees Report. There, the perpetuity unfunded obligations and the 100-year unfunded obligations were both $10.5 trillion and once the trust fund offset is excluded the number rises to $11.9 trillion.
- The present values of benefits for all participants 15 and older are included in the calculation of accrued benefits for consistency with the age definition. However, this overstates accrued Medicare benefits because it includes those who have not yet worked 40 quarters.
- We assume per capita medical care spending grows at a rate of per capita GDP+1 until 2080 and then falls to per capita GDP growth by 2100, following Jagadeesh Gokhale and Kent Smetters, "Fiscal and Generational Imbalances: New Budget Measures for New Budget Priorities," American Enterprise Institute, Pamphlet, 2003. They estimate that Medicare has a $36.6 trillion perpetuity unfunded liability. Excluding trust fund offsets increases, their number rises to $36.9. This last estimate includes $6.1 trillion in projected new spending based on the Medicare modernization provisions in the 2004 budget. Without the new spending and without the trust fund offsets, their estimate of the unfunded liability is $30.7 trillion. Gokhale and Smetters also use a higher discount rate than used in this study. If we substitute a 6.25 percent long-run nominal interest rate for the 6 percent rate, our estimate of the perpetuity unfunded obligation is $30.8 trillion.
- Jagadeesh Gokhale and Kent Smetters, "Fiscal and Generational Imbalances: New Budget Measures for New Budget Priorities," American Enterprise Institute, Pamphlet, 2003.
- See Footnote 11 for further discussion of the difference between our estimates from Medicare and the estimates by Gokhale and Smetters (2003). Also note that their estimate of the perpetuity unfunded obligation for Social Security net of the trust fund is $8.3 trillion vs. the $11.3 trillion reported in Tables I and III.
- Alan J. Auerbach, William G. Gale and Peter R. Orszag, "Reassessing the Fiscal Gap: Why Tax-Deferred Saving Will Not Solve the Problem," Tax Notes, July 28, 2003, Brookings Institution.
- Note that to current retirees (i.e., those are 62 year or older), the accrued liabilities and 100-year closed-group unfunded liabilities are identical, and are, at least in the political rhetoric, "reform-proof."
- In practice, the Social Security Administration's estimate of the accrued liability measure, which we use here, calculates a disability benefit for all current participants and scales that benefit according to their age, so that younger workers are credited with a lower share of their disability benefit than are older workers. See Stephen C. Goss, "Measuring Solvency in the Social Security System," in Olivia S. Mitchell, Robert J. Meyers and Howard Young, eds., Prospects for Social Security Reform (Philadelphia: University of Pennsylvania Press, 1999). An alternative would be to consider past earnings up to the calculation date for all workers currently alive and calculate benefits based on the benefit formula as it is expected to exist in each worker's retirement year. Due to the graduated primary insurance amount formula which replaces a higher proportion of low-income workers' past wages, this procedure will overestimate the accrued benefits for younger workers because their few years of work produce low estimates of Average Indexed Monthly Earnings. This shortcoming can be overcome by assuming younger workers receive the average replacement rate.
- Herman Leonard, Checks Unbalanced (New York: Basic Books, 1986).
- Ibid.
Alan J. Auerbach and William G. Gale, "Perspectives on the Budget Surplus," National Tax Journal, Vol. 53, September 2000, pages 459-72.
Alan J. Auerbach, William G. Gale and Peter R. Orszag, "Reassessing the Fiscal Gap: Why Tax-Deferred Saving Will Not Solve the Problem," Tax Notes, July 28, 2003, Brookings Institution.
Alan J. Auerbach, Jagadeesh Gokhale and Laurence J. Kotlikoff, "Generational Accounts: A Meaningful Alternative to Deficit Accounting," in David Bradford, ed., Tax Policy and the Economy, Vol. 5 (Cambridge, Mass.: MIT Press, 1991), pages 55-110.
Alan J. Auerbach, Jagadeesh Gokhale and Laurence J. Kotlikoff, "Generational Accounts: A Meaningful Way to Evaluate Fiscal Policy," Journal of Economic Perspectives, Vol. 8, No. 1, Winter 1994, pages 73-94.
Trehan Bharat and Carl E. Walsh, "Testing Intertemporal Budget Constraints: Theory and Applications to U.S. Federal Budget and Current Account Deficits," Journal of Money, Credit, and Banking, Vol. 23, May 1991, pages 206-23.
Mario I. Blejer and Adrienne Cheasty, "The Measurement of Fiscal Deficits: Analytical and Methodological Issues," Journal of Economic Literature, Vol. 29, December 1991, pages 1,664-78.
Willem H. Buiter, "Generational Accounts, Aggregate Saving and Intergenerational Distribution," Economica, Vol. 64, November 1997, pages 605-26.
David Cutler, "Review of Generational Accounting: Knowing Who Pays, and When, for What We Spend," National Tax Journal, Vol. 46, March 1993, pages 61-7.
Peter Diamond, "Generational Accounts and Generational Balance: An Assessment," National Tax Journal, Vol. 49, December 1996, pages 597-607.
Robert Eisner and Paul J. Pieper, "A New View of the Federal Debt and Budget Deficits," American Economic Review, Vol. 74, March 1984, pages 11-29.
Martin Feldstein, "Social Security, Induced Retirement, and Aggregate Capital Formation," Journal of Political Economy, Vol. 82, 1974, pages 905-26.
Martin Feldstein, "Social Security and Private Saving: Reply," Journal of Political Economy, Vol. 90, June 1982, pages 630-42.
Jagadeesh Gokhale and Kent Smetters, "Fiscal and Generational Imbalances: New Budget Measures for New Budget Priorities," American Enterprise Institute, Pamphlet, July 2003.
Stephen C. Goss, "Measuring Solvency in the Social Security System," in Olivia S. Mitchell, Robert J. Meyers and Howard Young, eds., Prospects for Social Security Reform (Philadelphia: University of Pennsylvania Press, 1999).
Craig S. Hakkio and Mark Rush, "Is the Budget Deficit ‘Too Large'?" Economic Inquiry, 1991, pages 429-45.
James D. Hamilton and Marjorie A. Flavin, "On the Limitations of Government Borrowing: A Framework for Empirical Testing," American Economic Review, September 1986, pages 808-16.
Alfred A. Haug, "Cointegration and Government Borrowing Constraints: Evidence for the United States," Journal of Business and Economic Statistics, Vol. 9, January 1991, pages 97-101.
Robert Haveman, "Should Generational Accounts Replace Public Budgets and Deficits?" Journal of Economic Perspectives, Vol. 8, No. 1, Winter 1994, pages 95-112.
Laurence J. Kotlikoff, "Reply to Diamond and Cutler's Reviews of Generational Accounting," National Tax Journal, Vol. 50, June 1997, pages 303-14.
Laurence J. Kotlikoff, "Privatizing Social Security at Home and Abroad," American Economic Review, Vol. 86, May 1996, pages 368-72.
Laurence J. Kotlikoff, "The Deficit Is Not a Well-Defined Measure of Fiscal Policy," Science, Vol. 241, August 1988, pages 791-5.
Dean R. Leimer and Selig D. Lesnoy, "Social Security and Private Saving: New Time-Series Evidence," Journal of Political Economy, Vol. 90, June 1982, pages 606-29.
Herman B. Leonard, Checks Unbalanced (New York: Basic Books, 1986).
Liqun Liu, Andrew J. Rettenmaier and Thomas R. Saving, "Constraints on Big-Bang Solutions: The Case of Intergenerational Transfers," Journal of Institutional and Theoretical Economics, Vol. 156, March 2000, pages 270-91.
Office of Management and Budget, Analytical Perspectives, Budget of the United States Government, Fiscal Year 2004, 2003 (Washington, D.C.: Government Printing Office, 2002, 2003).
Social Security Administration, "Unfunded Obligations and Selected Transition Costs for the Combined Old-Age and Survivors Insurance and Disability Insurance (OASDI) Programs," unpublished table by the Office of the Chief Actuary, April 3, 2002.
David W. Wilcox, "The Sustainability of Government Deficits: Implications of the Present-Value Borrowing Constraint," Journal of Money, Credit, and Banking, Vol. 21, August 1989, pages 291-306.
[page]Dr. Liqun Liu is an Associate Research Scientist at the Private Enterprise Research Center. His primary research areas are taxation analysis and evaluation of government expenditures. His current focus is on the effects of reforming elderly entitlements. Dr. Liu serves as an investigator on several research grants. He has published papers in National Tax Journal, Economic Inquiry, Journal of Institutional and Theoretical Economics, Review of Economic Design, Southern Economic Journal, and Journal of Public Economics.
Dr. Andrew J. Rettenmaier is the Executive Associate Director at the Private Enterprise Research Center at Texas A&M University. His primary research areas are labor economics and public policy economics with an emphasis on Medicare and Social Security. Dr. Rettenmaier and the Center's Director, Thomas R. Saving, have presented their Medicare reform proposal to U.S. Senate Subcommittees and to the National Bipartisan Commission on the Future of Medicare. Their proposal has also been featured in the Wall Street Journal, New England Journal of Medicine, Houston Chronicle and Dallas Morning News. Dr. Rettenmaier is the co-principal investigator on several research grants and also serves as the editor of the Center's two newsletters, PERCspectives on Policy and PERCspectives. He is coauthor of a book on Medicare, The Economics of Medicare Reform (Kalamazoo, Mich.: W. E. Upjohn Institute for Employment Research, 2000) and an editor of Medicare Reform: Issues and Answers (University of Chicago Press, 1999). Dr. Rettenmaier is a senior fellow with the National Center for Policy Analysis.
Dr. Thomas R. Saving is the Director of the Private Enterprise Research Center at Texas A&M University. A University Distinguished Professor of Economics at Texas A&M, he also holds the Jeff Montgomery Professorship in Economics. Dr. Saving is a trustee of the Social Security and Medicare Trust Funds. His research has covered the areas of antitrust and monetary economics, health economics, the theory of the banking firm and the general theory of the firm and markets. He has served as a referee, or as a member of the editorial board, of several major U.S. economics journals and is currently an editor of Economic Inquiry. Dr. Saving has authored many articles and two influential books on monetary theory. He has been president of both the Western Economics Association and the Southern Economics Association. After receiving his Ph.D. in economics in 1960 from the University of Chicago, Dr. Saving served on the faculties of the University of Washington and Michigan State University, moving to Texas A&M in 1968. Dr. Saving served as chairman of the Department of Economics at Texas A&M from 1985-1991. Dr. Saving served as chairman of the Department of Economics at Texas A&M from 1985-1991. Dr. Saving is a senior fellow with the National Center for Policy Analysis.