Who pays the lowest prices for prescription drugs? In the debate over adding a prescription drug benefit to Medicare, a key argument is that large insurers obtain significant price discounts not available to individual patients. However, we have found that patients' price-shopping is just as effective as the leverage exerted by large insurers. Patients who pay for drugs themselves have an incentive to shop for the lowest price, whereas those patients whose drugs are paid for by third parties have less incentive to shop.
To compare the effects of bargaining power to patient shopping, we performed statistical tests using nearly 70,000 records of drug purchases by representative Medicare beneficiaries. We found that of the 39 most commonly prescribed drugs for Medicare patients:
- For almost 60 percent of the drugs, there was no significant difference between the price paid when patients were the primary payer and the price paid when an insurer was the primary payer.
- When there was a significant difference, individual patients paid lower prices twice as often (23.1 percent of the drugs) as private insurers (10.3 percent of the drugs).
Similarly, for an expanded set of 229 drugs, we found:
- For close to three-quarters of the drugs, the unit price paid by people spending their own money was not significantly different from the price paid by people with insurance.
- Among the 62 drugs for which price differences were significant, individuals paid lower prices twice as often as third-party payers.
Finally, we used statistical regression analysis to examine the relationship between the price and the share of price paid out of pocket by patients. We found:
- Of the 39 individual drugs prescribed most frequently, the price per unit fell as the share paid out of pocket increased for 27 of them; thus higher cost sharing was associated with lower unit costs for 70 percent of the drugs.
- For only 15 percent of the drugs was the unit price higher when patients paid a larger out of pocket share.
In general, the relationship between cost sharing and lower costs was greatest for more heavily used drugs and for more expensive drugs. These results are consistent with economic theory. Individuals should search more aggressively for lower-cost alternatives when the amount of money at stake is higher and when there is more frequent use of the drug.
How are individuals able to meet and in some cases beat the discounts large purchasers are able to obtain? They may do so by using shopping techniques that are common in other markets – including comparison shopping among pharmacies both within and outside their local markets and, more recently, on the Internet. Buying in larger quantities can lower the unit cost, although we did not find that higher out of pocket spending was statistically related to this practice. In some cases, consumers can buy higher-dose pills and split them, achieving a lower unit cost. However, we infer that this practice is as likely among patients with insurance as among patients paying out of pocket.
[page]For decades, medical expenditures have grown faster than the gross domestic product. Moreover, spending for prescription drugs is the fastest-rising component of health care spending. Nominal health care expenditures rose from $861 billion in 1994 to $1,236.4 billion in 2001, an increase of more than 43 percent. Over the same period, spending on prescription drugs rose from $54.6 to $140.6 billion, a jump of more than 157 percent. Prescription drugs make up more than one of every ten dollars of health care spending by individuals; the elderly spend about one in every six of those dollars.
"Some argue that insurers pay lower for prices for drugs than patients spending their own money."
There is some evidence that health insurance generally has shifted away from cost sharing toward managed care in recent years,1 and cost sharing is falling for prescription drugs. In 2001, about 31 percent of prescription drug spending was out of pocket, down from 48 percent in 1994.2 Medicare beneficiaries with insurance coverage pay out of pocket for about one-third of their total spending on prescription drugs. Year 2000 figures from the Department of Health and Human Services (HHS) show that the average out-of-pocket share of spending varies from 58 percent for those with Medigap coverage to 20 percent for those with Medicaid. The continuous increase in prescription drug expenditures has stimulated an intense debate on whether the federal government should act more aggressively to provide direct help for the elderly by, for example, adding prescription drug benefits to Medicare, a program that already faces serious long-term solvency problems.
A key argument some have used to justify changes in Medicare is that large insurers obtain significant price discounts not available to individual patients.3 The HHS Office of the Assistant Secretary for Planning and Evaluation made this argument in evaluating a previous House of Representatives prescription drug bill:
A substantial share of beneficiary savings from H.R. 2473 arises from drug discounts, made possible by letting Medicare beneficiaries aggregate their purchasing power for the first time. It's common sense: the first step toward lower prescription drug costs for seniors is to give them the same means to get lower drug prices that are widely used for those under 65.4
In our analysis, however, we did not find significant or systematic differences between retail drug prices for patients who pay primarily out of pocket and those who rely heavily on third-party payers. We did find that, in general, as the out-of-pocket share of a prescription's cost increases, the unit price declines. The explanation we offer is that while third-party payers may have greater market leverage than individual consumers, cost sharing induces patients to price-shop aggressively. Which group pays more for drugs depends on the net effect of these two competing factors.5
[page]"Patients spending their own money have a incentive to shop for low drug prices, while insurers may be able to negotiate lower prices."
In relating out-of-pocket share to the unit price of a drug, two offsetting forces are at work. The larger the patient's share of a prescription's total cost, the greater is his incentive to search for lower prices. Considering this effect alone, the larger the proportion of the expenditure the patient pays, the lower the expected price. Alternatively, the larger the proportion of the expenditure a third party pays, the greater is its incentive to use its institutional buying power to negotiate lower drug prices. Considering this effect alone, the larger the proportion of the expenditure paid by patients, the higher the expected price.6
If institutional buying power is the more dominant force in the market for drugs, we should find that the price paid rises with the proportion paid out of pocket. If patient incentives are the more important force, lower prices should be associated with higher percentages paid out of pocket. However, since the two forces work in opposite directions, it is possible that the net effect will be insignificant. The various statistical tests we performed show the empirical effects of these two forces.
[page]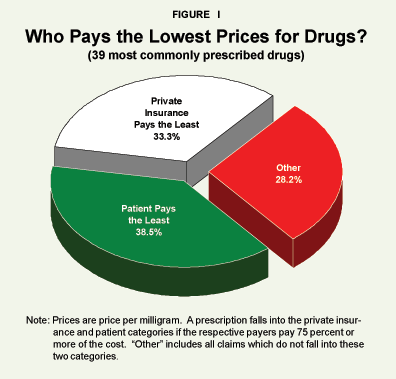
Using data from the prescribed medicine event file of the Medicare Current Beneficiary Survey (MCBS) 1998 Cost and Use File, we examined nearly 70,000 drug purchases by seniors. The data included information on the total price paid and the share of the cost paid by the patient or a third party – private insurers or such government health programs as veterans' health. We performed statistical tests to determine the prices paid when patients or insurers pay most of the cost and whether patients or insurers were able to obtain the lowest price. What follows is a discussion of the results. The details of the testing procedures are described in Appendix B. Because the data is based on survey responses, any rebates an insurer received from a pharmacy or pharmaceutical company that are not included in the price of the prescriptions at the time of purchase are not included in the analysis.
"We analyzed nearly 70,000 drug purchase by seniors on medicare, some of which were paid for by insurers and some by seniors out of pocket."
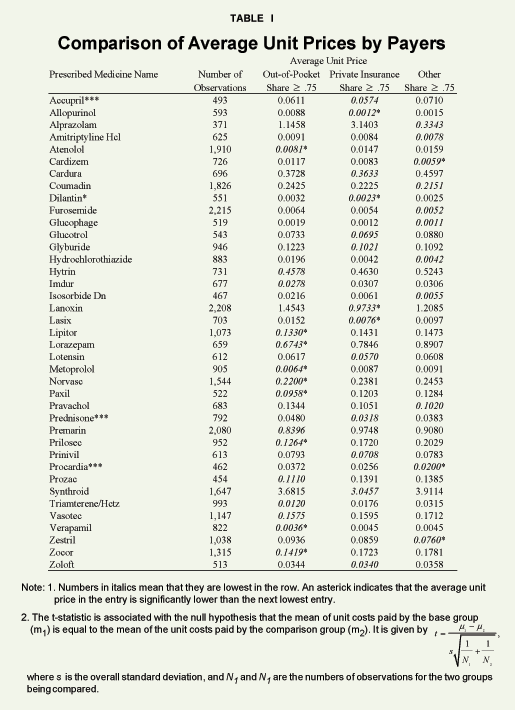
The 39 Most Commonly Prescribed Drugs.7 In the first test, we examined the 39 most commonly prescribed drugs for Medicare patients to determine in each case whether the patient or insurer obtained the lowest cost. In categorizing buyers, we used the following method.8 If 75 percent or more of a prescription was paid out of pocket, we designated the purchase as an out-of-pocket payment by patients. If a private insurer (HMO, employer-sponsored insurance, individually purchased insurance or some combination thereof) paid 75 percent or more of a prescription's cost, we designated it as an insurance purchase. We put all other combinations of third-party payments and out-of-pocket payments in the "other" category. In Figure I, the drugs are grouped according to which buyer paid the lowest price. With the above definitions in mind, note that:9
- Private insurance paid the lowest price for 33.3 percent of drugs.
- Patients paid the lowest price for 38.5 percent of the drugs.
- Other payer combinations paid the lowest price for 28.2 percent of the drugs.
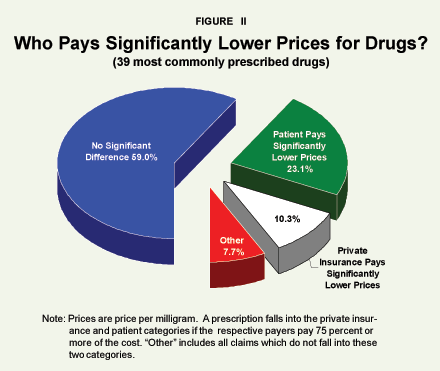
Figure II takes the same set of 39 drugs and identifies whether the average price paid by the lowest-price payer was significantly lower than the next-lowest average price paid. As the figure shows:
- For almost 60 percent of the drugs, the price paid by the lowest cost payer was not significantly less than the next lowest cost payer.
- Patients and private insurers paid the lowest price for 23.1 percent and 10.3 percent of the drugs, respectively.
- Other combinations paid the lowest price for the remaining 7.7 percent of the drugs.
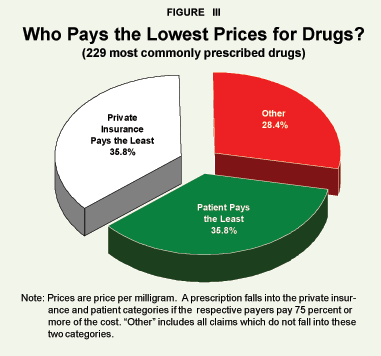
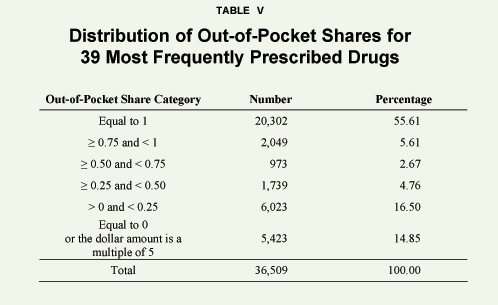
The 229 Most Commonly Prescribed Drugs. In the second test, we repeated the process for an expanded set of 229 drugs. To eliminate small sample effects, calculations were limited to drugs for which there were at least 100 prescriptions in the sample, before other restrictions. This left a total of 229 drugs, for which the 75 percent thresholds were valid, and a total of 69,576 prescriptions. The 39 most commonly prescribed drugs, summarized in the first two figures, accounted for 36,509 prescriptions, or 52.5, percent of the prescriptions in the larger sample. Figure III shows that:
- Patients paying out of pocket paid the lowest price as often as private insurers did – 35.8 percent of the time.
- Other combinations paid the lowest average price 28.4 percent of the time.
This indicates that for 147 drugs the average unit price paid by those with private insurance or other coverage that does not meet the 75 percent threshold is lower than the price paid by those who primarily pay out of pocket. This may suggest that the dominant discount effect is the power of large purchasers. However, that patients paying out of pocket pay the lowest price as often as private insurers is evidence of the price incentive effect.
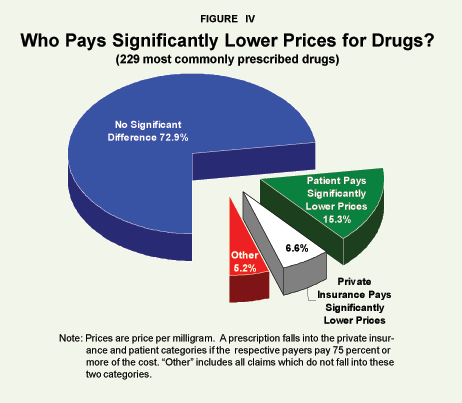
Most of the differences are not significant and may be due to purely random factors. Consistent with Figure II, Figure IV shows that:
- For close to three-quarters of the drugs, the unit price paid by the lowest cost group was not significantly less than the price paid by the next lowest cost group.
- Among the 62 drugs for which price differences were significant, individuals paid lower prices twice as often as did third parties.
"For three-fourths of the 229 drugs, there was no significant price difference, regardless of who paid."
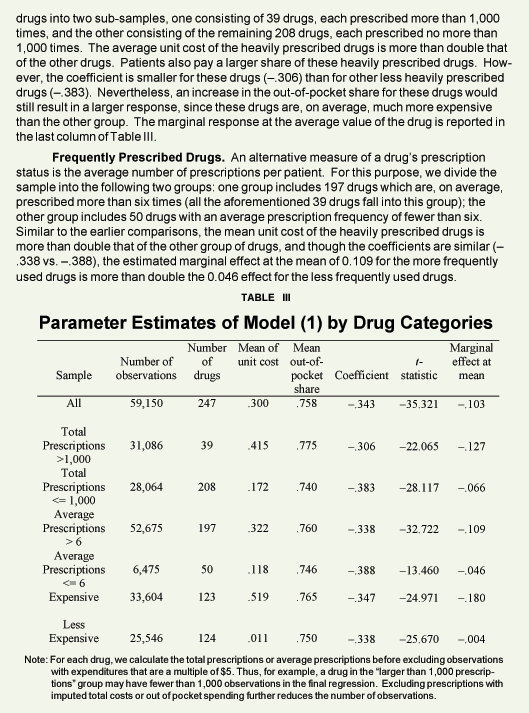
Regression Analysis. We performed additional statistical tests to determine the relationship between the share of a prescription's total cost that is paid out of pocket and the unit costs of the drugs. We first separated 247 diverse drugs into two groups: the 39 drugs that were each prescribed more than 1,000 times (see Appendix B, Tables III and IV) and the remaining 208 drugs that were prescribed no more than 1,000 times.10 We found that:
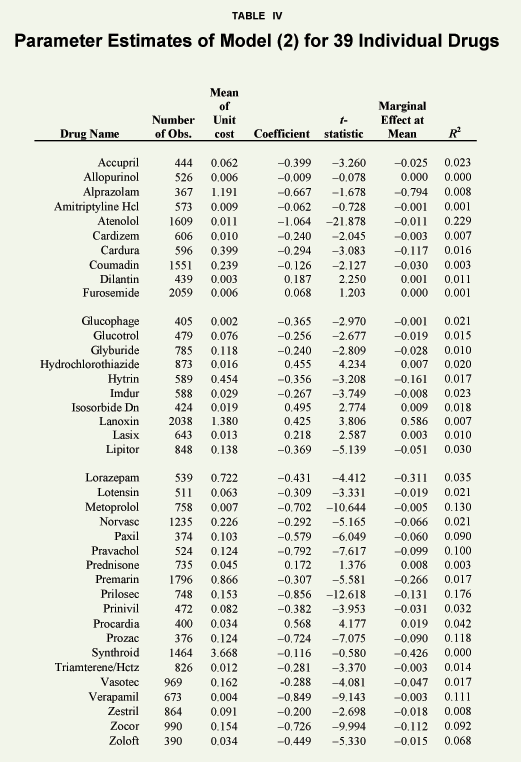
- Across all of the 39 individual drugs prescribed more than 1,000 times, the relationship between the percentage of a prescription a patient paid and the unit price is negative and significant, meaning that the unit price fell as the patient's share of the cost rose.
- Looking at the relationship for each individual drug, we found that the relationship was negative and significant for 27 of the 39 drugs, positive and significant for six drugs and insignificant for six.
In general, then, higher cost sharing is associated with lower unit cost. We found no pattern with respect to the type of drug, either in terms of treatment use or whether it was generic or brand name.
"Additional statistical tests showed patient spending their own money were more likely to pay less for costlier drugs and repeatedly used drugs."
Patients with Repeated Drug Usage. To see if seniors have a greater incentive to shop for lower prices when they use a particular drug repeatedly, we divided the sample into the 197 drugs that are, on average, prescribed more than six times per patient (all the aforementioned 39 drugs fall into this group) and a second group including the 50 drugs with an average prescription frequency of fewer than six. Drug shopping affects the price paid for both groups of drugs, but it seems to have a greater price effect for drugs used repeatedly.
Expensive Drugs versus Inexpensive Drugs. The relative importance of the discount effect of concentrated purchasing power and the price-shopping effect may differ according to the price of the drug. Thus we divided the sample into "expensive" and "inexpensive" drugs to examine whether the impact of cost-sharing ratios on the price paid differed for these two groups. [See Appendix B, Table III.]
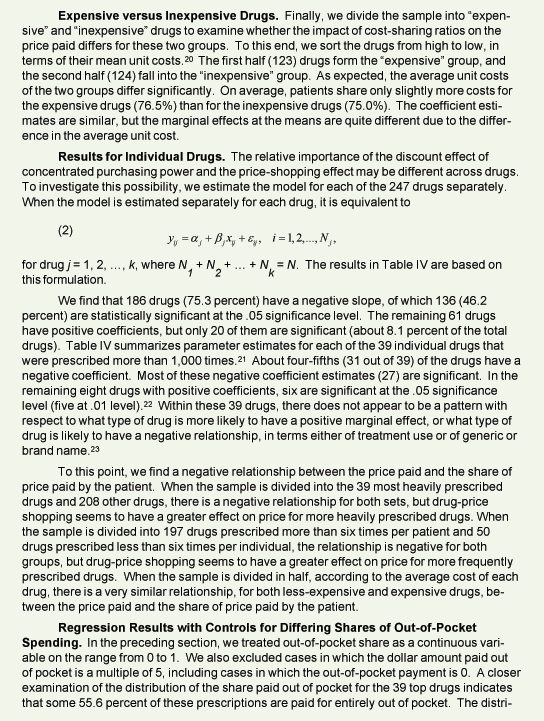
We sorted the drugs from high to low in terms of their mean unit costs. The first half (123) drugs form the "expensive" group, and the second half (124) fall into the "inexpensive" group. As expected, the average unit costs of the two groups differ significantly – the average cost of some drugs exceeds one dollar per milligram, while some others cost less than one-tenth of a cent.
On average, patients share only slightly more costs for the expensive drugs (76.5 percent) than for the inexpensive drugs (75.0 percent). The percentage change in unit cost that results from a change in out of pocket spending is similar for the two categories of drugs. However given that average unit costs are much higher for the expensive drugs, the savings associated with increasing the share of out of pocket costs are greater for them. This is consistent with the shopping hypothesis, since patients have an incentive to shop more – that is, they should be willing to incur higher search costs – because of the greater potential cost saving for more expensive drugs.11
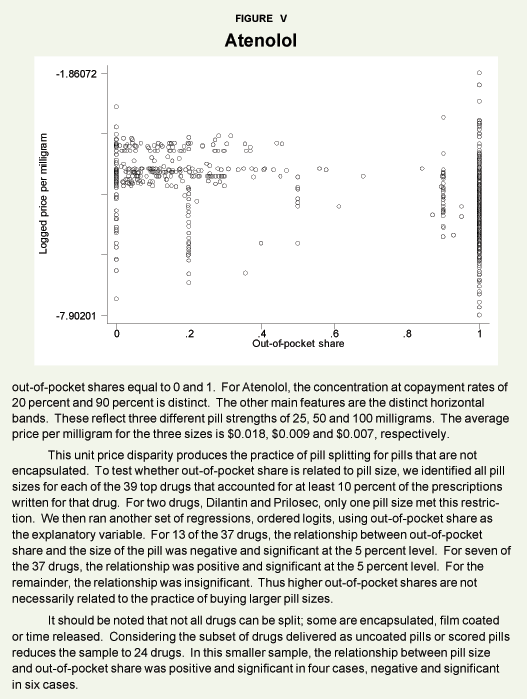
Pill Splitting and Bulk Buying. In addition to searching for lower unit prices, patients can divide some pills into two doses for a lower unit cost because prices tend not to be proportional to pill size. For example, Atenolol comes in 25, 50 and 100 milligrams, and the average prices per milligram are $0.018, $0.009, and $0.007, respectively. If patients are splitting pills as a cost-reduction strategy, the average size of the pill purchased should rise with the share of the cost paid out of pocket. To test whether out-of-pocket share is related to the size of the pill purchased – and hence the price per unit – we identified all pill sizes for each of the 39 top drugs that accounted for at least 10 percent or more of the prescriptions written for that drug. Since pill splitting is not practical for encapsulated drugs, we examined prices for various sizes of the 24 drugs which are available as uncoated or scored pills. We found that:

- In four cases, the relationship between out-of-pocket share and the size of the pills patients purchased was positive and significant, consistent with the pill-splitting hypothesis.
- However, for six drugs, the relationship between out-of-pocket share and the size of the pill was negative and significant, meaning that patients tended to buy smaller doses of the pills as their out-of-pocket share rose.
- For the remainder, there was no significant difference.
Thus higher out-of-pocket shares are not necessarily related to the practice of buying larger pill sizes.12
"Shopping for drugs can reduce the costs because prices vary widely."
Reasons for the Results. For several reasons, price shopping can significantly reduce costs. First, retail drug prices vary greatly among geographically distinct markets and across retail pharmacies within the same market. For example, one study documented substantial price differences for cash customers among 20 pharmacies in two cities of upstate New York; average prices at high-price pharmacies (those at the 90th percentile) were more than five times as high as those at the lowest-cost pharmacies (those at the 10th percentile).13
Buying prescription drugs in the national marketplace via the Internet or mail order is another way beneficiaries can obtain lower prices.14 However, this practice was not as widespread in 1998 as it is today. Pill splitting and quantity buying are additional ways to lower the unit cost of a drug; however, these methods do not appear to be the primary means by which unit costs are lowered. Frequent prescription drug users have more motivation to employ these techniques because of their high drug bills. In 1998, one-third of Medicare beneficiaries accounted for three-fourths of prescription drug spending.
[page]The assertion that individuals without drug coverage pay a higher price at the retail pharmacy than the total price paid by those with drug coverage is not supported by the evidence. The explanation we offer is that a patient's price-shopping efforts may have price-reducing effects similar to those of insurance companies with concentrated purchasing power. We find that for most of the drugs considered, the relationship between cost sharing and final price paid is negative.
"Patients shop for drugs more aggressively when they have an economic incentive to do so."
Further, the negative relationship is more significant for more heavily prescribed and more expensive drugs. This is consistent with the predictions of a standard search model: prices for repeatedly purchased prescriptions exhibit significant reductions in spatial dispersion due to competition.15 Also, the impact of cost sharing between more and less expensive drugs appears to be insignificant when percentage differences are considered, but is significant when the total effect is considered.
Finally, the data used here is limited to Medicare beneficiaries (the elderly and the disabled). It is not clear whether studies of non-Medicare populations – among whom prescription drug use is less pronounced – would yield similar results. Given that seniors generally use more drugs and face lower opportunity costs for searching, they are more likely to benefit from searching for the lowest price.
NOTE: Nothing written here should be construed as necessarily reflecting the views of the National Center for Policy Analysis or as an attempt to aid or hinder the passage of any bill before Congress.
[page]Jessie X. Fan, Deanna L. Sharpe and Goog-Soog Hong, “Health Care and Prescription Drug Spending by Seniors,” Monthly Labor Review, Vol. 126, No. 3, pages 16-26, March 2003.
Teresa B.Gibson et al., “Cost-Sharing for Prescription Drugs,” Journal of the American Medical Association, Vol. 285, pages 2328-29, 2001.
Sherry A. Glied and Dahlia K. Remler, “What Every Public Finance Economist Needs to Know about Health Economics: Recent Advances and Unresolved Questions,” National Tax Journal, Vol. 55, pages 771-88, 2002.
R.E. Johnson et al., “The Impact of Increasing Patient Prescription Drug Cost Sharing on Therapeutic Classes of Drugs Received and on the Health Status of Elderly HMO Members,” Health Services Research, Vol. 32, No. 1, pages 103-22, April 1997.
A. Leibowitz, Willard G. Manning Jr. and Joseph P.Newhouse, “The Demand For Prescription Drugs as a Function of Cost-Sharing,” Rand Note, N-2278-HHS, October 1985.
Bernie O’Brien, “The Effect of Patient Charges on the Utilization of Prescription Medicines,” Journal of Health Economics, Vol. 8, No. 1, pages 109-32, March 1989.
John A. Poisal, “Misreporting of Drug Expenditures in the Medicare Current Beneficiary Survey,” Working Paper, Office of Research, Development, and Information, Centers for Medicare and Medicaid Services, 2003.
John A. Poisal, Lauren A. Murray, George S. Chulis and Barbara S. Cooper, “Prescription Drug Coverage and Spending for Medicare Beneficiaries,” Health Care Financing Review, Vol. 20, No. 3, pages 15-27, Spring 1999.
Alan T. Sorensen, “Equilibrium Price Dispersion in Retail Markets for Prescription Drugs,” Journal of Political Economy, Vol. 108, No. 4, pages 833-50, 2000.
A. Street, A. Jones and A. Furuta, “Cost-sharing and Pharmaceutical Utilization and Expenditure in Russia,” Journal of Health Economics, Vol. 18, No. 4, pages 459-72, 1999.
U.S. Department of Health and Human Services, Report to the President: Prescription Drug Coverage, Spending, Utilization, and Prices, April 2000.
U.S. Department of Health and Human Services, The Effects of H.R. 2473 on Prescription Drug Costs for Medicare Beneficiaries, June 24, 2003. H. White, “A Heteroskedasticity-Consistent Covariance Matrix Estimator and a Direct Test for Heteroskedasticity,” Econometrica, Vol. 48, pages 817-38, 1980.
[page]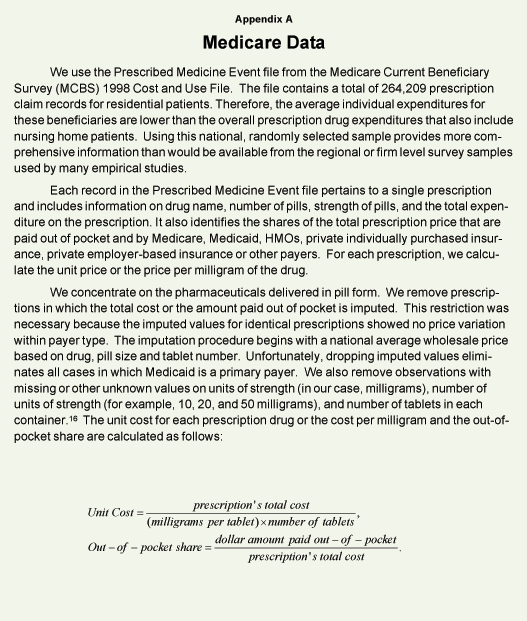
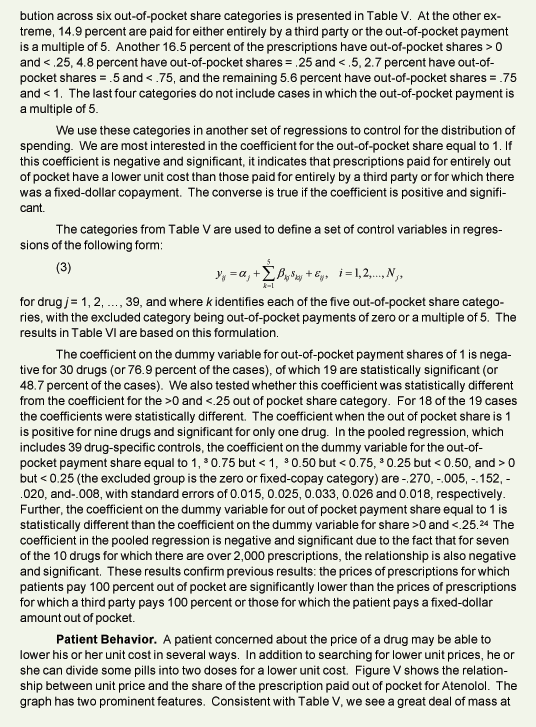
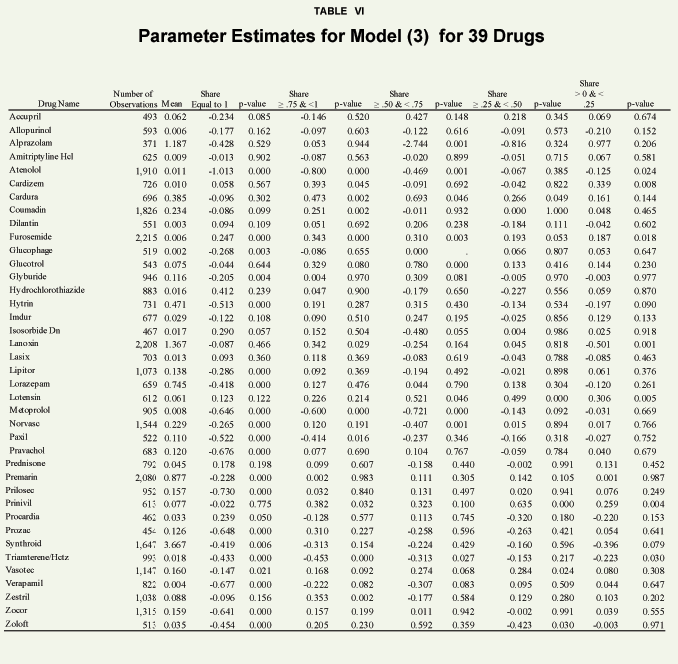
-
See Sherry A. Glied and Dahlia K. Remler, "What Every Public Finance Economist Needs to Know about Health Economics: Recent Advances and Unresolved Questions," National Tax Journal, Vol. 55, 2002, pages 771-88.
- See "National Health Expenditures Tables," Centers for Medicare and Medicaid Services, Table 9, http://www.cms.hhs.gov/statistics/nhe/historical
- U.S. Department of Health and Human Services, Report to the President: Prescription Drug Coverage, Spending, Utilization, and Prices, April 2000.
- From The Effects of H.R. 2473 on Prescription Drug Costs of Medicare Beneficiaries by the Office of the Assistant Secretary for Planning and Evaluation, Department of Health and Human Services, June 24, 2003; http://aspe.hhs.gov/search/health/HR2473.htm. The prescription drug provisions of the bill passed by the House, H.R. 1, are similar to those in H.R. 2473.
- The impact of increasing patient prescription drug cost sharing on drug expenditures, and also the quantity side of the demand, have received much attention in literature. See for example, A, Leibowitz, Willard G. Manning Jr. and Joseph P. Newhouse, "The Demand For Prescription Drugs as a Function of Cost-Sharing," Rand Note, N-2278-HHS, October 1985; R.E. Johnson et al., "The Impact of Increasing Patient Prescription Drug Cost Sharing on Therapeutic Classes of Drugs Received and on the Health Status of Elderly HMO Members," Health Services Research, Vol. 32, No. 1, pages 103-22, April 1997; A. Street, A. Jones and A. Furuta, "Cost-sharing and Pharmaceutical Utilization and Expenditure in Russia," Journal of Health Economics, Vol. 18, No. 4, pages 459-72, 1999; Teresa B. Gibson et al., "Cost-Sharing for Prescription Drugs," Journal of the American Medical Association, Vol. 285, pages 2328-29, 2001; and Jessie X Fan, Deanna L. Sharpe and Goog-Soog Hong, "Health Care and Prescription Drug Spending by Seniors," Monthly Labor Review, Vol. 126, No. 3, pages 16-26, March 2003. The issues under consideration include: adverse selection in the health insurance market; differences in utilization and spending between patients with and without drug coverage across different income levels, ages, health status, and other categories; the influences of drug coverage on the type of medications used, etc. In contrast, less attention has been paid to the impact of drug insurance and cost sharing on the market price variation faced by patients. It is our hope that this short note will provide some preliminary evidence on this issue.
- To further distinguish between the two competing theories about the effects of third-party payment and out-of-pocket spending in the market for prescription drugs, we estimated several alternative regressions that are presented in Appendix B. Note: As the share they pay rises, patients tend to continue searching up to the point at which the cost of searching equals the price reduction they expect. But since the patient's search costs are not reflected in the price he or she pays for the drug, these costs are largely hidden and are not included in this analysis. Similarly, third-party payers also are expected to search for and negotiate low prices for their claimants, and those costs also not known.
- The initial set of sample restrictions requires valid values for pill strength in milligrams and number of tablets. Figures I and II are based on the 39 drugs for which there are at least 1,000 prescriptions after these restrictions. A second restriction is that both the total cost of the prescription and the amount paid out of pocket are not imputed.
- Since Medicaid total payments are imputed, they are not included in the analysis. See Appendix A for additional information and for the definition of unit price, which is implemented as the price per milligram.
- Table I provides additional details behind Figures I and II.
- The number of prescriptions (observations) per drug ranged from 28 to 2,059. The average unit cost of the heavily prescribed drugs was more than double that of the other drugs, and patients pay a larger share of the cost.
- An alternative specification of out-of-pocket share is also used in Appendix B. That specification divides out-of-pocket share into six categories, ranging from prescriptions paid entirely by the patient to those paid entirely by a third party. The alternative specification yields similar qualitative results.
- Insurers also have the incentive to lower spending of their beneficiaries. The negative relationship between out of pocket spending and pill size in six cases may be consistent with insurers encouraging pill splitting. We also tested for the relationship between out of pocket spending and quantity buying. Higher out of pocket spending was negatively and significantly related to the purchase of 30 or more tablets for 34 of the 39 drugs considered. This indicates that bulk buying is not used as a means to lower unit costs among those with higher out-of-pocket spending.
- Alan T. Sorensen, "Equilibrium Price Dispersion in Retail Markets for Prescription Drugs," Journal of Political Economy, Vol. 108, No. 4, 2000, pages 833-50.
- See, for example, Devon M. Herrick, "Shopping for Drugs," Policy Report No. 262, June 2003, National Center for Policy Analysis. Available at http://www.ncpathinktank.org/pub/st/st262/.
- Our results also provide an indirect support for Sorensen's 2000 findings (Alan T. Sorensen, "Equilibrium Price Dispersion in Retail Markets for Prescription Drugs").
- For a detailed description of this data file, see the Center of Medicare and Medicaid Services' Codebook for 1998 Cost and Use, accessible at http:/cms.hhs.gov/mcbs/codebkCNU/CNU1998/cnu98PME.asp. The procedure used to impute missing total costs does not provide regional variation. Imputed total costs begin with national average wholesale prices based on drug, strength and number of tablets. The wholesale prices are then discounted and assigned fixed dispensing fees based the presence of a third-party payer. Each type of third-party payer, for example, Medicaid, employer-based insurance or HMO, has different discounts and dispensing fees. Because the discounts and dispensing fees are identical within a third-party payer group and are applied to the national average wholesale price, prices for identical prescriptions do not vary. Given that the focus of the present study is the relationship between out-of-pocket spending and unit price, imputed values based on these procedures are not appropriate. For these reasons prescriptions for which total cost or out of pocket spending is imputed have been omitted from our analysis. It should also be noted that there has been some concern that household survey responses may underreport both drug utilization and cost. See John A. Poisal, Lauren A. Murray, George S. Chulis and Barbara S. Cooper, "Prescription Drug Coverage and Spending for Medicare Beneficiaries," Health Care Financing Review, Vol. 20, No. 3, pages 15-27, Spring 1999, and John A. Poisal, "Misreporting of Drug Expenditures in the Medicare Current Beneficiary Survey," Working Paper, Office of Research, Development, and Information, Centers for Medicare and Medicaid Services, 2003, for a discussion of misreporting of drug spending in the Medicare Current Beneficiary Survey.
- This data truncation also eliminates observations with zero out-of-pocket payments, which is appropriate when considering only the effect of proportional cost-sharing arrangements. Fixed-dollar denominated copayments result in patients having no incentive to search because the marginal benefits of searching are zero. We return to this issue later in the paper.
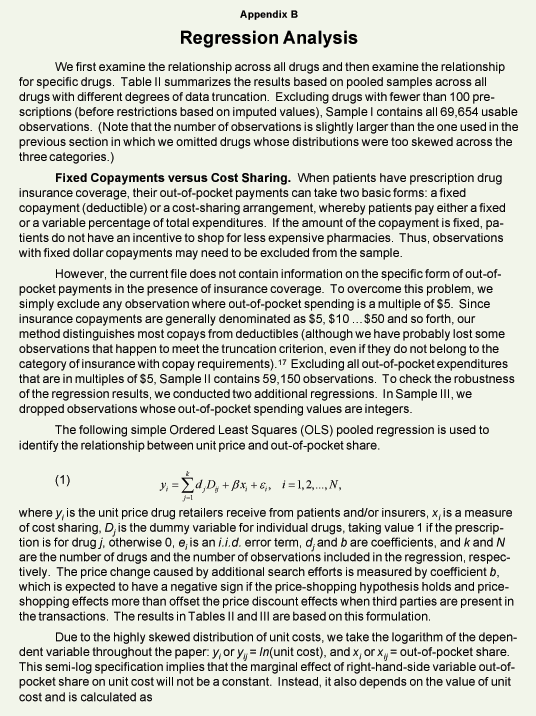
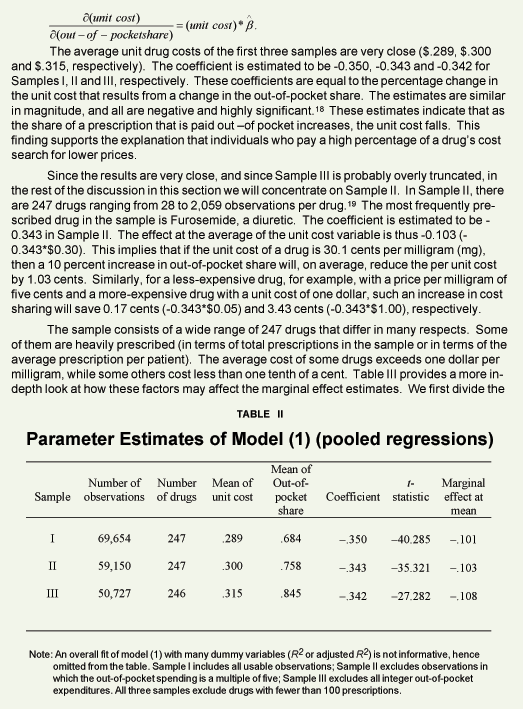
- Since the unit costs of different drugs are in different orders of magnitude, the pooled regression of all 247 drugs is likely to result in a heteroskedasticity problem. Therefore, all reported t-statistics are Huber-White consistent estimates. See H. White, "A Heteroskedasticity-Consistent Covariance Matrix Estimator and a Direct Test for Heteroskedasticity," Econometrica, Vol. 48, pages 817-38, 1980. Given that the natural log of the unit price serves as the dependent variable, the coefficients reported in the table reflect the percentage change in price resulting from a change in the share paid out of pocket. To determine the change in unit price resulting from a change in the out-of-pocket share, the coefficient must be multiplied by the unit price, as discussed earlier. The values reported in the last columns of Tables II and III are the marginal effects evaluated at the means. An alternative specification of the dependent variable based on average daily dose results in the same parameter estimates in the pooled regression, given the controls for each drug. The within-drug regressions will not be affected by our use of cost per milligram as the dependent variable rather than average daily dose.
- As stated earlier, we exclude drugs with fewer than 100 observations in Sample II. However, upon further elimination of observations involving fixed-dollar copayments, or imputed costs, the final number of observations used in regressions is smaller for each drug.
- An alternative specification would divide the prescriptions based on the costs of an average daily dose.
- Recall from Table III that the coefficient of the pooled regression of these 39 drugs (with a total of 31,086 observations) is negative and significant.
- The most heavily prescribed drug, Furosemide, has a positive slope estimate, but it is small in magnitude (.068) and statistically insignificant (t-value is 1.203).
- In all regressions, R2, the measure of the ability of out-of-pocket share to explain the variation in the unit cost in model (2), is low. This is due in part to the fact that the process by which prescription drug prices are determined is very complicated, especially when third parties are involved. When we include in the regression two types of regional dummies, metropolitan and census regions, and demographical characters, age, age squared, income, and a control for whether the patient has difficulty in daily activities, the R2 in each drug regression increases significantly. However, the basic results reported in the text remain largely the same. The coefficient estimates are negative for 30 drugs, of which 29 are significant. They are positive in the remaining nine drugs, of which five are significant. The pooled regression also has a significant negative estimate of the variable of out-of-pocket share (although conceivably smaller in magnitude). Furthermore, there are 3,691 observations with missing values of at least one of the above dummy and demographic variables (a reduction of 11.9 percent from 31,086). To preserve degrees of freedom, we chose to concentrate on the simple specification.
- An alternative set of regressions was estimated in which the fixed-dollar copayments are identified as any integer numbers. With this specification of the explanatory variables, 29 of the 39 regressions produced a negative coefficient (of which 24 are significant), while only six were positive and significant.
Andrew J. Rettenmaier is the Executive Associate Director at the Private Enterprise Research Center at Texas A&M University. His primary research areas are labor economics and public policy economics with an emphasis on Medicare and Social Security. Dr. Rettenmaier and the Center’s Director, Thomas R. Saving, have presented their Medicare reform proposal to U.S. Senate Subcommittees and to the National Bipartisan Commission on the Future of Medicare. Their proposal has also been featured in the Wall Street Journal, New England Journal of Medicine, Houston Chronicle and Dallas Morning News. Dr. Rettenmaier is the co-principal investigator on several research grants and also serves as the editor of the Center’s two newsletters, PERCspectives on Policy and PERCspectives. He is coauthor of a book on Medicare, The Economics of Medicare Reform (Kalamazoo, Mich.: W. E. Upjohn Institute for Employment Research, 2000) and an editor of Medicare Reform: Issues and Answers (University of Chicago Press, 1999). Dr. Rettenmaier is a senior fellow with the National Center for Policy Analysis.
Zijun Wang is an Assistant Research Scientist at the Private Enterprise Research Center. He received his Bachelor and Master degree in Economics from Renmin (People’s) University of China. After receiving his Ph.D. in Agricultural Economics from Texas A&M University, he joined the Center in August 2000. His primary research interests are econometric forecasting, empirical consumption analysis and health economics. He has published several papers on Chinese economy, and has several papers published in the Journal of Forecasting, Applied Economic Letters, and Agricultural Finance Review. Dr. Wang has worked extensively on the Center’s Medicare and Social Security research and on our Initiative for the Study of American Banking & Credit.