This study examines the effects of fundamental tax reform as well as combining tax reform with fundamental Social Security reform.
Tax reform consists of replacing personal and corporate federal income taxation with: (1) an 11 percent flat-rate income tax, or (2) a 14 percent flat-rate tax on personal consumption, or (3) a 14 percent value-added tax (VAT), or (4) a 16 percent federal retail sales tax with the same effective tax rate as the tax on personal consumption and the VAT. The first reform taxes all income at one low rate. The next three reforms tax all consumption at one low rate.
Under each tax reform, the new tax is rebated to the lowest one-third of income earners. While we don’t model the form of these rebates, they could be provided as vouchers for the purchase of health insurance, contributions to personal retirement accounts, or contributions to Individual Development Accounts (IDAs). We also remove the cap on the Social Security payroll tax, but keep the benefit structure in place so that the tax rate on all wage income is the same.
A complaint about previous tax reform proposals is that they undermine the somewhat progressive features of the current fiscal system. The reforms considered here enhance progressivity. The bottom one-third of the income distribution of each age group gains the most under each reform proposal.
All four tax reforms entail very low tax rates for three reasons: (1) the additional payroll tax revenue from eliminating the payroll tax ceiling is used as general revenue, (2) the income and consumption tax bases are comprehensive, and (3) the reforms do not exempt large fractions of the population from taxation, as occurs, for example, under former Congressman Dick Armey’s flat tax proposal. Under the Armey flat tax, half the population would escape the tax and the other half would have a significant amount of untaxed income.
An Eleven Percent Flat-Rate Income Tax. Under this proposal all income is taxed only once, at its source, when it is realized, at one low rate. Everyone would pay the tax, regardless of income, and there would be no deductions, exclusions or exemptions. This would mean no more deductions for home mortgage interest, charitable contributions, and state and local taxes. It would also mean that employee benefits, including health insurance and pension contributions, would no longer be excluded from taxable income. Moreover, there would no longer be tax-free municipal bonds. Nor would individuals would be able to make tax-free deposits and realize tax-free growth in their IRA and 401(k) accounts. In return, people would get to keep 89 cents of each additional dollar of income they earn.
A Fourteen Percent Flat-Rate Tax on Personal Consumption. The theory behind a consumption tax is that people should be taxed based on what they take out of the economy, not on what they put in. The reason: when they save and invest, those dollars add to the capital stock and raise workers’ productivity and family incomes. The act of saving, in other words, creates benefits for other people.
This proposal is identical to the previous proposal with one exception: we do not tax income that is saved. Households would be able to deduct their saving, regardless of the form of that saving, but would have to pay tax on all of their dissaving, regardless of its form. Since all income is eventually consumed, all income under this proposal would eventually be taxed.
A Fourteen Percent Value-Added Tax (VAT). A second way to tax consumption is with a value-added tax (VAT). This approach taxes business sales minus the costs of a) intermediate inputs and b) net investment in plant and equipment. Since the value of sales at each stage of production incorporates the costs of intermediate inputs used, what is really being taxed is the additional value that has been added. Across all businesses, taxing value added minus net investment is the same as taxing national income minus net investment. But net investment equals net saving (since what is saved is invested), and income not saved is consumed. Hence, the VAT represents an indirect way to tax consumption.
An advantage of the tax is its ease of administration. Instead of 129 million individual tax returns, the tax would require only 20 million business establishments to file returns. A disadvantage is that the tax tends to be hidden and therefore not transparent. Consumers are usually unaware of how the tax affects the prices of items they buy. Workers are usually unaware of how the tax affects their take-home pay.
The VAT considered here would not be restricted to what most people regard as “business” enterprises. The tax would also apply to schools, hospitals, churches, nonprofit charities and even state and local governments. Under the current system, the federal government collects employee income tax revenue from all of these entities. If we were to abolish the income tax on wages, we must collect an equivalent amount in the form of a VAT. The mechanics are doable, even though they will strike many people as novel.
Some foreign countries exempt certain economic sectors from the VAT. But every exemption means a higher tax rate.
A Sixteen Percent Retail Sales Tax. The most direct and transparent way to tax consumption is with a retail sales tax. Unlike the VAT, this tax would be visible to consumers when they purchase goods and services. Even fewer entities would need to file returns than under a VAT. Think of the stages of production for a loaf of bread. A VAT would be collected from the farmer, the miller, the baker, the wholesaler and so forth. A sales tax concentrates the entire collection at the point of final sale. The advantage is lower cost of administration. A possible disadvantage is increased incentives for evasion and avoidance on the part of retailers and their customers.
Like the VAT, a retail sales tax would have to be collected from the nonprofit sector and state and local governments. Although this is doable, most state governments exempt these sectors from their own sales taxes. Any exemptions, however, require a higher tax rate. The 16 percent retail sales tax rate effectively equals the 14 percent rate of the previous two consumption tax proposals. The difference between the two rates reflects the way in which they are expressed.
Incorporating Social Security Reform. Social Security reform has two provisions: (1) phasing out the old system by paying workers in retirement only those benefits they have accrued as of the time of reform, and (2) instituting mandatory personal retirement accounts. Tax reform can be combined with Social Security reform. For example, if one were to raise the flat consumption tax rate to 17 percent, one could devote three percentage points to personal retirement accounts, matched by one percent contributions from both employees and their employers. These five percent accounts will grow over time and completely replace the current pay-as-you-go system in about four decades.
Simulating the Impact of Reform. The current tax system imposes huge and unnecessarily burdensome compliance costs on taxpayers. It also distorts incentives, leading to a misallocation of resources and encouraging the growth of an underground economy. We do not attempt to estimate the gains from reducing those distortions in this study. Instead, the model used here is well-geared to assessing the macroeconomic consequences of tax reform, including estimates of the required tax rates, the impact on saving and investment decisions, real wages, real interest rates, and the welfare consequences for broad classes of taxpayers grouped by income and age.
Economic Consequences of Tax Reform. Our simulations show that moving to a consumption tax, whether implemented as a personal consumption tax, a value-added tax, or a retail sales tax, would cause a substantial increase in the nation’s capital stock. This, in turn, would raise wages and real output compared to the current system. Specifically,
- National income would be 6 percent higher than otherwise by 2030, and 9 percent higher by 2050.
- Real wages would be 4 percent higher by 2030 and 6 percent higher by 2050.
As noted, low-income families proportionally gain the most from these reforms and there are especially large payoffs for future generations:
- For those born in 2000, the lifetime gains are almost 14 percent for the bottom third of the income distribution, 4 percent for those in the middle and 2.4 percent for those at the top.
- For those to be born in 2030, the lifetime gains are 18 percent, 6 percent and 3 percent, respectively.
Economic Consequences of Tax Reform Plus Social Security Reform. In some ways, Social Security reform is even more important than tax reform because it avoids dramatic increases over time in payroll taxes that would otherwise be needed to pay benefits to the elderly. Overall:
- Taxes as a percent of national income will rise from 36 percent today to 46 percent by 2030 and 50 percent by the end of the century in the absence of any reform.
- With the package of reforms proposed here, however, taxes will peak at 42 percent of national income in 2030 and recede to 33 percent by the end of the century.
Lower taxes mean more disposal income, which, in turn, leads to more personal saving and more capital accumulation. Moreover, the expansion of capital leads to higher real wages:
- Without reform, real wages at mid-century will be 10 percent lower than otherwise because of elderly entitlements.
- With the set of reforms proposed here, real wages will be 4 percent higher than otherwise by mid-century and 10 percent higher by the end of the century.
- Without reform, average take-home pay for workers will be 26 percent lower by 2050 and 31 percent lower by the end of the century because of elderly entitlements.
- With the set of reforms considered here, take-home pay will be almost 4 percent higher than otherwise by 2050 and almost 15 percent higher by the end of the century.
Moreover, combining consumption tax and Social Security reform creates very large and very progressive benefits for future generations:
- For individuals born in 1980 and newly entering the labor market today, families in the bottom third of the income distribution can expect a 13 percent increase in their lifetime standard of living, compared to less than 1 percent for those in the middle and less than 2 percent for those at the top.
- For those to be born in 2030, the gains (relative to what otherwise would have happened) are 54 percent for the bottom third, 27 percent for those in the middle and 11 percent for those at the top.
Conclusion. To remain competitive in the modern international economy and to avert the crushing burden of unfunded elderly entitlements, we need both tax reform and Social Security reform. Some have supposed that these are two completely separate endeavors. In fact, the two reforms may be easier to adopt and implement if they are combined.
[page]In this report we consider replacing our current federal income tax system with a completely new system. The five alternative policies considered are (1) an 11 percent flat-rate income tax, (2) a 14 percent flat-rate consumption tax, (3) a 14 percent value-added tax, (4) a 16 percent retail sales tax and (5) a flat-rate consumption tax coupled with Social Security reform.
"We model four ways of replacing the income tax, and consider combining tax reform with Social Security."
In general, we find major long-run output increases from a switch to comprehensive consumption taxation. This finding is consistent with other research. Alan Auerbach finds that output could increase between 2 percent and 9 percent, depending on the particular details of the policy.1 Don Fullerton and Diane Lim Rogers predict increases in output of between 1 percent and 6 percent, depending on how sensitive consumers would be to changes in the rate of return from capital.2 Dale W. Jorgenson and Peter J. Wilcoxen predict an increase in output of about 3 percent.3 Former Congressional Budget Office Director June O’Neill estimates that replacing income taxes with a consumption tax would increase labor supply between 2 percent and 4 percent.4
An oft-repeated objection to previous proposals for fundamental tax reform is that the reforms would benefit high-income taxpayers at the expense of low-income taxpayers. That objection does not apply to any of our proposals. The reason: in each case, we remove the cap on the Social Security (FICA) payroll tax but retain the cap on Social Security benefits. Second, we rebate taxes to the one-third of taxpayers with the lowest incomes to ensure that their aggregate tax burden does not increase. Moreover, under the consumption tax reforms, the economy moves from taxing wage and capital income to implicitly taxing wage income and wealth; that is, consumption taxation effectively taxes wages and wealth because whenever wages or wealth are spent on consumption they are subject to taxation.
Consequently, the reforms we consider are progressive. In each case, those who gain the most from the long-term consequences of the reforms are those with the lowest incomes.
[page]"These tax reforms would maintain the progressivity of the current system; individuals with the lowest incomes would gain the most."
In the modern world, capital can travel around the globe on an electronic highway at the speed of light. Many labor services can travel almost as fast, as American companies discover they can outsource jobs to places as remote as Pakistan and India. At the same time, we are living with a tax system that was designed in the technological dark ages.
The more mobile resources are, the harder it is to tax them. Thus as we move further into the 21st century it will become increasingly difficult to collect taxes from people without offering them an equivalent benefit. Yet the need for tax dollars to benefit people other than the taxpayer is expected to soar with the retirement of the baby boom generation.
If America is going to successfully compete in an increasingly mobile global economy and at the same time meet our commitments to senior citizens, we need radical reform. In particular, we cannot continue with a tax system that imposes high costs on the private sector per marginal dollar of revenue raised. What we need instead is a system that minimizes the cost of meeting our revenue needs.
Three defects of the current system stand out as especially glaring and in need of reform: (1) tax rates are too high, (2) the tax code is too complex, and (3) the system is biased in favor of consumption and against saving.
"The tax code is too complex and the system is biased in favor of consumption and against savings."
Current Marginal Tax Rates. Families with below-average incomes pay very little in the way of federal income taxes. For instance, the bottom 50 percent of all income earners pay less than 4 percent of federal income taxes.5 Yet at the margin these families can face a 15 percent federal income tax rate on top of a 15 percent (FICA) payroll tax (employer and employee combined) and, say, a 4 or 5 percent state and local tax, depending on their income and where they live. All told, moderate-income families give up a third of the last dollar they earn. Factor in state sales taxes and federal income taxes and you get marginal rates close to 40 percent.
Marginal effective tax rates are also very high for higher-income families. Take the top 1 percent of earners, who pay more than a third of all income taxes, although they earn less than a sixth of taxable income.6 Although they max-out on their Social Security payroll taxes, these individuals still face a 35 percent federal income tax rate, a 2.9 percent Medicare tax, a 4 to 8 percent state and local income tax rate, as well as state sales and federal excise taxes (which, as indicated above, effectively tax wages plus wealth). They also see their itemized deductions clawed back as they earn more money. All told, highly paid workers face a roughly 50 percent marginal effective tax rate on earned income.
"It often imposes marginal effective tax rates above 50 percent on the wages of modest-income families."
Interestingly, however, the highest tax rates are not paid by the highest income earners. They are often paid by people who earn only modest incomes. Consider the wife of a man who is in the 35 percent income tax bracket. Even if she earns only the minimum wage, she will be taxed at her husband’s federal, state and local income tax rates. And even though her husband has maxed out his Social Security contributions, she must start all over — paying (together with her employer) 15.3 percent on every dollar of wage income, even though these payments will probably add little to the couple’s retirement benefits. In all, this working wife will face a marginal tax rate well above 50 percent. This is a stellar example of public policy imposing huge costs on a class of taxpayers in return for small revenue gains. And considering that second earner spouses usually have a lot more discretion about labor force participation than primary earners, this tax policy is especially wrong-headed. It imposes the highest marginal tax rate on the marital partner who can most easily avoid paying it (by not working).7
Very-low earners also face high effective marginal tax rates. While they may pay only 10 percent in marginal federal income taxes, add in payroll taxes, state sales taxes and federal excise taxes, and you’re up to a roughly 30 percent effective rate.
"The marginal effective tax rate on retirees who continue working can easily reach 80 percent."
Even higher tax rates are faced by many senior citizens with only modest incomes. Consider a 63-year-old who claims early retirement Social Security, but continues to work (and pay taxes) part-time. Above a certain threshold, this worker will lose $1 of Social Security benefits for every $2 of wages, an effective tax of 50 percent. Add to that the worker’s federal income tax rate, which could range from 10 to 35 percent; an (employer and employee combined) payroll tax rate of 15.3 percent; a state and local income tax rate of 4 or 5 percent; the marginal taxation, under the federal income tax, of Social Security benefits; and state sales taxes and federal excise taxes. And this worker can easily face a total marginal tax rate in excess of 80 percent!8
The example of the senior citizen worker illustrates how the income tax system often interacts with entitlement spending programs to create extremely high effective marginal tax rates. The picture is typically worse for low-income families (say, in the range of $15,000 to $30,000 of annual income) who qualify for the Earned Income Tax Credit (EITC) as well as various welfare benefits. As these individuals earn additional income, they must forfeit tax and welfare benefits at very high rates. In fact, effective marginal tax rates in excess of 100 percent are not uncommon.9
The system is especially harsh on married female workers at the top and bottom of the income ladder. As noted above, women who are married to high-income men face severe tax penalties if they work, even for modest wages. At the other end of the income spectrum, poor women who marry face an additional loss of EITC and welfare benefits. The incentives at the top are for women not to work. The incentives at the bottom are for women not to marry. Neither outcome is good for society.10
"Lifetime marginal tax rates exceed 50 percent for almost all full-time working house-holds."
Lifetime Marginal Tax Rates. Going to work, earning a living, and spending your income affects taxes and benefits not just in the current year, but in all future years as well. If you save and invest some of your current earnings and spend the proceeds in the future, you will raise your future capital income taxes as well as consumption taxes. You will also limit your ability to qualify for future income- and asset-tested government tax credits and welfare benefits. Earning more today will also affect the calculation of your future Social Security benefits as well as the federal income tax assessed on those benefits. For these reasons, it makes sense to consider the lifetime consequences of earning an extra dollar of income today.
In an earlier NCPA publication, Jagadeesh Gokhale, Laurence Kotlikoff and Alexi Sluchynsky produced estimates of lifetime marginal tax rates.11 Their finding: Almost all full-time working households face marginal net tax rates on earnings in excess of 50 percent! That is, American households will eventually hand over half or more of every dollar they earn to state and federal governments in taxes paid net of benefits received. Moreover, the lowest-income households face the highest marginal net tax rates:
- The marginal net tax rate on households earning 1.5 times the minimum wage is 81 percent; families at this income level keep less than one-fifth of the income they earn.
- At two times the minimum wage the marginal net tax rate is 72 percent; these families keep less than 30 cents out of each dollar they earn.
At higher income levels, marginal net tax rates decline as income rises, reflecting the surprising finding that, measured on a lifetime basis, marginal net tax rates tend to be regressive, imposing the highest burdens for extra work on those with the lowest lifetime earnings.12
"High marginal tax rates distort economic incentives to marry, work or save."
Incentive Effects of High Marginal Tax Rates. One consequence of high marginal tax rates is that people will choose to produce less income. If you reduce the rewards from working, there will be less work. This is especially true for marginal labor populations: second-earner spouses, senior citizens and teenagers, for example. A second consequence is that high tax rates affect lifestyle decisions. As noted, both at the top and bottom of the income ladder, couples are penalized if they marry.
A third consequence is the distortion of economic decision-making, whether that decision involves choices by households deciding how much to work or save, or whether it involves choices by firms as to how much and in what manner to produce. With high marginal tax rates, decisions are often excessively driven by the desire to avoid taxation rather than to equate true marginal economic benefit to true marginal economic cost.
A fourth consequence of high marginal tax rates is that they increase the attractiveness of tax evasion — the failure to report taxable income. There have been a number of studies examining the scope of the underground (or “shadow”) economy and how it is influenced by changes in tax policy:
- An International Monetary Fund (IMF) study estimated that the underground economy in the United States was about 10 percent of gross domestic product (GDP).13
- According to the National Bureau of Economic Research, a 10 percentage point increase in the tax burden would cause the underground economy to rise by 3 percent of GDP.14
- A study by the Federal Reserve found that a 0.7 percent increase in the tax rate leads to a 1.5 percent rise in underground activity.15
Although these studies focus on the total tax burden, the higher the marginal tax rate associated with a given tax burden, the greater the incentive for nonreporting at the margin.
Other Social Costs. Today’s graduated income tax system is a morass of deductions, exemptions, allowances, credits and other loopholes. As a result, it is costly to comply with:
- Between 1955 and 2000, the income tax law grew from 172,000 words to 982,000 — an increase of 472 percent. Federal tax regulations grew from a combined 744,000 words to 6,929,000 — an increase of 831 percent.16
- The IRS estimates that taxpayers spend more than 5.7 billion hours on paperwork.17
- Administrative costs for the government and the cost in taxpayer time and expenditures for the individual income tax amounts to about 10 percent of federal income tax collections.18 However, this estimate excludes the cost of tax planning, tax audits and litigation, as well as foregone economic activity.
"It is costly to comply with the complex income tax code."
Every tax imposes deadweight costs on the economy. How big are these costs? Edgar K. Browning estimated that deadweight losses are typically 9 percent to 16 percent of tax revenues, Charles J. Ballard and colleagues estimated that they typically range between 15 and 50 percent of tax revenues, and Charles Stuart concluded they probably exceed 50 percent.19 Looking at the 1993 federal income tax increase, Martin Feldstein found that per dollar of revenue raised, it imposed economic losses equal to 300 percent of the revenue raised.20
The economic drag of a tax system is greatest at the margin. The Joint Economic Committee of Congress concluded that “40 cents in lost economic welfare per dollar of tax would be a reasonable estimate.”21
Bias Against Saving and Investment. In addition to generating high marginal tax rates and incredible complexity, the tax system suffers from a third defect: It is biased in favor of consumption and against saving and investment.
"The current system taxes consumption once, but taxes savings several times."
Consider the fact that a dollar earned and consumed is a dollar that is taxed only once by the personal income tax system. But a dollar that is earned and saved is likely to be taxed many times. For example, investment income is taxed first at the corporate level by the corporate income tax. When the remainder comes to you in the form of dividends or interest, it is taxed a second time. If you sell the business, you can be taxed a third time through a capital gains tax on income your investment is expected to generate in the future. And after you die, your investment can be taxed a fourth time through the inheritance tax.
One way to address this problem would be to move to a system that is neutral between consuming today and saving, in order to consume at some future date. This system, favored by many economists, is consumption taxation. Consumption taxation not only provides no incentive to consume early, it also discourages consumption. Take Warren Buffet. When Buffet uses his wealth to invest, he adds to the nation’s capital stock, which in turn raises the productivity and therefore the wages and after-tax income of workers. However, when Buffet consumes his income, there are no spillover effects for society as a whole. So it makes sense to tax that activity.
"People pay a consumption tax based on what they take out of the economy, not on what they put in."
Put another way, when Warren Buffet invests, you and I benefit. When he consumes, only he benefits. Therefore, from a purely selfish perspective we should not be indifferent about the choices he makes. The idea behind a consumption tax is that people should be taxed based on what they take out of the economy, not on what they put in.
Experience of Other Countries. Most countries in the world have, or have had, income tax systems with multiple rates and numerous exemptions, deductions, exclusions and other complicated loopholes. In a few cases, countries have replaced these systems with a system that taxes income at a single low rate. Hong Kong is a stunning economic success story in the modern era. Many attribute its success to its policies of free trade and a 15 percent flat tax. More recently, Russia replaced its tax system with a 13 percent flat-rate income tax in 2000, apparently leading to increase government revenue and contributing to economic growth.22 Seven other central and eastern European countries have also adopted a flat tax: Estonia (1994), Latvia (1995), Serbia (2003), and Ukraine, Slovakia, Georgia and Romania (2004).23
[page]"Over the next 30 years the number of elderly will double; the number of workers will rise by less than 10 percent."
The impending dramatic aging of the U.S. population (and an even more severe aging problem in Europe and Japan) will have a severe impact on the nation, particularly on its fiscal system. Throughout the developed world retirement and health care benefits for the elderly are paid primarily out of contemporaneously collected payroll taxes. Under these “pay-as-you-go” systems of finance, workers do not set aside funds to finance their own retirement benefits. Instead they pay taxes to support the current generation of retirees. When today’s workers reach their own retirement years, they will have to rely on the next generation of workers for their tax funded benefits. Unfortunately, pay-as-you-go funding arrangements are very vulnerable to changes in population demographics.
In the United States, a monumental shift will occur over the next 30 years — as 77 million baby boomers cease to work and pay payroll taxes, and instead retire and collect benefits. The number of elderly in the United States, Europe and Japan will more than double. At the same time, the number of workers available to pay for their elders’ government-guaranteed pension and health care benefits will rise by less than 10 percent.
As we noted in a previous NCPA publication,24 paying the elderly their promised benefits will require large tax increases, including sharply higher payroll taxes. For example:
- In order to finance elderly benefits in the United States, the payroll tax will have to climb from 14 percent (the current pay-as-you-go cost rate) to 23 percent over the next 30 years, while the average income tax on wages will rise from 10 to 14 percent.
- Thus the total tax on wages will rise from 24 percent to 38 percent by 2030 and to 40 percent by mid-century.
Higher taxes mean lower after-tax income for workers. But they also have another, highly damaging effect. Less disposable income means less saving; less saving means less capital formation; less capital formation means lower labor productivity; and lower productivity means lower real wages.
"International competition for capital will raise interest rates."
Ordinarily, one would expect an economy that is short of capital to turn to international capital markets. However, because the capital shortage in Europe and Japan will be even more severe than that in the United States, the other two regions will bid capital away from our country. Over the course of this century, the international capital shortage will raise real interest rates by 4.4 percentage points (440 basis points).
The emerging capital shortage will significantly reduce real wages per unit of human capital (labor productivity absent technological change). As Table I shows:
- Real wages of U.S. workers will be 10 percent lower than otherwise by 2030 and 15 percent lower by the middle of this century.
- By 2030, projected tax hikes combined with the decline in pretax wages will cause workers’ take-home pay to be about one quarter less than otherwise.
- By mid-century, the American worker’s aftertax income will be almost one-third lower than otherwise.
"Living standards will fall."
As bad as these results are, the future for Europe — where fertility rates are much lower and prospective aging much more severe — is substantially worse.
- In Europe, where the total tax on wages is already above 40 percent, the tax burden will rise to 60 percent by 2030 and approach a staggering 70 percent by mid-century.
- Combining these tax rates with an 8 percent simulated fall in real wages, the expected reduction in take-home pay of European workers will be one quarter by 2030.
- By mid-century, the relative fall in after tax wages will exceed 40 percent relative to what it would have been without the growing burden of elderly entitlements.
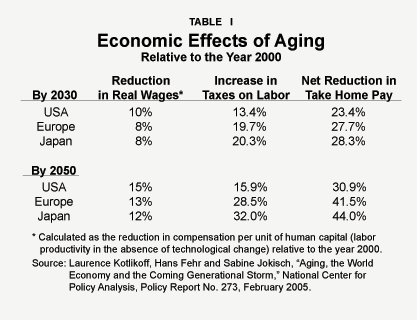
"By mid-century, the standard of living of U.S. workers will be nearly one-third lower than otherwise."
Like Europe, Japan already has taxes on wages in excess of 40 percent, and its aging society will cause a doubling of the payroll tax over the next 50 years. As in Europe, the results will be devastating:
- By 2030, the total tax on labor in Japan will approach 60 percent, and Japanese workers will face a one-fourth reduction in their take-home pay.
- By the middle of this century, the effects of elderly entitlements will push the Japanese tax on labor to 70 percent and the aftertax wages of Japanese workers will be more than 40 percent lower than they otherwise would have been.
"Our projections are based on optimistic assumptions about fertility rates and health care costs."
In making these estimates, we assume that the fall in fertility rates will reverse over time and that women will eventually have enough children to replace the current population — the exact opposite of recent trends. We also assume that the growth of health care costs per beneficiary will match the rate of growth of per capita real wages — even though they have grown many times faster in recent years. As a result of these very conservative modeling assumptions, the results reported here err on the side of optimism. Reality is likely to be far worse.
[page]The model used here is state-of-the-art for estimating the macroeconomic consequences of tax reform, including estimates of the required tax rates; the impact on saving and investment decisions, real wages, and real interest rates; and the welfare consequences for broad classes of taxpayers grouped by income and age.25
The model does not, however, estimate certain microeconomic benefits of reform including (1) the gain from lowering the accounting, legal, administrative and other paperwork burdens of the current system; (2) the allocative gain from reducing incentives to over-consume particular goods and services, such as housing and medical services, which are favored by the current tax system, and (3) the gains from reducing the size of the underground economy. These unmeasured gains are likely to be very large.
[page]"Federal income taxes equal about 15 percent of national income."
Surprisingly, the amount of revenue the federal government collects from the personal income tax is only 12.5 percent of total national income.26 If corporate income taxes are included, federal income taxes take 15.1 percent of income. Thus, in principle, government would have just as much money if it levied a 15.1 percent, across-the-board tax on all income. However, when coupled with two other changes we propose, the government’s revenue needs can actually be met with an across-the-board rate of 11.2 percent.27
This proposal consists of three elements: (1) replace federal personal and corporate income taxes with a single 11 percent tax on all income; (2) rebate the 11 percent tax to the lowest one-third of income earners, provided they acquire health insurance and establish pension, retirement savings and individual development accounts; and (3) apply the Social Security (FICA) payroll tax to all wage income.
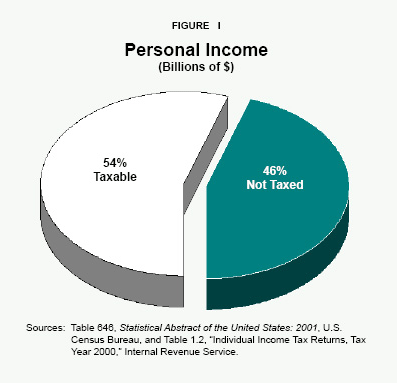
Implementing a Flat Rate Income Tax. One reason why marginal tax rates under the current system are so high is that today’s deductions, exemptions and loopholes result in nearly half of all personal income not being taxed at all. [See Figure I.] The tax rate can be quite low if we apply it to all income. How would the flat income tax be collected, mechanically? One method is to continue as we do under the current system, with individuals reporting and paying taxes on their personal incomes and corporations reporting and paying taxes on corporate income. Reforms suggested by Robert Hall and Alvin Rabushka are also worth considering.28
However, the flat tax proposal crafted by Hall and Rabushka and popularized by Congressman Dick Armey29 is different from the one described here in two important ways. First, the Armey flat tax has generous personal allowances that have the effect of exempting about half of all taxpayers from paying the tax. We believe this is politically unwise. It would create a situation in which half the population has no interest in keeping the rate low. Under our proposal, everyone pays the tax. And beyond the 11 percent rebates (described below), everyone will pay for an increase. For example, if the rate were raised from 11 to 12 percent, the additional 1 percent would apply to everyone’s income. A second difference between this proposal and the Armey flat tax is that the Armey flat tax exempts saving and investment.30
Gains and Losses from a Flat-Rate Income Tax. In order to take advantage of this new tax, taxpayers would have to give up all the many opportunities now available to them to reduce their taxable income. This would mean no more deductions for home mortgage interest, charitable contributions and state and local taxes. It would also mean that employee benefits, including health insurance and pension contributions, would no longer be excluded from employee income. There would no longer be tax-free municipal bonds. And individuals would no longer have access to tax deductions and tax-free growth in their IRA and 401(k) accounts.
Make no mistake about it. Giving up these tax loopholes would be painful. But in return for this sacrifice there would be a very attractive gain. Taxpayers would get to keep 89 cents of each additional dollar of income they earn.
"Nearly half of all income is not taxed by the current system."
Rebates for Below-Average Income Families. The one-third of households with the lowest incomes pay virtually no federal income taxes. So an 11.2 percent flat tax would represent a significant tax hike for this group. To offset this tax increase and maintain the progressivity of the current system one could rebate the 11.2 percent to these families either in cash or in one of the following two ways.
First, families could receive a rebate equal to 5.6 percent of income provided they have proof of health insurance coverage. Insurance coverage would include Medicare, Medicaid, employer coverage and individually purchased insurance. Interestingly, there are about 13 million people, about one-third of the uninsured, who qualify for Medicaid and SCHIP (state health insurance programs for children) but who have not enrolled.31 There are also nine million employees and employee dependents who are eligible for employer plans but do not enroll, or about one in five of the uninsured.32 We would expect all these people to obtain coverage quickly in order to reclaim their 5.6 percent. In fact, we believe this proposal would insure more people overnight than the number of uninsured that have been insured by all federal and state programs combined over the past decade.
"Lower-income earners could apply half their rebate to purchase health insurance."
Those who do not have health insurance, or an opportunity to enroll at low cost, would have two choices. They could apply their 5.6 percent rebate to the purchase of health insurance or they could do nothing. In the latter case, the funds would be added to safety net health care programs that deliver free care to low-income, uninsured individuals.
Note: Although not part of this proposal, there would be an opportunity here to rationalize our otherwise arbitrary, unintegrated approach to low-income health care through tax and spending subsidies. Specifically, we could combine all funds that are available and offer a lump sum to the uninsured that they could apply to the purchase of private health insurance or that would be allocated to a safety net in the community where they live.33
"The other half of their rebate could fund a pension."
The second 5.6 percent rebate would be reserved for pension funds, retirement accounts and Individual Development Accounts (IDAs). As in the case of health insurance, people who (along with their employers) deposit at least 5.6 percent of income into an IRA, 401(k), and so forth, could claim the rebate outright. Those who are retired would receive an automatic cash rebate. But those of working age could claim the rebate only if the funds are placed in an IDA or retirement account. The idea behind IDAs is that people should be encouraged to accumulate human and nonhuman capital. Funds in these accounts would grow over time and could be withdrawn for such human capital expenditures as college tuition, vocational training, and so forth, but could not be used for consumption until the time of retirement.34
Why not give the rebate in cash and let families spend the money as they choose? We could. However, tax reform gives us an opportunity to solve important social problems. When people fail to obtain health insurance and provide for their own retirement they create external costs for others. The rebates described here solve social problems by internalizing the externalities.
Some may object that conditional rebates may cause hardships for some families. Consider a low-income family that currently has no health or retirement accounts. This proposal threatens to reduce this family’s disposable (cash) income by 11.2 percent. That may be a harsh blow, even if it ultimately leads to health insurance and a pension. To ease the transition burden for this and similarly situated families, we could phase in the withholding of rebates (for noncompliance) over time.
Extending the Payroll Tax to All Wage Income. The Social Security payroll tax applies to all wage income up to $90,000 in 2005. Some people propose to raise the amount of income subject to the tax (or even eliminate the cap altogether). But higher-income individuals would not get any additional retirement benefits in return for these higher taxes.
"All wage income would face a 26 percent tax rate; all capital income would be taxed at 11 percent."
Tacked onto the current tax system, such a proposal would be unwise. High-income taxpayers would, as a result, face more than a 50 percent marginal tax on wages, but only a 15 percent tax on dividends and capital gains. This would create powerful incentives (for people who are in the best position to take advantage of those incentives) to convert wage income into dividends or capital gains income. It would also create unhealthy incentives to avoid wage income in other ways.
In our reformed system the case for removing the cap is much stronger. Note that with the above reforms we would be left with an 11 percent tax on all income and a 15 percent payroll tax on wage income below the cap. That would mean that workers who earn less than $90,000 would face a total marginal tax on wages of 26 percent, where as those earning more would face a rate of only 11 percent.
That result might make sense if people were funding their own retirement benefits, but in fact they are not. Payroll taxes collected from today’s workers pay benefits for today’s retirees. That being the case, it is hard to justify a regressive funding mechanism. Accordingly, we consider applying the FICA tax to all wage income in our reformed system.
That leaves us with an 11 percent tax on all capital income and a 26 percent tax on all wage income.
"Even with reform, future tax burdens will rise."
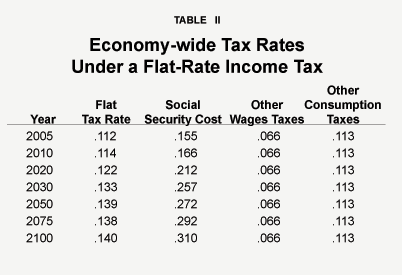
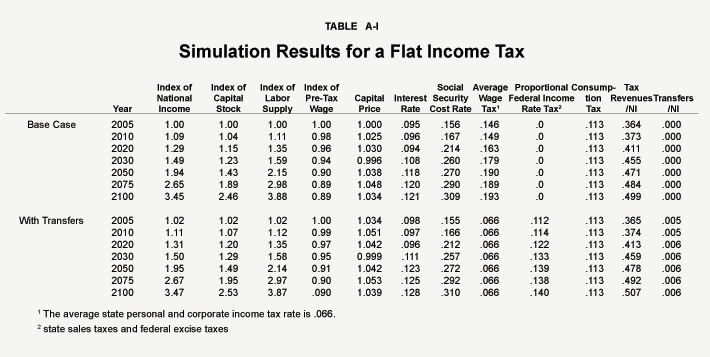
Economic Effects of the Reform. The simulation reported in Table A-I in the appendix assumes an initial flat-rate tax of 11.2 percent on all income. Because of the rising cost of elderly entitlements, this rate would rise to 13.3 percent by 2030 and almost 14 percent by mid-century. With efficiencies and greater compliance, however, the actual required tax rates would be lower.
As noted above, we do not try to estimate the microeconomic gains from lower compliance costs and greater allocative efficiency in the use of resources. That said, the macroeconomic impact of this proposal is less than many might suppose — with only about a 1 percent gain in national income and real wages by 2030.
Part of the problem is that even with the lower tax rates, the reformed system still encourages consumption rather than savings. Also, unreformed elderly entitlements program continue to drive up tax burdens through time. [See Table II.] All taxes as a percent of national income (even with a flat federal income tax) will climb to 46 percent by 2030 and 48 percent by mid-century.
Distributional Effects of the Reform. Some critics complain that flat-rate tax proposals would shift the burden of taxation from the rich to the nonrich. That certainly does not happen here. Families in the lowest one-third of the income distribution would see no increase in taxes. There would, however, be a forced shift in consumption of that income — through much wider extension of health insurance, retirement savings and human capital accounts.
"By mid-century the federal government will need 45 percent of national income."
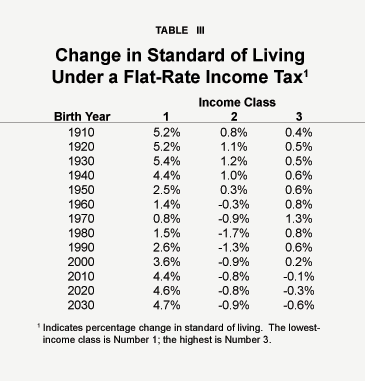
Table III shows the effects of this proposal on the standard of living of people at different age and income levels. The welfare change is calculated by asking by what percentage would one need to increase a person’s annual consumption and leisure under the current system in order to achieve the same level of wellbeing that is achieved with tax reform. The table has two remarkable features. First, despite some fairly radical changes in the tax system, the long run impact on moderate and high-income taxpayers is less than 1 percent in most cases. Put another way, the change in the distribution of the tax burden is very small indeed. Second, to the degree there is an impact, low-income households would gain the most from these reforms in every generation.
[page]This proposal has three elements: (1) replace federal personal and corporate income taxes with a flat tax on all income consumed; (2) rebate the tax to the lowest one-third of income earners, provided they acquire health insurance and invest in cash or in pension accounts, retirement accounts or Individual Development Accounts; and (3) apply the Social Security (FICA) payroll tax to all wage income.
"Welfare gains from a flat rate income tax would be greatest for the lowest-in-come earners."
One disadvantage of the previous proposal is that it makes no distinction between consumption on the one hand and saving and investment on the other. Yet as noted above, there are economic benefits to be derived from taxing consumption as opposed to taxing all income. This proposal differs from the previous one in that it taxes only that part of income that is consumed rather than saved.
There are three ways to implement a flat-rate consumption tax. We will consider each of these in turn.
A Fourteen Percent Personal Consumption Tax. How do we move from a flat income tax to a flat consumption tax? Under a proposal made by Hall and Rabushka,35 it’s not that difficult. Recall that under our flat income tax there are absolutely no deductions, exemptions, exclusions, credits, etc. The same holds true for our version of the consumption tax with one exception: we do not tax income that is saved. Households would be able to deduct their saving, regardless of the form of that saving, but would have to pay tax on all of their dissaving, regardless of its form.
"There are three ways to implement a flat consumption tax."
For example, at the place of work, contributions to pension plans, 401(k) plans and other retirement accounts would not be included in the taxable income of employees. Funds in these accounts would become taxable only when paid out or withdrawn and used for consumption of goods and services. Similarly, on individual tax returns, people could deduct contributions to IRAs and other tax-deferred savings accounts. Funds in these accounts would grow tax free and be taxed only at the point of withdrawal.36
"One way: a 14 percent flat tax."
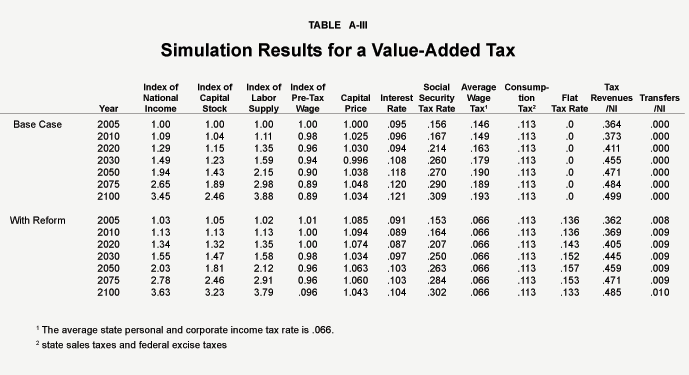
A Fourteen Percent Value-Added Tax. A second way to tax consumption is with a value-added tax (VAT). This approach taxes business sales minus the costs of a) intermediate inputs and b) net investment in plant and equipment. Since the value of sales at each stage of production incorporates the costs of intermediate inputs used, what is really being taxed is the additional value that has been added. Across all businesses, taxing value added minus net investment is the same as taxing national income minus net investment. But net investment equals net saving (since what is saved is invested), and income not saved is consumed. Hence, the VAT represents an indirect way to tax consumption.
A disadvantage of the VAT is that it is essentially hidden. Since businesses pay the tax, it is included in final retail sales prices. That means consumers never see how much the tax affects the prices of things they purchase. Similarly, employees never see how much the tax affects their take-home pay.37 Against these disadvantages, there is one huge advantage: ease of administration. Instead of 129 million individual tax returns filed every year, the VAT would only require filing by about 20 million businesses.
"Second way: a 14 percent value added tax."
The VAT considered here would not be restricted to what most people regard as “business” enterprises. The tax would also apply to schools, hospitals, churches, nonprofit charities and even state and local governments. Under the current system, the federal government collects employee income tax revenue from all of these entities. If we were to abolish the income tax on wages, we must collect an equivalent amount in the form of a VAT. The mechanics are doable, even though they will strike many people as novel.
Every industrialized country, other than the United States, has a VAT. However, in no country has a VAT replaced the income tax; industrialized countries have used it to supplement their income tax revenues and as a consequence the overall tax burden has risen. Furthermore, the efficiency gains are reduced if some goods are exempted or taxed at lower rates than others. This has occurred in many countries.38
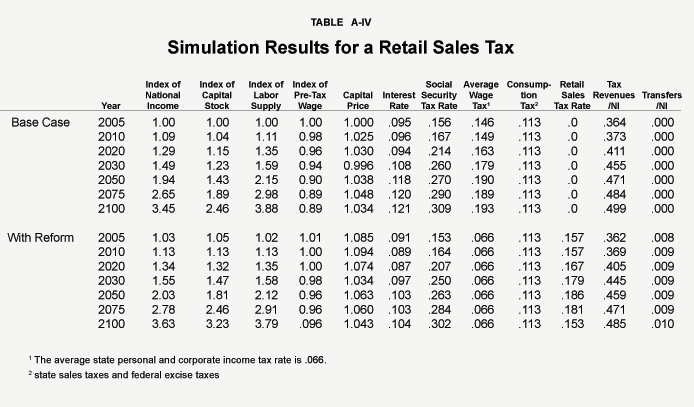
"Third way: a 16 percent retail sales tax."
A Sixteen Percent Retail Sales Tax. The most direct and transparent way to tax consumption is with a retail sales tax. The 16 percent retail sales tax rate effectively equals the 10 percent rate of the previous two consumption tax proposals. The difference between the two rates reflects the way in which they are expressed.
Unlike the VAT, this tax would be visible to consumers when they purchase goods and services. Even fewer entities would need to file returns than under a VAT. Think of the stages of production for a loaf of bread. A VAT would collect from the farmer, the miller, the baker, the wholesaler and so forth. A sales tax concentrates the entire collection at the point of final sale. The advantage is lower cost of administration. A possible disadvantage is increased incentives for evasion and avoidance on the part of retailers and their customers. Like the VAT, a retail sales tax would have to be collected from the nonprofit sector and state and local governments. Although this is doable, most state governments exempt these sectors from their own sales taxes. Any exemptions, however, require a higher tax rate.
"Welfare gains from a flat consumption tax would be greatest fro the lowest-income earners."
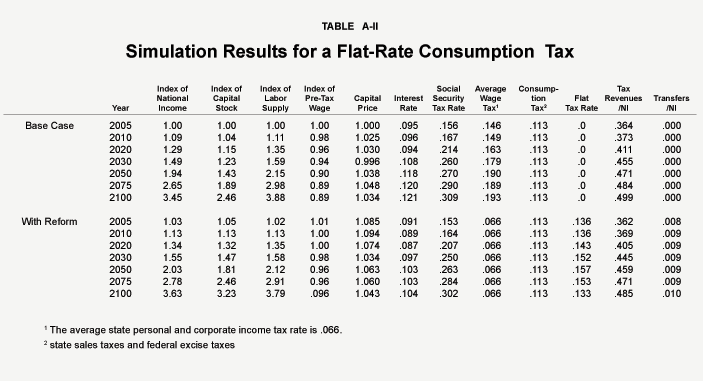
Economic Consequences of a Flat-Rate Consumption Tax. In the simulations reported in Table A-II and Table A-III in the appendix, an initial rate of 13.6 percent is required for both the personal consumption tax and the VAT proposals. This rate will rise to 15.7 percent by 2050, but because of higher economic growth will recede to 13.3 percent by the end of the century. As Table A-IV in the appendix shows, the retail sales tax rate required would initially be 15.7 percent, rising to 18.6 percent by mid-century and receding to 15.3 percent by the end of the century. As under the previous proposal, the actual rates could be lower with efficiencies and greater compliance.
Our simulations show that in the face of new tax incentives there would be a substantial increase in the nation’s capital stock. Specifically, the capital stock would be 24 percent higher by 2030 and 38 percent higher by 2050 because of tax reform. A higher capital stock, in turn, would raise real wages and aggregate output:
- National income would be 6 percent higher than otherwise by 2030, and 9 percent by 2050.
- Real wages would be 4 percent higher by 2030 and 6 percent higher by 2050.
Thus, for a $40,000 a year employee, the reform is worth about $2,000 a year in additional pretax wages.
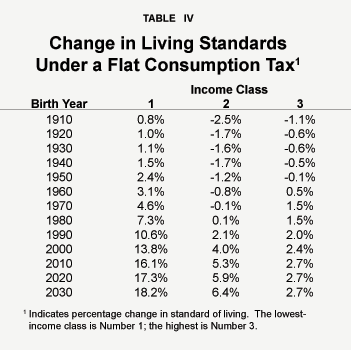
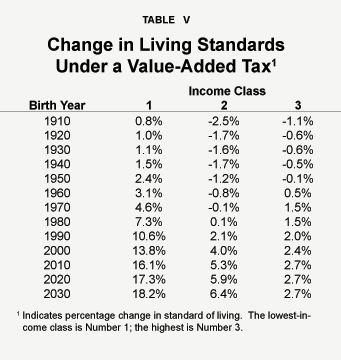
Distributional Effects of a Consumption Tax. As in the case of a flat income tax, low-income families gain the most from this reform at every age level. And there are especially large payoffs for future generations. As Tables IV and V show:
- Among 25-year-olds (born in 1980), the reform promises a 7 percent increase in the lifetime living standard for someone in the lower one-third of the income distribution, compared to only modest increases for those in the middle and at the top.
- For those born in 2000, the lifetime gains are almost 14 percent for the lower third of the income distribution, 4 percent for those in the middle and 2.4 percent for those at the top.
- For those to be born in 2030, the lifetime gains are 18 percent, 6 percent and 3 percent respectively.
"Welfare gains from a VAT would be greatest for the lowest-income earners."
The idea behind Social Security privatization proposals is almost every-where the same: to replace a pay-as-you-go pension system with a funded system. Thirty countries have already enacted such reforms to a greater or lesser degree. Under our current pay-as-you-go system, taxes paid by today’s workers are mainly used to pay the benefits of today’s retirees. None of these funds are set aside and invested. As a consequence, when today’s workers retire their benefits will be paid only if even higher taxes can be collected from the next generation of workers. As we have seen these tax rates will be high and collecting them will impose a severe cost on the economies of all developed countries.
An alternative to a pay-as-you-go system is one under which workers put aside funds during their working years to pay their own benefits during their retirement years. Under a fully funded system, each generation pays its own way.
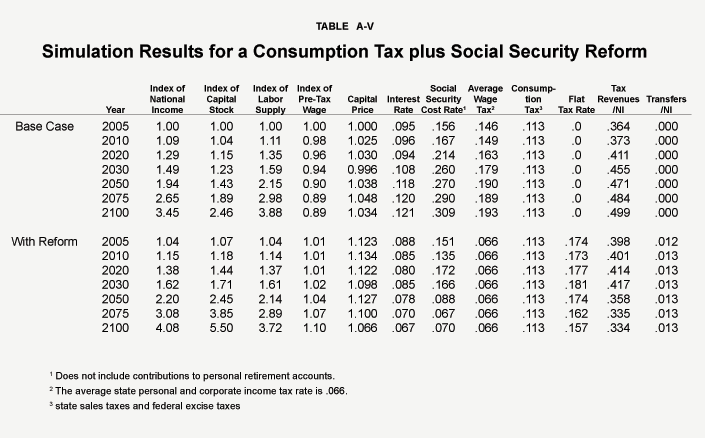
"A 17 percent flat-rate consumption tax would replace income taxes and fund contributions to personal retirement accounts designed to eventually replace pay-as-you go Social Security financing."
This proposal consists of four elements: (1) replace federal personal and corporate income taxes with a 17 percent flat-rate consumption tax, where the rate is measured on a tax-inclusive basis; (2) use 3 percentage points of the new tax to match contributions of 1 percent each by employees and their employers to create 5 percent personal retirement accounts designed to eventually replace the current pay-as-you-go Social Security system; (3) rebate the 17 percent consumption tax conditionally to the bottom one-third of the income distribution to those with health insurance and retirement accounts, pensions or Individual Development Accounts; and (4) apply the Social Security (FICA) payroll tax to all wage income.
Social Security Reform. In structuring a privatization proposal, we examined the plan of Saving and Rettenmaier,39 who propose 5 percent individual retirement accounts funded by 1 percent payroll contributions from employees, matched by a 1 percent contribution from employers and 3 percent from the government. The government’s contribution could consist of a diversion of payroll taxes or payments from general revenue. In either case, the transition is made possible in our proposal by the new consumption tax.
In the Saving/Rettenmaier proposal, the option to establish a personal retirement account (PRA) is voluntary and lower-income workers get larger government matches in order to replicate the progressivity of the current system. As the PRA balances grow over time, government-paid benefits are reduced. Over the course of one’s work life, a 5 percent account should be sufficient to replace currently scheduled Social Security benefits for an average-income worker.
In this analysis we assume that all workers participate in the private system and all retirees remain in the current system. We also assume that all workers contribute the same percent of wages (5 percent) regardless of income.
Economic Effects of the Reform. As with the preceding analysis, the move to a consumption tax and its more favorable treatment of capital leads to higher real wages for workers. In some ways, however, Social Security reform is even more important than tax reform because it allows us to avert major hikes in payroll taxes over time. Overall:
- Under current policy, taxes as a percent of national income will rise from 36 percent today to 46 percent by 2030 and 50 percent by the end of the century in the absence of any reform.
- With the package of reforms proposed here, however, taxes peak at 42 percent of national income to 2030 and fall to 33 percent by the end of the century.
"With these reforms, the Social Security payroll tax rate could be cut in half by 2050."
In the simulation shown in Table A-V in the appendix, the flat consumption tax rate itself begins at 17.4 percent, rises to 18.1 percent by 2030 and recedes to 15.7 percent by the end of the century. By far the biggest component of the favorable shift in the tax burden is the avoidance of high payroll taxes needed to pay Social Security benefits:
- In the absence of reform, the required payroll tax for Social Security will almost double by 2030 and rise to 31 percent of payroll by the end of the century.
- By contrast, with Social Security reform the needed payroll tax will be one-half its current level by 2050 and one-third of its current level by the end of the century.40
Lower taxes mean more disposal income, which, in turn, leads to more saving and more capital. Moreover, the expansion of capital leads to higher real wages.
- Without reform, real wages at mid-century will be 10 percent lower than otherwise because of elderly entitlements.
- With the set of reforms proposed here, real wages will be 4 percent higher than otherwise by mid-century and 10 percent higher by the end of the century.
- Without reform, average take home pay for workers will be 26 percent lower by 2050 and 31 percent lower by the end of the century because of elderly entitlements.
- With the set of reforms proposed here, pretax wages are 21 percent higher at the end of the century than would otherwise be the case and the effective average tax on wages falls from roughly 60 percent to roughly 37 percent.
"With these reforms, living standars."
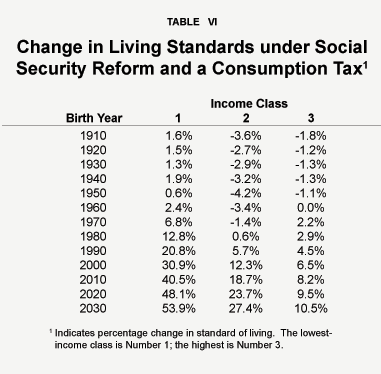
Distributional Effects of Reform. As noted, this package of reforms benefits low-income families the most, at every age level. It also creates very large and very progressive benefits for future generations. As Table VI shows:
- For individuals born in 1980 and newly entering the labor market today, families in the bottom third of the income distribution can expect a 13 percent increase in their lifetime standard of living, compared to a less than 1 percent for those in the middle and a less than 2 percent for those at the top.
- For those to be born in 2030, the gains (relative to what otherwise would have happened) are 54 percent for the bottom third, 27 percent for those in the middle and 11 percent for those at the top.
To remain competitive in the modern international economy and to avert the crushing burden of unfunded elderly entitlements, we need both tax reform and Social Security reform. Some have supposed that these are two completely separate endeavors. In fact, needed reforms may be easier to implement if they are combined.
NOTE: Nothing written here should be construed as necessarily reflecting the views of the National Center for Policy Analysis or as an attempt to aid or hinder the passage of any bill before Congress.
[page]- Alan Auerbach, “Tax Reform, Capital Allocation, Efficiency, and Growth,” in Aaron and Gale, eds., Economic Effects of Fundamental Tax Reform (Washington, D.C.: Brookings Institution Press, 1996).Cited in June O’Neill (director), “The Economic Effects of Comprehensive Tax Reform,” Congressional Budget Office, July 1997.
- Don Fullerton and Diane Lim Rogers, “Assessing the Effects of Fundamental Tax Reform with the Fullerton-Rogers General-Equilibrium Model,” Joint Committee on Taxation, January 1997.
- Dale W. Jorgenson and Peter J. Wilcoxen, “The Long-Run Dynamics of Fundamental Tax Reform,” American Economic Review, Vol. 87, No. 2, 1997.
- June O’Neill, “The Economic Effects of Comprehensive Tax Reform,” Congressional Budget Office, July 1997.
- Jason J. Fichtner, “A Comparison of Tax Distribution Tables: How Missing or Incomplete Information Distorts Perspectives,” Joint Economic Committee of Congress, December 2003, Chart 1.
- Tax Foundation, “Summary of Federal Individual Income Tax Data, 2002,” updated October 20, 2004.
- See “Women as Taxpayers,” John C. Goodman and Celeste Colgan, Women in the 21st Century (Lanham, Md.: Rowman & Littlefield, 2005 forthcoming) and Edward J. McCaffery, “Women and Taxes,” Celeste Colgan, ed., Women’s Agenda (Dallas, Texas: NCPA, 2002).
- Stephen J. Entin, “Reducing the Social Security Benefits Tax,” National Center for Policy Analysis, Brief Analysis No. 337, August 10, 2000.
- Bruce Bartlett, “Taxing the Poor,” National Center for Policy Analysis, Brief Analysis No. 174, September 14, 1995.
- “Women as Taxpayers,” John C. Goodman and Celeste Colgan, Women in the 21st Century (Lanham, Md.: Rowman & Littlefield, 2005 forthcoming).
- Jagadeesh Gokhale, Laurence J. Kotlikoff and Alexi Sluchynsky, “Does It Pay to Work?” National Center for Policy Analysis, Policy Report No. 258, March 2003.
- Ibid.
- Friedrich Schneider and Dominik Enste, “Hiding in the Shadows: The Growth of the Underground Economy,” International Monetary Fund, Economic Issues No. 30, 2002. Available at: http://www.imf.org/external/pubs/ft/issues/issues30/.
-
Steven J. Davis and Magnus Henrekson, “Tax Effects on Work Activity, Industry Mix and Shadow Economy Size: Evidence from Rich-Country Comparisons,” National Bureau for Economic Research, Working Paper No. 10509, May 2004.
-
Jan Ihrig and Karina S. Moe, “Lurking in the Shadows: The Informal Sector and Government Policy,” Board of Governors of the Federal Reserve System, June 2001, p. 12.
- Scott Moody, “The Cost of Tax Compliance,” Tax Foundation, February 2002.
- L. Nye Stevens, “Paperwork Reduction Act Implementation at the IRS,” U.S. General Accounting Office, GAO/GGD-99-4, November 1998.
- Tax Policy for Economic Growth,” Joint Economic Committee of Congress, Staff Report, November 2001, p. 7.
- See Edgar K. Browning, “On the Marginal Welfare Cost of Taxation,” American Economic Review, March 1987; Charles J. Ballard, John Shoven and J. Walley, “General Equilibrium Computations of the Marginal Welfare Costs of Taxation in the United States,” American Economic Review, March 1985; and Charles Stuart, “Welfare Costs per Dollar of Additional Tax Revenue in the United States,” American Economic Review, June 1984. Cited in Richard K. Vedder and Lowell E. Gallaway, “Tax Reduction and Economic Welfare,” Joint Economic Committee of Congress, Study, April 1999.
- Martin Feldstein, “Tax Avoidance and the Deadweight Loss of the Income Tax,” National Bureau of Economic Research, Working Paper No. 5055, March 1995, and “How Big Should Government Be?” Working Paper No. 5868, December 1996.
- “Tax Policy for Economic Growth,” Joint Economic Committee of Congress, Staff Report, November 2001, p. 8.
-
Alvin Rabushka, “The Flat Tax in Russia and the New Europe,” National Center for Policy Analysis, Brief Analysis No. 452, September 3, 2003.
- Alvin Rabushka, “Flat and Happy,” Wall Street Journal, January 12, 2005.
- Laurence Kotlikoff, Hans Fehr and Sabine Jokisch, “Aging, the World Economy and the Coming Generational Storm,” National Center for Policy Analysis, Policy Report No. 273, January 2005.
-
For a detailed description of the model, see Hans Fehr, Sabine Jokisch and Larry Kotlikoff, “The Developed World’s Demographic Transition – The Roles of Capital Flows, Immigration, and Policy,” October 2003. Available at http://www.ncpathinktank.org/pub/pdf/demotransfinal.pdf.
- Author’s calculations, based on 2000 data in Table 646, Statistical Abstract of the United States: 2001, U.S. Census Bureau.
- Specifically, the rate is set at 11.2 percent in 2005, rising to 13.3 percent by 2030, due to the costs of an aging population.
- Robert E. Hall and Alvin Rabushka, The Flat Tax, second edition (Stanford, Calif.: Hoover Institution Press, 1995).
- Bruce Bartlett, “The Armey Flat Tax,” National Center for Policy Analysis, Brief Analysis No. 136, October 18, 1994.
- This effectively transforms it into a VAT with a rebate, which we consider below.
-
Estimates of eligibility for public health care programs vary. The lower estimates are that around 10 million Americans are eligible but unenrolled, while the upper range of estimates is closer to 14 million. One study found that just over half (51.4 percent) of eligible, nonelderly adults were enrolled in Medicaid in 1997. Of the remaining adults who were Medicaid eligible, 21.6 percent had private coverage while 27 percent were uninsured. Another study found that about seven million uninsured children eligible for either SCHIP or Medicaid are not enrolled. See Amy Davidoff, Bowen Garrett and Alshadye Yemane, “Medicaid-Eligible Adults Who Are Not Enrolled: Who Are They and Do They Get the Care They Need?” Urban Institute, Series A, No. A-48, October 2001. Of those children eligible for Medicaid or SCHIP, one-third are eligible for SCHIP while two-thirds are eligible for Medicaid. Eight percent of uninsured, low-income children are illegal aliens and, as such, not eligible for either Medicaid or SCHIP. See Lisa Dubay, Jennifer Haley and Genevieve Kenney, “Children’s Eligibility for Medicaid and SCHIP: A View from 2000,” Urban Institute, Series B, No. B-41, March 2002. Also see “The Uninsured in America,” Blue Cross Blue Shield Association, February 27, 2003.
- Peter J. Cunningham, et al., “Who Declines Employer-Sponsored Health Insurance and Is Uninsured?” Center for Studying Health System Change, Issue Brief No. 22, October 1999.
- See John C. Goodman, “Characteristics of an Ideal Health Care System,” National Center for Policy Analysis, Policy Report No. 242, April 2001.
- Michael W. Sherraden, Assets and the Poor: A New American Welfare Policy (Armonk, N.Y.: M.E. Sharpe, 1991).
- Hall and Rabushka, The Flat Tax.
- The flat tax advocated by Hall and Rabushka, is a variant on a VAT with a rebate. Under the flat tax, businesses are allowed to deduct their wage payments, but households have to pay taxes on the receipt of their wage income. Thus, households, not business, mail the government the tax payments on the value-added associated with the supply of labor.
- June O’Neill (director), “The Economic Effects of Comprehensive Tax Reform,” Congressional Budget Office, July 1997.
- “Surveillence of Tax Policies,” Organization for Economic Cooperation and Development, Economics Working Paper No. 29, 2001.
- Andrew J. Rettenmaier and Thomas R. Saving, “Social Security Reform Without Illusion: The Five Percent Solution,” National Center for Policy Analysis, Policy Report No. 272, December 2004.
- Does not include contributions to personal retirement accounts.
Hans Fehr is Professor of Economics at the University of Wuerzburg (Germany). He received his diploma in Economics in 1989 and his Ph.D. in Economics in 1992 from the University of Regensburg. In 1993-94 he worked as a visiting professor at Boston University and from 1994 to 1998 he was an assistant professor at the University of Tuebingen. Professor Fehr is author or coauthor of three books and various journal articles. His main fields of interest are issues in tax policy and social security reform.
John C. Goodman, Ph.D., is the founder and president of the National Center for Policy Analysis. National Journal recently dubbed him the “Father of Health Savings Accounts,” and he has pioneered research in consumer-driven health care.
Dr. Goodman is the author of eight books, and is author/coauthor of more than 50 published studies on health care policy and other topics. He received a Ph.D. in economics from Columbia University. He has taught and done research at several colleges and universities including Columbia University, Stanford University, Dartmouth University, Southern Methodist University and the University of Dallas.
Sabine Jokisch is a Ph.D. student at the University of Wuerzburg (Germany). She received her diploma in Economics from the University of Wuerzburg in 2001.
Laurence J. Kotlikoff, a senior fellow with the National Center for Policy Analysis, is Professor of Economics at Boston University, Research Associate of the National Bureau of Economic Research, Fellow of the Econometric Society, a member of the Executive Committee of the American Economic Association and President of Economic Security Planning, Inc., a company specializing in financial planning software. Professor Kotlikoff received his B.A. in Economics from the University of Pennsylvania in 1973 and his Ph.D. in Economics from Harvard University in 1977. From 1977 through 1983 he served on the faculties of economics of the University of California, Los Angeles and Yale University. In 1981-82 Professor Kotlikoff was a Senior Economist with the President’s Council of Economic Advisers. Professor Kotlikoff is coauthor (with Alan Auerbach) of Macroeconomics: An Integrated Approach and Dynamic Fiscal Policy; author of Generational Accounting, What Determines Savings?; coauthor (with Daniel Smith) of Pensions in the American Economy; and coauthor (with David Wise) of The Wage Carrot and the Pension Stick. In addition, he has published extensively in professional journals, newspapers and magazines.