President George W. Bush has promoted the “Ownership Society” as a solution to a variety of public policy issues including health care, housing and retirement. The idea is that the welfare of individuals (and thus the nation) is best served by and directly related to, the ability of people to control their own lives and chart their own course toward goals they have chosen. This concept can be extended to environmental issues.
Americans traditionally relied on the common law to defend themselves, their property and the surrounding environment. But in the modern age we have substituted collective decision-making for individual decision-making with respect to many environmental issues. This change in turn has created perverse incentives that (ironically) have led to environmental harm. When land and resources are owned in common, everyone bears the cost of their abuse, not just those who cause the harm. Conversely, those who conserve resources reap only a small portion of the benefits of their action, while making more resources available to those who abuse them. The source of these perverse incentives is lack of ownership. Resources that have no owner have no protector or defender. As a result, self-interested behavior may reduce its value. Government programs and policies — some begun over a century ago, and more recently in the 1960s and 1970s — create these perverse incentives. Among them are subsidies to agriculture, subsidies to development and the Endangered Species Act.
There are many opportunities to combine individual ownership with good incentives and achieve environmental goals that are not being met under the current system. Establishing individual ownership of and responsibility for natural resources would empower individual decision-makers by allowing them to reap the benefits and forcing them to bear the costs of their decisions.
Farm Subsidies. Agricultural subsidy programs include direct payments to farmers for crop production, subsidized crop and disaster insurance, conservation programs and so forth. In the last decade (1995 to 2004), the federal government spent more than $143.8 billion on these programs. Subsidies give farmers financial incentives to plant more crops, regardless of market conditions. In order to produce more, farmers convert wetlands and wildlands to agriculture, intensively use fertilizers and pesticides, and divert water from rivers and streams. For example:
- Roughly half of U.S. wetlands lost from 1986 to 1997, more than 300,000 acres, were converted to agricultural use, according to the U.S. Department of the Interior and the U.S. Fish and Wildlife Service (USFWS).
- Fertilizer and pesticide runoff from farmlands contribute to destructive algal blooms and the 7,000-square-mile dead zone that appears every summer in the Gulf of Mexico off the coasts of Louisiana and Texas .
- Water diversion for irrigation in California has contributed to a 60 percent to 80 percent decline in fish populations in the Trinity River and record low numbers for many species in the San Francisco Bay-Delta ecosystem.
Bringing the ownership society idea to farm policy could reduce these environmental harms. Over perhaps a 10-year period we could simultaneously end all direct and indirect agricultural payments, end subsidized water delivery, remove tariffs and end federal mandates or limits on the amount of acreage that can be used and types and amount of crops that can be grown. Each farmer currently receiving crop payments would receive a flat but declining grant of money each year. Water prices would be gradually increased to market levels and import tariffs and export subsidies would be phased out.
Development Subsidies. The National Flood Insurance Program (NFIP) and U.S. Army Corps of Engineers’ flood control and beach restoration projects subsidize and encourage coastal development. They do so by shifting the cost of insurance and physical protection against floods from property owners to taxpayers. From 1928 through 2001, the Corps spent $123 billion (adjusted for inflation) on flood control projects nationwide. The Corps must spend about $1 million a mile every four years to maintain a mile of sandy beach. These subsidies encourage building on coastal wetlands and beaches. The disruption of wildlife habitat and pollution from these developments have contributed to the decline in oyster beds, sea grasses and other flora and fauna. For instance, coastal development and its associated pollution in the three-state Chesapeake Bay region has resulted in:
- A loss of 58 percent of its historic wetlands,
- A loss of 88 percent of its historic underwater grasslands,
- A historic low in the Bay’s crab harvest and in crab reproductive rates, and
- A 98 percent decline in Bay oyster production.
The best way to protect coastal resources is to end all subsidies that encourage human occupation. Ending the NFIP and Corps flood control and beach erosion programs would still allow the owners of the property to develop as they choose. But ending these programs would ensure that property owners, rather then the general public, bear the full cost of those development decisions. Since in many cases the costs are substantial, reestablishing the link between ownership and responsibility should result in fewer environmentally harmful decisions — especially in areas at high risk of flooding and erosion.
Endangered Species Act Regulations. More than 75 percent of endangered species depend on privately-owned land for all or part of their habitat. The Endangered Species Act (ESA) allows the federal government to control private lands where listed species are found by preventing development or use of the land. Perversely, this gives landowners an incentive to destroy species and habitat in order to avoid onerous restrictions. ESA activities cost the federal government more than $2.4 billion in 2000 alone, but property owners have lost much more.
When individuals own and control property, they have an incentive to use it in a sustainable manner because they can then reap the benefits. History provides numerous examples of individuals and private groups who have protected species through private initiatives — sometimes even while governments were contributing to the species decline. For example,
- When state governments were awarding bounties for killing birds of prey, a concerned citizen helped found the private Hawk Mountain Sanctuary in eastern Pennsylvania to prevent the slaughter of thousands of hawks, falcons, ospreys, eagles, owls and other endangered birds.
- When state governments were awarding bounties for killing seals and sea lions, a for-profit corporation protected the only mainland breeding area for the endangered Steller sea lion.
- While the federal government owns only 4.7 million acres of wetlands and has encouraged the destruction of private wetlands, about 11,000 private duck clubs have managed to protect five to seven million acres of wetlands from destruction.
Expanding the benefits of ownership to the preservation of endangered species habitat could encourage more private conservation efforts. For example, government could offer tax incentives or credits to landowners who create habitat for endangered species on their land. Or, the government could pay bounties to people for every breeding pair of endangered species found to inhabit their property for all or part (in the case of migratory species) of the year.
[page]The “Ownership Society” is a recurring, overarching policy theme of the George W. Bush presidency. The idea behind the ownership society is that the welfare of individuals (and thus the nation) is best served by and directly related to, the ability of people to control their own lives and chart their own course toward goals they have chosen. David Boaz, executive vice president of the Cato Institute, explained the concept thusly: “An ownership society values responsibility, liberty, and property. Individuals are empowered by freeing them from dependence on government handouts and making them owners instead, in control of their own lives and destinies.” 1
“Ownership is a solution to environmental problems.”
The President has promoted ownership as a solution to a variety of public policy issues including health care, housing and retirement. But thus far he has not, at least publicly, extended the ownership society concept to environmental issues. This oversight needs correction. Government programs and policies, some begun over a century ago, have created perverse incentives that are causing environmental harm. By removing these distortions and empowering individuals, we can greatly improve environmental management.
Among the policies that encourage environmental destruction are: agriculture subsidies, subsidized flood insurance and the Endangered Species Act. Each of these policies, enacted with the best of intentions, has routinely resulted in environmental destruction.
Protecting the Environment with Common Law. 2 Building on the British legal tradition, Americans traditionally have used three bodies of the common law (trespass, tort and riparian law) in defense of themselves, their property and the environment surrounding their property. Historically, individuals used laws against trespass, nuisance and common law rulings on water use to stop individual, industrial and even government activities that polluted their land, harmed their livestock, fouled the waters they used and made them sick. Under the common law, even unintentional and non-negligent violations of property rights were sanctioned, and led courts both to award damages to those harmed and to issue injunctions against the harmful activity.
“The common law protected owners’ rights.”
The courts found that injuring someone’s enjoyment of his property creates a cause for recovery regardless of the legitimate social value, reasonableness or utility of the action. For instance, in Hay v. Cohoes Co., 3 the defendants blasted a canal. The blasting tossed rocks onto the plaintiff’s land, depriving him of the safe use of his property. The court held that although the defendants’ activity was a lawful and non-negligent use of their property, they caused a nuisance and a nuisance cannot be allowed, “even for the purpose of lawful trade,” and thus the “offending use had to be barred regardless of the detrimental effects upon industrial development.”
Regulation During the Progressive Era. The common law as a guardian of individual rights and the environment was largely subverted during the Progressive Era. Progressivism and conservationism stood for rationally planned industrial development and nationally coordinated natural resource use. 4 Resources were to be used for the greatest good of the greatest number and where respect for rights interfered with the pursuit of the “general welfare,” rights were to be overridden. In the pursuit of economic growth and increased employment, companies were allowed to pollute air, water and private land to the detriment of the lives and property of individuals and often at the expense of the environment as well.
“Progressive regulations subverted owners’ rights.”
The first generation of federal agencies created to address “environmental” problems arose in the late 19th century during the Progressive Era. In response to environmental destruction and overuse of natural resources and species, they managed public lands and natural resources, such as declining forests and wildlife populations. A second generation of environmental laws and agencies were instituted in the 1960s and 1970s. These responded to environmental problems that are arguably more complex and intractable, but for which the causes and solutions are not readily apparent — like air and water pollution. Arguably, many of these problems were the result of decisions made during the Progressive Era to override the protection of individuals and their property in pursuit of the “general welfare.” 5
The genesis of both generations of environmental laws and agencies was a faulty analysis of the causes, the seriousness of the threats and the range of solutions available to solve the perceived problems.
For instance, the destruction and waste evident in forests in the upper mid-west during the latter part of the 19th century were attributed to foresters’ greed. This is one of the assumptions that led to the “Withdrawal Act of 1891” — seemingly innocent legislation that established the U.S. Forest Service to “scientifically manage” the “nation’s” forests. Ironically, these government policies actually encouraged forest destruction. Under various homestead acts, federal land could only be claimed for farming — so forested lands that weren’t good for crop production or grazing went unclaimed. Though the timber on forested land was valuable, it was considered “unowned” until it was harvested. Had individuals or companies been allowed to claim or purchase land for any productive use on the same basis as those claiming lands for agriculture, the millions of acres now encompassed by the national forest system might have been managed for sustained yield over the long-term, as they have been on private holdings elsewhere in the United States.
Rediscovering the Benefits of Ownership. After more than 100 years of federal management of natural resources and legislative dominance of environmental law, it is time to re-explore the extent to which ownership can improve the environment. 6 History cannot be changed, but policies can be. We need not continue to expand the scope and size of government to fix environmental problems created by previous government “fixes.” Indeed, the Bush administration could boldly apply the ownership society concept to a range of environmental policy issues. This could improve both environmental quality and the government’s finances.
The idea that private ownership of natural resources improves their management is not new. Its intellectual lineage can be traced as far back as Aristotle, who noted in Politics, “What belongs in common to the most people is accorded the least care: they take thought for their own things above all else, and less about things common, or only so much as falls to each individually.” 7 Much later, Locke argued that ownership, tied to property rights, was necessary for individual and social well-being and to restrain government — thus ensuring personal liberty. 8 Today, President Bush has echoed their understanding, saying “. . . if you own something, you have a vital stake in the future of our country. The more ownership there is in America, the more vitality there is in America, and the more people have a vital stake in the future of this country.” 9
“Land owned in common has no protector or defender.”
Garret Hardin provided a modern economic analysis of this point, using the example of herders who share common grazing land. Herders who overgraze commonly owned land get the benefits of doing so. Yet all herders share the cost of the resulting land degradation, whether or not they contributed to its cause. Consequently, herders who overgraze get the full benefit of their actions but bear only part of the cost. On the other hand, herders who resist the temptation to overgraze in order to protect the land bear the immediate cost of their forbearance, but realize only a fraction of the benefits. This is because the benefits of their good behavior (long-term preservation) are shared by all herders, not just those who act so as to preserve the land. Indeed, their selfless actions may have no effect on overgrazing — except to increase the share of the common pasture available to the others. Everyone, therefore, faces perverse incentives to overgraze. To the degree that they act on those incentives, environmental destruction results.
The source of these perverse incentives is lack of ownership. Land that has no owner has no protector or defender. As a result, self-interested behavior may reduce its value. 10
This analysis of the fundamental problem underlying environmental destruction has wide applications. Most of us would not consider dumping trash in our neighbor’s backyard. But since we all have free access to air and water, many of us use them as dumping grounds for all manner of waste. Air, water, public lands and most species of mammals and fish have no clearly defined owners and therefore no protectors or defenders. When people use these resources, they derive private benefits, but collectively share their costs.
Some environmental problems can be solved by making rights and responsibilities explicit. For example, if grazing land is converted from common property to private property, the owners have a personal interest in preserving it from degradation. This interest motivates them to balance current land use against long-term preservation.
Even where strict private property rights cannot be established, either for technological or political reasons, new markets can be created or economic incentives can be brought to bear on the management of the resources in question in order to improve the environment.
[page]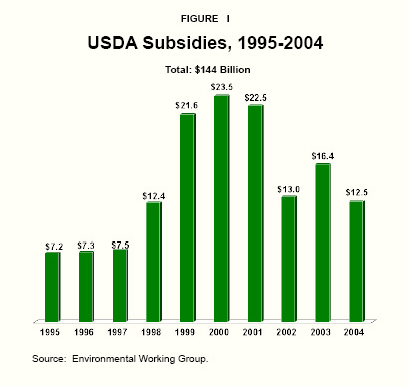
“Subsidies give farmers incentives to overproduce.”
Agriculture has driven America ‘s economic development since the country’s founding, and has a profound impact on the ecology. Farmers cleared the forests, drained the swamps and plowed under the native sod in much of the eastern United States. Although some traditional agricultural practices were environmentally destructive and ecologically unsustainable, for millennia farmers have known to rotate crops to maintain yields, fallow land to prevent soil erosion and move livestock to sustain grazing.
However, when given incentives to do so, farmers and ranchers acting in their economic self-interest will undertake practices that may have negative environmental impacts — abroad as well as in America. Today, government policies create perverse incentives to overproduce crops, convert wetlands and wildlands to agriculture, and intensively use fertilizers and pesticides.
“Farm subsidies totaled $144 billion over the last decade.”
Types of Subsidies and Their Impact. Many of these perverse incentives stem from a myriad of farm subsidy programs that involve direct payments for crop production, subsidized crop and disaster insurance, conservation programs, and so forth. According to the Environmental Working Group, U.S. Department of Agriculture (USDA) farm subsidies totaled more than $143.8 billion from 1995 to 2004. [See Figure I.] 11 Commodity subsidies alone accounted for almost $113.6 billion of the total. 12
Let’s look at some of these programs in detail.
Subsidy Payments and Loans for Crop Production. The federal government subsidizes the production of specific crops through several programs. These include:
- Fixed Direct Payments to producers that do not vary with market prices or current plantings, but rather are based on historical crop yields and acreage. In 2004, farmers received $5.3 billion in direct payments. 13
- Counter-cyclical Payments to producers when the average price of the crop plus the direct payment is less than the targeted price. From 2002 to 2004, farmers received $3.6 billion in counter-cyclical payments. 14
- Marketing Assistance Loans to producers using crops as collateral. If the value of the crop falls below the loan repayment cost, the farmer can simply forfeit the crop as payment. Marketing assistance loans totaled $9.1 billion in 2004. 15
“Farmers responded by increasing production.”
Farmers respond to subsidies by increasing production. They use existing land more intensely, increase inputs of fertilizers and pesticides and/or put more acreage into production. The increased production can severely depress farm commodity prices; but farmers shielded from the effects of low prices by subsidies and tariffs maintain higher production levels.
Thus, for instance, in the five crop years beginning with 1996, worldwide production of grains and seeds exceeded demand by more than 87 million metric tons, according to Daryll E. Ray with the Agricultural Policy Analysis Center at the University of Tennessee-Knoxville. Much of this grain was stored, often at government expense. As a result, he explains, the amount of grain stored from previous years, or carryover stock, increased despite the fact that the prices of most crops dropped by nearly 40 percent! 16
In addition, while soybean prices are their lowest in 10 to 15 years, according to Environmental Media Services (EMS), the U.S. acreage devoted to soybean cultivation increased a million acres or more every year from 1997 to 2001. 17
Similarly, the use of land to produce sugar has expanded. While direct sugar subsidies are relatively small, only about $300 million since 2000, the industry enjoys substantial trade barriers against foreign competitors. The USDA requires sugar importers to pay a 16 percent tariff. 18 As a result, although there was no growth in demand for sugar between 1981 and 1991, U.S. sugarcane production surged by approximately 26 percent. 19 This led to an increase in the land devoted to sugar cane and sugar beet production. The acreage devoted to sugar production in Florida , for example, has grown from 50,000 acres in 1960 to about 500,000 acres today. 20
“The federal government insures farmers against low crop prices.”
Subsidized Crop and Disaster Insurance. The federal government also subsidizes crop insurance and disaster insurance. The Federal Crop Insurance Corporation (FCIC) insures farmers against financial losses due to droughts, floods, hail or other natural disasters and against the risk of crop price fluctuations. The FCIC pays private insurers to administer the program, including paying a portion of the premium for the crops insured.
- In 2003, the FCIC insured over $40 billion worth of crops grown on more than 200 million acres of farmland. 21
- In 2004, crop insurance premiums totaled more than $4 billion, of which the government paid almost 60 percent or $2.5 billion. 22
Despite the availability of crop insurance, not all crops are covered and farmers often do not carry enough insurance to cover their entire potential losses. In addition, more than half of all U.S. farms are livestock operations, but the government has only recently begun to offer pilot programs for livestock insurance (current enrollment is small). As a result, and because Congress has been loath to leave the uninsured in the lurch, Congress has passed four ad hoc disaster assistance measures since 2000, covering six crop years and paying out more than $10 billion in addition to losses covered by FCIC. 23
Irrigation Subsidies. In some parts of the United States , the government sells water “wholesale” from its extensive system of reservoirs to farmers. The water is delivered via pipelines and aqueducts constructed and operated with federal subsidies through the U.S. Department of the Interior’s Bureau of Reclamation (BOR). From 1902 through 1994, BOR constructed 133 irrigation projects, costing $21.8 billion. 24
Federal water authorities sell water for far less than it costs — sometimes for as little as 10 percent of its full cost. Farmers have little incentive to conserve water because they are often charged a flat rate based on the amount of acreage served rather than the amount of water delivered. For example, in 2001, many California farmers were still paying the government $2 to $20 per acre-foot for irrigation water, 25 whereas the national average cost was $32 per acre for groundwater and $41 per acre for off-farm surface water. 26 From 1902 to 1986, irrigation subsidies totaled around $70 billion. 27
Paying Farmers Not to Produce. While some federal subsidies have encouraged overproduction, federal land conservation programs simultaneously attempt to reduce overproduction. Indeed, the USDA oversees at least 17 conservation provisions. Aside from encouraging less production in order to maintain commodity crop prices and prevent supply gluts, a main objective of these programs is to address the environmental impact of farming and ranching. These include soil erosion, conversion of wetlands and other wildlife habitats, and water pollution.
“Farmers are also paid not to plant crops.”
The Conservation Reserve Program (CRP), for instance, provides financial incentives to farmers to remove land from production. This voluntary program involves 10- and 15-year contracts under which farmers receive rental payments and cost-share assistance in exchange for idling eligible cropland and planting long-term, resource-conserving covers on their CRP enrolled acreage. From 1986 to 2004, the federal government paid more than $28 billion to farmers to idle land. 28 In 2004 alone, more than 34.7 million acres were enrolled in the CRP and cost more than $1.8 billion that year. 29
The Wetlands Reserve Program (WRP) was established in the 1990 Farm Bill to encourage farmers to stop cultivating and instead restore some wetlands to their natural state. As of 2004, 8,396 projects, totaling more than 1.6 million acres were enrolled in the WRP, at a cost of approximately $1,470 per acre. 30 In 2005 alone, the federal government allocated $239,723,633 to the states for the WRP. 31
While these programs have removed some acreage from agricultural production, there is evidence that many farmers put previously undeveloped lands into production to replace acreage set aside under the CRP and the WRP. In fact, a University of Minnesota geographer studying the effects of CRP on the Great Plains discovered that although regional farmers received payments to remove 17 million acres from production, total cultivated land fell by only 2 million acres. He concluded that “for every eroding acre a farmer idles, another farmer — or sometimes the same one — simply plows up nearly as much additional erosion-prone land.” 32
Further evidence that federal programs to limit farmland usage have been ineffective comes from the USDA, which found that despite idling 36 million acres of farmland, the $28 billion CRP has not abated crop production. 33
Environmental Costs. These subsidy programs entail environmental costs by encouraging actions that harm the environment.
Pesticide and Fertilizer Runoff. Subsidies not only lead to the destruction of habitats as wildlands are converted to agriculture, but also encourage greater use of pesticides and fertilizers, which run off into lakes, rivers and streams.
In 1999, the U.S. Geological Survey reported that more than 90 percent of water and fish sampled from streams and about 50 percent of all sampled wells contained one or more pesticides. 34 In 1999, the EPA estimated that physicians diagnose 10,000 to 20,000 pesticide-related illnesses and injuries every year on farms nationwide. 35 And in 2002, according to the Heinz Center , an environmental research institute, at least 83 percent of the streams sampled in farm areas contain at least one pesticide at concentrations exceeding federal guidelines for protecting wildlife. 36
“Farm subsidies encourage intensive fertilizer and pesticide use.”
High concentrations of chemicals found in fertilizers, such as phosphorus and nitrogen, arguably affect wildlife and ecosystems. Nitrogen and phosphorous fertilizers have been cited as contributing factors in destructive algal blooms in lakes, estuaries and oceans. The process, also known as eutrophication, occurs when algae, boosted by excess nutrients, grows excessively, lowering the oxygen content in water and creating dead zones where few organisms can survive. According to scientists, fertilizer runoff from the Mississippi River contributes to the 7,000-square-mile dead zone that appears every summer in the Gulf of Mexico off the coasts of Louisiana and Texas . 37 And researchers at the Heinz Center found that some 10 percent of tested streams and 20 percent of groundwater wells in rural areas exceed federal drinking water standards for nitrate. 38
Eliminating farm subsidies would greatly reduce this impact. For example: 39
- Cutting agricultural subsidies in half would result in a 17 percent reduction in pesticide use and a 14 percent decrease in fertilizer use, according to estimates by Jonathan Tolman of the Competitive Enterprise Institute based on data from six farming states.
- Removing all subsidies would result in a 35 percent reduction in total chemical use, including insecticides and herbicides, per acre and a 29 percent reduction in fertilizer use per acre, says Tolman.
Environmental damage from agriculture often means added costs for taxpayers. For instance, contaminated waterways in the Everglades, largely attributed to fertilizer use stemming from sugar farming, led to a massive restoration effort that will cost taxpayers an estimated $7.8 billion over 30 years.
Wetlands Lost. As previously discussed, subsidies encourage farmers to cultivate as many acres as possible, often at the expense of wetlands. From 1986 to 1997, the conterminous United States experienced a net loss of 644,000 acres of wetlands, according to a report by the U.S. Fish and Wildlife Service (USFWS). 40 While wetland losses have slowed in recent years and there are other causes of wetland depletion, the draining of wetlands for agricultural use continues to be the leading cause of wetland loss.
According to the U.S. Department of the Interior and the USFWS, wetland conversion for agricultural use is responsible for 87 percent of all wetland losses from the 1950s to the 1970s, 54 percent of wetland loss from the 1970s through the 1980s, and 49 percent of wetlands lost from 1986 to 1997. 41
“Water use is subsidized.”
Damage to Rivers and Streams. Subsidized irrigation has had dramatic effects on California ‘s coastal environment. California ‘s Trinity River has experienced a 60 percent to 80 percent decline in fish populations because over half of its water is diverted for agricultural irrigation. The construction of the Friant Dam has dried out 40 miles of the San Joaquin River , which once had a productive salmon fishery. The San Francisco Bay-Delta has also suffered from excessive water diversion for agriculture in California . The populations of many species in the San Francisco Bay-Delta ecosystem have reached record low numbers — including the endangered Delta smelt, young striped bass, threadfin shad and copepods. 42 The CALFED Bay-Delta Program has spent almost $3 billion since 1995 to restore the ecological health of the Bay and Delta, to improve water supply reliability and water quality and to stabilize the levee system. 43
Cost to Consumers . Government subsidies for agricultural production also raise retail prices. Sugar is a prominent example. Sugar subsidies include price supports to producers and import-tariff quotas to limit the importation of foreign sugar. U.S. consumers pay up to three times the price of sugar sold on the world market. As of October 2002, Americans paid 22 cents a pound for sugar when the world price was 7 cents. 44 The GAO estimates that every year consumers spend $2 billion more on sugary-foods than they would have without government intervention in the sugar industry. 45
Industries using sugar are also affected. Over the last 35 years, U.S. candy manufacturers have moved to Canada , Mexico and elsewhere.
- Since 1970, sugar industry employment in Chicago — America ‘s “candy capital” — has nearly been cut in half. 46
- In 2003, Brach’s announced the closure of one of its Chicago plants, laying off some 1,000 workers; 47 that same year, Kraft Foods Inc. moved its Life Savers plant from Michigan to Canada , costing another 600 jobs. 48
“Subsidies raise food prices.”
Consumers also pay dearly for dairy subsidies. For example, the USDA’s Economic Research Service estimates that this subsidy program increases the cost of fluid milk by 14 percent — equaling $2.7 billion paid in higher prices every year. 49 Jerry Kozak, CEO of the National Milk Producers Federation, says current milk policy raises milk prices as much as 20 cents per gallon. 50
Subsidies have an especially pernicious effect on the poor, who spend a relatively greater proportion of their income on food.
Effects on Family Farmers. Ostensibly, farm subsidies are meant to help the family farm, but in practice, they are funneled to the wealthiest and largest producers. For example:
- The top 10 percent of recipients received 72 percent of all farm subsidies — most of these producers make more than $250,000 annually.
- By contrast, smaller farms received little help — the bottom 80 percent of farmers received only $64 a month.
The federal government admits that agricultural programs often lack sufficient oversight to prevent fraud and abuse. For instance, the Government Accountability Office (GAO) determined that 30 percent of the recipients it sampled did not qualify for subsidies they received. 51
“Farmers in developing countries can’t compete with subsidized exports.”
Effect of U.S. Agriculture Subsidies on Developing Countries. Agricultural trade barriers in the form of import tariffs and quotas on imports are a form of subsidy because they artificially raise domestic prices. Subsidies and trade barriers also affect developing nations. Intensive production in developed countries has led to falling world prices for agricultural commodities. Farmers in developing countries are particularly devastated and are often driven out of their local markets, unable to compete with the cheaper, subsidized goods. According to the Global Policy Forum, the value of African food exports would double if the United States and Europe removed farm subsidies. 52
Using the most recently available USDA and Organization for Economic Cooperation and Development (OECD) data, the Institute for Agriculture and Trade Policy calculated the price of U.S. agriculture exports in 2003, compared to average costs for their production. 53 The Institute found that:
- Soybean and corn export prices are 10 percent below the cost of production.
- Rice is exported at an average price 26 percent below cost.
- Wheat is exported at a price 28 percent below cost.
- Cotton is exported at a price 47 percent below cost.
Developing countries have trouble coping with the effect of farm subsidies. For many African nations, for instance, U.S. subsidies are many times greater than their national income. 54
Even though developing nations have a comparative advantage in many agricultural products, American subsidies depress these industries. According to the World Bank, if the United States ended its cotton subsidies, West and Central African farmers would gain $250 million a year in revenue. 55 In addition, removing U.S. sugar price supports and quotas would increase world prices 17 percent, boosting developing nations’ export revenue by $1.5 billion annually, 56 but causing “negligible increases in U.S. prices for corn, wheat and soybeans.” 57
Of course, removing farm subsidies and liberalizing trade would not just benefit developing nations — helping our trade partners helps America too. The International Monetary Fund (IMF) estimates that by eliminating all of these programs, rich countries would raise global welfare $100 billion — 92 percent of the benefit of which they would receive. 58
“The Freedom to Farm Act capped subsidies — temporarily.”
Reforming Farm Programs . In 1996, Congress undertook an ultimately failed attempt to wean (some) farmers off of government assistance by passing the Freedom to Farm Act. Under the Act, federal crop price support payments were temporarily capped and federal authority to withhold land from production ended. Farmers planting select subsidized crops received fixed but declining payments for their crops, regardless of the amount produced, over the course of seven years.
Unfortunately, Freedom to Farm did not cut subsidies for a number of crops or for dairy products. In addition, before the ink on the bill was barely dry, Congress approved supplemental farm payments to make up for low farm prices. In 1998, demand for U.S. farm exports dropped rapidly and Congress responded by passing several bailout laws to temporarily boost farm subsidies; the same ones the 1996 act tried to phase out. And, in typical Washington fashion, Congress and the administration left the hard choices to future legislators since, absent congressional action — which did not occur — the old farm policies, including subsidy payments and land set-asides — reemerged in 2002 when the program lapsed.
The most recent farm bill, the Farm Security and Rural Investment Act of 2002, was expected to cost taxpayers $180 billion over 10 years. 59 So far, according to the Office of Management and Budget (OMB), the 2002 Farm Bill has provided $176 billion in farm-related assistance, which is a 74 percent increase over what the previous Farm Bill would have provided in the absence of any additional emergency assistance. 60
Bringing Ownership to the Farm. Under the present system, agricultural producers bear only a portion of the economic and environmental costs of their decisions. As detailed above, subsidies encourage the overuse of water, pesticides and fertilizer, and the conversion of wetlands to crop production. Yet it is the public that suffers from higher food prices, fouled water, and fewer wetlands and wildlands. A different policy could benefit both farmers and the public. If farmers bore the full costs of their choices with regard to the amount of acreage farmed, the crops planted and the intensity of chemical and water use, they would likely reduce their use agricultural inputs, and some might even go into other lines of work where incomes are higher. Higher crop prices and increased agricultural trade would likely result. Bringing the ownership society concept to farm policy could reduce environmental harms, the economic misallocation of resources and improve the fortunes of the poorest of the poor in developing countries. The reasons for such a change are obvious; the question is how to get from here to there.
Freedom to Farm was a good starting point, but Congress and the administration need to go farther to bring the full individual and social benefits of ownership to agricultural policy — and this time they need to stick to their guns with no halfway measures. They need to implement comprehensive reform with no crops or areas of policy left out of the mix.
“Subsidies should be phased out.”
Freedom to Farm II. In order to ease the transition from the current state of political dependency in the agricultural community, any reform plan would have to be undertaken over a period of time. The more comprehensive the reform, arguably, the longer the time period — keeping in mind that the longer the phase-out period for market distorting protectionist measures, the longer the problematic results fostered by current farm programs will remain.
Over perhaps a 10-year period, an ownership-focused agricultural policy could simultaneously: end all direct and indirect agricultural payments, end subsidized water delivery, remove tariffs and end federal mandates or limits on the amount of acreage that can be used and types and amount of crops that can be grown. Under this proposal, each farmer currently receiving crop payments would receive a flat but declining grant of money each year, with the initial payment equaling the amount of subsidy received on average over the previous five years. The subsidy payment would decline 10 percent each year. Over the same 10-year period, water prices would be increased and import tariffs and export subsidies reduced so that at the end of the 10 years, U.S. borders would be completely open to foreign agricultural products and the price paid for water would equal the market rate — farmers would be competing on an equal basis with industrial and residential water users.
Fixed but declining payments may result in higher payments in some years — those with higher than average crop prices — than the producer would have received under the current system. It also provides a certainty of payment which would allow farmers to plan financially — they will know in advance for 10 years how much they can expect to receive from the federal government. In order to garner political buy-in from the agricultural community, the subsidies should be paid regardless of whether those receiving payments continue to produce the crops for which the subsidies are being paid, or switch to other crops with higher market prices or plant crops at all. Some producers may choose to plant nothing at all, which may offend some who, rightly, object to paying something for nothing — an agricultural windfall, so to speak. However, farmers are likely to plant nothing only if they reasonably expected crop prices in a particular year to fall below their cost of production — otherwise, they can make a profit on the crops and take the federal payment. If a number of farmers expect their costs to be higher than their revenues in a particular year and decide not to plant, the lower production should increase the prices received for those who deliver products to the market. In any case, the environment would benefit from the land being left fallow, and taxpayers should be no worse since, in such years, they would likely have paid more in subsidies. And in the long run, the benefits to consumers, the environment and the federal budget from ending farm subsidies would far exceed any short-term windfall gain to agricultural producers.
Overtime, this policy should encourage the implementation of more efficient, less wasteful irrigation systems on farms and a more focused application of pesticides and fertilizers. At the same time, it should reduce the amount of acres devoted to farming since, as prices decline, less efficient farmers will devote their resources to other pursuits.
[page]“Property owners should be responsible for their bad decisions.”
When people own property and are fully responsible for losses due to their poor land use or development decisions, they are less likely to build or rebuild in areas regularly prone to flooding or erosion. This link — between a person’s ownership of property and responsibility for their land-use decisions — disciplines people who use their property badly.
Unfortunately, a host of government programs break this link by subsidizing unwise housing and commercial development decisions. All too often the result is lost lives, destroyed property and livelihoods, and environmental destruction. The U.S. Army Corps of Engineers (Corps) flood control program, federal flood insurance and Corps beach replenishment projects subsidize construction in flood-prone areas, encourage high-risk development and harm environmentally sensitive areas.
Environmental Impacts of Coastal and Floodplain Development. Many species are dependent upon floodplains and coastal wetlands or marshes for their survival. Indeed, according to the USFWS, up to 43 percent of federally threatened and endangered species rely on wetlands for survival. Aside from habitat, wetlands provide other important environmental services. They improve water quality through filtration and often provide the same level of flood control as expensive dredge operations and levees. For instance:
- The Congaree Bottomland Hardwood Swamp in South Carolina eliminates the need for a $5 million wastewater treatment plant. 61
- In Georgia, researchers found a 2,500 acre wetland saves $1 million in water pollution abatement costs annually. 62
- Replacing the natural flood control function of 5,000 acres of wetlands in Minnesota would cost $1.5 million annually. 63
- The Corps found protecting wetlands along the Charles River in Boston , Mass. , reduced potential flood damage by $17 million. 64
“Subsidized coastal development causes pollution and destroys wetlands.”
As discussed in the previous section, conversion to agriculture has historically been responsible for the decline in wetlands. Recently, however, wetland losses to agricultural development have declined while commercial and residential development in floodplains and along the coasts have increased. As a result, today, less than half of the original 220 million acres of wetlands in the United States remain. And the environmental results of this development have been devastating.
Along the coasts, commercial and residential development — including sewage overflow and untreated runoff of chemicals from roads and lawns — have contributed to the decline in oyster beds, sea grasses and other flora and fauna dependent upon unpolluted water. For instance, coastal development and its associated pollution in the three-state Chesapeake Bay region has resulted in:
- A loss of 58 percent of its historic wetlands,
- A loss of 88 percent of its historic underwater grasslands,
- A historic low in the Bay’s crab harvest and in crab reproductive rates,
- A 98 percent decline in Bay oyster production, and
- An increasing number of fish advisories. 65
Other areas report similar environmental impacts related to increased coastal development — much of which is encouraged by subsidies. 66 Many people are beginning to object to the subsidized destruction of these valuable natural areas. 67
A Brief History of U.S. Flood Control Policy. Prior to 1917, flood control was entirely each state’s responsibility. By 1929, the federal government had assumed a major role after several devastating floods revealed a lack of coordination between states sharing borders and rivers. These issues concerned the appropriate location of flood control measures, engineering standards and flood response. For example: 68
- A 1913 flood in the Ohio River Valley caused $200 million in property losses and killed 415 people.
- The Great Mississippi Flood of 1927 showed the limits of the combined efforts of the Corps and state agencies to control flooding through the use of levees alone. Levees were breached, almost 13 million acres were flooded, 250 to 500 people were killed and 700,000 were left homeless. Property damage exceeded $236 million.
The federal government began assuming responsibility for flood control with the 1917 Flood Control Act, which called for a comprehensive flood control program for the lower Mississippi and Sacramento Rivers . Federal flood control efforts under the Corps have expanded ever since.
In 1929, the private insurance industry abandoned coverage of flood losses. 69 And in 1934, federal disaster relief was made available to victims of all natural disasters, including floods — this relief has at various times included low-interest or no-interest loans and outright grants or gifts of money, housing, food, etc.
“Flood control subsidizes floodplain development.”
The Flood Control Act of 1936 created the first truly national flood control program. It called for the construction of about 250 projects using funds for work relief. Funding for initial construction was set at $310 million and $10 million was appropriated to complete examinations and surveys. 70 The Act also addressed the growing desire to reduce flood damage by instructing the USDA to develop plans to reduce runoff from agriculture and the U.S. Army Corps of Engineers to develop engineering plans for downstream projects.
By 1942, with the release of Gilbert F. White’s Human Adjustment to Floods: A Geographical Approach to the Flood Problem in the United States , 71 it was already becoming apparent that flood control efforts were exacerbating rather than reducing the human and economic toll from floods. White describes the nation’s flood policy as “essentially one of protecting the occupants of floodplains against floods, of aiding them when they suffer flood losses, and of encouraging more intensive use of floodplains.” Interestingly, White’s findings echoed earlier arguments by W. J. McGee, who wrote in 1891 that “as population has increased, men have not only failed to devise means for suppressing or for escaping this evil [flood], but have in a singular shortsightedness, rushed into its chosen path.” 72
A 1958 study by Gilbert White and colleagues on the correlation between land use and floods, explained how the demand for land use and the lack of incentives to stay out of flood-prone areas caused the occupancy of these flood zones to increase. 73 Furthermore, they reported, federal incentives created a perception that the federal government would take care of any flood hazard.
This is especially true of Corps program. The Corps approves and regulates the construction of levees and other flood control structures. From 1928 through 2001, it spent $123 billion (adjusted for inflation) on flood control projects nationwide. 74 The federal government pays 65 percent of these projects’ costs, while state and local taxpayers are responsible for the balance. These projects not only encourage continued development in flood-prone areas, but also bolster the Corps’ annual demand for larger budgets. Indeed, according to the Association of State Floodplain Managers, new developments in designated at-risk flood areas reinforce the economic justification for new Corps projects.
Corps flood control projects all too often undermine the incentive to purchase flood insurance (more about this below), since the presence of levees and other flood control devices often eliminates federal and state requirements that the property’s owners purchase flood insurance.
However, flood control structures do not guarantee protection. For example, the 1993 Great Midwest Flood caused $20 billion in damages when more than 1,000 levees failed and 100,000 homes were damaged. 75 But instead of responding with better policies and nonstructural solutions, the Corps continues to subsidize 100 percent of repair costs for all damaged levees it constructs and 80 percent of repair costs for nonfederal projects. 76
“Flood insurance subsidizes rebuilding in floodplains.”
Federal Flood Insurance: Adding Water to the Torrent of Bad Flood Policy. Talk of a national flood insurance program began in the 1950s after significant flooding in Kansas and Missouri caused more then $870 million in damage. 77 Concerned about the rising cost to taxpayers for disaster relief and the increasing amount of damage from floods, both President Harry Truman and President Dwight Eisenhower recommended legislation for a national flood insurance program. However, it was not until President Lyndon Johnson submitted a feasibility study of flood insurance in 1966 that the idea really took off.
In recognition of growing flood losses, the National Flood Insurance Program (NFIP), administered by the Federal Emergency Management Agency (FEMA), was established in 1968 to insure private property at risk of flooding. The NFIP provides flood insurance to residents in communities that meet minimum NFIP requirements and adopt and enforce floodplain management criteria. In return, the NFIP is responsible for identifying local flood-hazard areas and establishing actuarial rates. Structures already located in floodplains pay subsidized premiums while structures built following enactment are supposed to pay actuarially-based premiums.
However, by 1970 only four communities had joined the NFIP, and only 16 policies had been sold. By 1972, when Hurricane Agnes struck the East coast, only 1,200 communities participated in the NFIP, which had issued only 95,000 policies. Thus, less than 1 percent of insurable damages were covered — there were $400 million in damages, but only $5 million was paid in flood claims.
Disaster relief was supposed to be denied to anyone who had the opportunity to purchase flood insurance for a year or more but did not do so. Of course, the absence of coverage did not mean that those affected did not receive federal aid. Millions were paid out in disaster relief to those who had not purchased flood insurance. While this helped them rebuild their lives and communities, it also undermined the incentive to purchase the insurance.
To boost participation, the NFIP’s subsidized rates for flood insurance were lowered 37 percent in 1972. In 1974 they were lowered twice more. The NFIP estimated there were about 13,600 flood-prone communities in the United States at the time, but only about 2,850 communities participated, and there were only about 312,000 individual policyholders.
This 37-year-old program has arguably outgrown its original purpose, which was to provide temporary flood insurance to property owners who were unaware they were in flood-prone areas. As early as 1973, government reports noted two perverse effects of the flood insurance program: 78 1) federal disaster relief replaced rather than supplemented nonfederal efforts; and 2) disaster relief was often perceived to be so generous that “individuals, business and communities had little incentive to take initiatives to reduce personal and local hazards.”
“Flood insurance pays claims for repeated flooding.”
Indeed, federally subsidized flood insurance encourages people to build homes where they otherwise would not. It encourages lenders to finance mortgages they otherwise would not. Today, NFIP covers more than 4.5 million homes in more than 20,000 communities. 79 But because of full-disclosure mortgage and insurance requirements, most of those currently insured were aware of their area’s flood problems when they purchased or developed their properties.
In 1976, the General Accounting Office (GAO) found that the Federal Insurance Administration still has “not established an effective system for monitoring community efforts to adopt and enforce required floodplain management regulations.” Consequently, the federal government, “though heavily subsidizing the flood insurance program … had no assurance that the communities’ flood-prone lands were being developed wisely to prevent or minimize future flood losses.” 80
The NFIP continues to pay claims for homes damaged or destroyed by floods, mudslides and other natural disasters without requiring homeowners to relocate. They can use the money to rebuild in the same location, and their new home is also eligible for NFIP coverage. According to FEMA, repetitive claims are the most significant factor in increasing flood insurance costs.
- NFIP pays claims averaging $200 million per year for about 40,000 repetitively flooded properties. 81
- Since its creation in 1968, the NFIP has paid out nearly $1 billion for more than 10,000 properties that have experienced two or more losses, with cumulative claims often exceeding the value of the property. 82
Encouraging Development in At-Risk Areas. The Government Accountability Office reports that 90 percent of all natural disasters involve flooding. 83 Although they are called “natural” disasters, many would not be nearly as destructive had people and property not been placed in harm’s way.
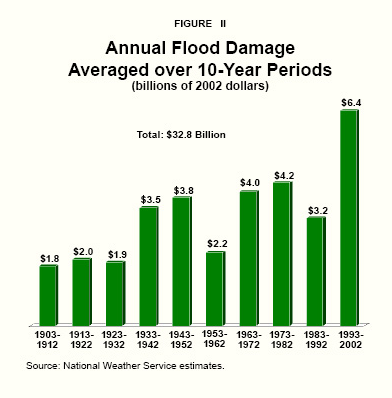
- Flood damage costs increased from an average of $2.6 billion per year (in 2002 dollars) during the first half of the 20th century to more than $6 billion per year in the past 10 years. 84 [See Figure II.]
- In 2004 alone, FEMA received 1.3 million applications for federal disaster assistance due to hurricanes and tropical storms — far exceeding the number for any comparable past period. 85
The National Climactic Data Center says that increased population and development of coastal areas is responsible for the increase in losses due to hurricanes. 86 According to the 2000 U.S. Census, more than half of Americans live within 50 miles of a coast and by 2025, 75 percent will. 87 Indeed, the Heinz Center determined that in the absence of insurance and flood control programs, development density in areas at high risk of flooding would be about 25 percent less than in low-risk areas. 88
“Flood losses have increased with development.”
Subsidizing the Rich. More than 70 percent of the coastline in the lower 48 states is privately owned. 89 State and local governments own most of the rest. Homes with beach access or an ocean view are highly valued and often owned by the rich. Thus flood insurance, beach erosion control and disaster loans often subsidize higher income homeowners. According to the Heinz Center : 90
- The risk of erosion to property — such as homes on hillsides, river banks and beachfronts — is comparable to the risk from flooding.
- Nationwide, erosion causes property losses of approximately $500 million per year.
- Over the next 60 years, coastal erosion may claim 25 percent of buildings within 500 feet of the U.S. shoreline, including 87,000 homes. Disasters like Hurricane Katrina could claim many, many more.
U.S. Army Corps of Engineers’ projects attempt to reduce damage to coastal properties caused by shore erosion, hurricanes and floods, making it arguably the largest contributor to coastal development. For instance, beach rebuilding has become the fastest growing area of work for the Corps, with federal taxpayers subsidizing 65 percent of the cost. 91
“Beach restoration is costly and encourages more development.”
Replenishing beaches is an expensive, temporary solution to natural erosion. Over the 50-year life of the typical project, each mile of beach must be replenished every four years at a cost of more than $1 million per mile. 92 As of 2001, the Corps had spent more than $1.2 billion on 71 large shoreline protection projects, affecting 284 miles of the nation’s 2,700 miles of “critical-erosion” coastline. 93
Private property owners and state governments benefit from Corps-funded beach replenishment. For example: 94
- The Corps has begun a $10 million project to replenish two miles of beach on Captiva Island , Florida , although public access is essentially blocked by the South Seas Plantation, a privately-guarded, gated community.
- On North Carolina’s scenic Outer Banks, the Corps is committing to spend $1.8 billion to replenish and maintain 14.2 miles of beach for the next 50 years.
- The Corps paid New Jersey more than $16 million for beach projects in 2003, and the state is currently seeking to widen all 127 miles of coastline, which could cost $9 billion over the next 40 years.
Arguably, projects to reduce coastal erosion should be funded by the states, communities and businesses that directly benefit, not federal taxpayers.
Reforming Flood Insurance and Disaster Assistance. Applying the ownership society ideal to these programs would require ending them. This would still allow the owners of the property involved to develop their property as they see fit, but it would have the added benefit of ensuring that they, rather than the general public, were responsible for any poor development decisions. Since the costs of making bad decisions are substantial, under the “ownership” regime of disaster response, we should expect fewer of them.
Government programs should neither subsidize those who choose to live in harm’s way, nor encourage environmental destruction — but those are the results of NFIP, FEMA rebuilding loans and Corps beach restoration projects. Any development in high-risk areas should reflect its actual cost to the public and the environment and should be borne solely by the states, localities and individuals benefiting from them. Ending subsidies to development in high-risk areas would reduce the economic, human and environmental toll of natural disasters.
“Government programs subsidize environmental destruction.”
Expanding the ownership society ideal to government disaster relief programs could be done in stages and need only modify emergency relief efforts, rather than end them. It is highly unlikely that Americans will ever turn their backs on those in temporary need due to a natural disaster. However, such relief efforts should at most provide funds for temporary housing, food and other essentials, should be time-limited by statute so that they do not become open-ended welfare benefits and should not extend to rebuilding the homes or businesses of those affected. The knowledge that emergency relief efforts are time-limited and do not extend to rebuilding permanent structures or attendant equipment and furnishings would provide individuals with incentives to purchase insurance against such contingencies in the private market.
Flood insurance should be left to the private market entirely. The government should allow private insurers and mortgage lenders to set the terms and rates for flood insurance. Currently, there are few private companies offering flood insurance outside of the government subsidized and regulated program. Under the NFIP, private insurers and brokers market flood insurance but the government is on the hook for claims. In addition, the government sets rates, coverage limitations and eligibility requirements.
As a beginning, the government should not enroll any new homes or businesses in federally-backed flood insurance, and it should stop offering below-cost insurance rates. When disasters occur, payouts should be limited to the value of the home or business at the time the “ownership” insurance regime is implemented. Absent this provision, the government’s payout for flood and other disaster claims will grow with the value of insured properties and property owners will have little or no incentive to forgo rebuilding or to make anti-flood improvements. Freezing payouts would undercut the incentive to rebuild or begin new construction in high-risk areas. At the very least, it would encourage the development of a supplemental insurance market to cover the gap between the limited federal payout and the rebuilding cost at the time of any particular disaster.
Finally, the cost of beach replenishment and other federal erosion control projects should be borne by the states or property owners who own the property abutting the beach, except where federal properties are at risk. Beachfront property owners bought or, in the case of the state, claim ownership of the at-risk area, and it is they who benefit from both the amenities and the value (property value) it provides.
[page]“Wild animals and plants are owned in common.”
Lack of ownership of wild animals has limited the effectiveness of species conservation efforts. In the United States, land is owned either by individuals or groups as private property or by government as de facto trustee of society’s commonly-owned resources. Ownership is essentially the right to use and control a resource. But federal and state laws treat all wild species as publicly owned and only recognize private ownership of rare and endangered wild native species in very limited circumstances. In the vast majority of cases, owners of land upon which wild animals live, feed or breed do not own the animals themselves and their right to manage them is limited by the government. The use of most wild species is regulated by individual state governments to varying degrees of stringency, though in the case of migratory species, and those considered at-risk of extinction, the federal government takes the lead role in their management and their use is highly regulated.
“The government controls privately-owned habitats of endangered species.”
The Regulatory Approach. The Endangered Species Act (ESA), administered primarily by the Department of the Interior’s Fish and Wildlife Service (USFWS), is widely considered the most powerful environmental law in the nation. It was enacted in 1973 and, as written, takes precedence over all other laws. The ESA requires the Secretary of the Interior to protect each endangered species, regardless of the costs, by formulating and implementing specific plans to protect its habitat and to recover sufficient numbers of the species so that it is no longer considered threatened with extinction. It also requires all federal agencies to ensure their actions do not harm threatened or endangered species — even if, in order to prevent harm to a species, they are unable to carry out their primary responsibilities under other laws. Despite its name, some of the populations protected by the ESA do not meet a scientific definition of species, but include murky categories, like subspecies, and distinct geographic populations of animals that may be abundant elsewhere, or that can and sometimes do interbreed with closely related populations. Individuals or groups can petition to have a species, subspecies or distinct geographic populations of a species listed as threatened or endangered, and then present evidence backing their petition to the Secretary, who must then decide whether the evidence provided is sufficient to merit listing the species.

“The Endangered Species Act (ESA) hasn’t saved any species.”
Need for Change: Failure to Protect Species. For all its power, the ESA has not worked well. Since 1973, 1,832 species have been listed as either endangered — which means the population is in danger of extinction — or threatened, which means their numbers are declining and the species is likely to become endangered. Only 40 of the listed populations were delisted by the end of 2004. Even counting all of the delistings as “successes,” they are only 2 percent of the species ever listed. A more careful examination of the facts shows that even 2 percent is far too optimistic. Of the 40 species delisted:
- 9 were delisted due to extinction.
- 16 were delisted because of “data errors” — they either were undercounted when added to the list or were later determined not to be distinct species (or subspecies).
- 3 were decimated by a pesticide, DDT, and recovered largely due to the 1972 DDT ban.
- 12 remaining species were conserved by state agencies or private organizations, or were foreign species conserved by foreign governments under their own laws — the federal government contributed very little to the recovery of any of these species. [See Figure III.]
- None of the 40 species was delisted after successful recovery attributable to ESA protection.
That the ESA has failed to protect species should surprise no one. Species recovery requires protecting critical habitats where they live and breed. More than 75 percent of the listed species depend on private land for all or part of their habitat. 95 Indeed, the continued survival of many endangered species literally rests with American property owners. Unfortunately, landowners are penalized by the presence of a protected animal on their land. Under current law, if a person’s property provides suitable habitat for an endangered species, that land potentially becomes subject to severe restrictions on its use. In fact, an owner may not be able to use his or her property in any way, and may, in some cases, even be barred from setting foot on all or part of it — which amounts to outright confiscation. These uncompensated “takings” leave a landowner three options: kill an endangered species member, destroy species habitat or lose much of the use and value of his land. By undermining ownership and the incentives ownership provides, the ESA actually discourages people from fostering species recovery.
“The ESA imposes costs on landowners and taxpayers.”
Need for Change: The Cost of ESA. While the ESA has failed to help species recover, it has succeeded in spending taxpayer dollars. The lowest government estimate for total spending up to 1994 on the recovery of all currently known endangered species was $4.6 billion, but this estimate is misleading because it only included costs for government recovery from select agencies. 96 In 2000 alone, it is estimated that more than $2.4 billion of federal expenditures were related to endangered species.
Even these estimates are low. Northern spotted owl recovery alone has cost an estimated $21 billion to $46 billion. And dozens of species upon which much more money has been spent have not been delisted. Millions of dollars have been spent on species that were wrongly listed — like the Tumamoc Globeberry, a gourd in Southern Arizona .
For every dollar it spends on the recovery of protected species, the government spends more than $2.26 on the consulting and listing process to achieve protected status. Individuals and firms fighting government efforts in court or developing and implementing habitat conservation plans spend still more. Thus, the true cost of the ESA is hard to estimate; in addition to billions of federal dollars spent, state governments and the private sector have spent tens of billions more, but there is no common system of accounting for their costs.
Indirect Costs to Life and Property. The indirect costs in lost jobs and wages, delayed and halted development, increased construction costs and difficult-to-measure social costs, are much greater. The true costs of ESA failures should be measured in houses, homeless shelters and hospitals not built or significantly delayed, medical and technological discoveries not advanced, funds not available for education, crime control and other health, safety and environmental concerns, including species lost or still declining.
In one instance, massive brush fires in California destroyed 29 homes and caused millions of dollars in damage. 97 Several of the homes were lost because the USFWS denied homeowners permission to destroy brush and weeds by plowing firebreaks. The USFWS threatened homeowners with imprisonment and huge fines in order to protect the endangered Stephens kangaroo rat. Some homeowners ignored USFWS threats; their homes are still standing. Ironically, the fires destroyed kangaroo rat burrows and habitat.
“The ESA imposes even greater indirect costs.”
In another case, one day before San Bernadino and Riverside Counties in California were to break ground on a new hospital, the USFWS listed the Delhi Sands flower-loving fly as endangered. Eight Delhi flies were found on the hospital site and the USFWS threatened to prosecute the counties if they built the hospital as planned. According to Ike Sugg, a wildlife specialist at the Competitive Enterprise Institute, while the counties and the USFWS have been negotiating:
- Hospital construction has been delayed for more than a year.
- The counties have spent more than $4.5 million dollars — more than half-a-million per fly to study threats to the fly and how to prevent harming it while still completing the hospital and its attendant infrastructure — and may spend millions more to establish a fly preserve.
- At one time a USFWS official even demanded that Interstate 10, an eight-lane freeway adjacent to the hospital site, be shut down or slowed to 15 miles an hour during the two months of the fly’s above-ground lifespan.
Improving the Endangered Species Act. A number of changes have been proposed to the ESA. These include provisions to improve the scientific basis for listing decisions — such as requiring that listing decisions are based on sound science, with thorough, peer-reviewed data to justify listing decisions.
“The ESA encourages landowners to destroy habitat and kill endangered species.”
Proposals have also been offered to limit the listing of “distinct population segments” to those of national interest as determined by Congress, and to allow captively bred and privately owned populations of animals to be counted toward species’ numbers. Under this proposal, the ESA would not limit the use of members of an endangered species that were privately owned before the species was listed. For example, zoo owned and bred grizzly bears could be transferred to other parties or destroyed if necessary without first getting USFWS permission.
Proposals have also been offered to speed the recovery and habitat conservation planning process. Any of these efforts would improve the current act, but none of them gets at the heart of the problem: the perverse incentives the ESA creates to destroy species and their habitat in order to avoid having one’s property come under onerous use restrictions.
Under the current act, if people provide suitable habitat for an endangered species, their land becomes subject to severe regulation, even confiscation. As a former USFWS official stated: “The incentives are wrong here. If I have a rare metal on my property, its value goes up. But if a rare bird occupies the land, its value disappears. We’ve got to turn it around to make the landowner want to have the bird on his property.”
Even Michael Bean of the Environmental Defense Fund recently acknowledged that “increasing evidence suggests that at least some private land owners are actively managing their land so as to avoid potential endangered species problems…by avoiding having endangered species on their property.” Bean admitted that this was not the result of a desire to harm the species or the environment, but rather a rational response to the incentives in the current act. 98
An Ownership Approach. Based upon its record of costly failure, the best policy might be to end the federal government’s role in endangered species protection entirely. In the current legislative environment this is unlikely, but the current act could be improved, in part, by applying the ownership ideal to species protection.
“Landowners should be compensated for environmental takings.”
Ownership and Endangered Species: Baby Steps. At a minimum, reducing the threat to peoples’ property from endangered species is a necessary first step to instilling the certainty that ownership provides — and thus, reducing the enmity that many property owners feel toward endangered species. The Fifth Amendment to the Constitution prohibits the taking of private property for any public purpose without “just compensation.” When the government imposes land use restrictions on private property to preserve species habitat and as a result the land loses value, a “taking” has occurred and property owner should be compensated for the lost value.
If the government required private citizens to house students enrolled in a special education program and demanded that they regulate their activities so as not to disturb the students’ studies, the government would have to compensate the people whose homes were used. By the same reasoning, the government should also be constitutionally obligated to compensate people who must “house” protected species.
Honoring the Fifth Amendment would shield the landowner from choosing between his welfare and the endangered animal’s welfare. Protecting endangered species would no longer be a loser’s game because landowners who protect a species valued by the public will be compensated by the public.
Bolder Ownership Moves. True ownership goes beyond the landowner’s incentive to simply tolerate the presence of an endangered species. A bolder government action would provide incentives to landowners to foster and further species recovery — by making their property useful and attractive to endangered species. History provides numerous examples of individuals and private groups that have protected species through private initiatives — sometimes even while governments were contributing to the species decline. For example,
- When state governments were awarding bounties for killing birds of prey, a concerned citizen helped found the private Hawk Mountain Sanctuary in eastern Pennsylvania to prevent the slaughter of thousands of hawks, falcons, ospreys, eagles, owls and other endangered birds.
- When state governments were awarding bounties for killing seals and sea lions, a for-profit corporation protected the only mainland breeding area for the endangered Steller sea lion.
- While the federal government owns only 4.7 million acres of wetlands and has encouraged the destruction of private wetlands, about 11,000 private duck clubs have managed to protect five to seven million acres of wetlands from destruction.
“Private efforts have sucessfully protected species and habitats.”
In addition, beginning in the 1930s, long before the Endangered Species Act or the Convention on International Trade in Endangered Species (CITES) provided regulatory protection, Texas ranchers began to import foreign species. About 370 Texas ranches are involved in managing their lands for so-called exotic species. Because these species are not native to America , they can be privately owned and managed. A 1984 census counted 120,201 animals in 59 different species, from all over the globe. A sampling: biesa oryx from Sub-Sahara Africa, sika deer from Japan, white-tailed gnus from South Africa, Armenian red sheep, aoudads from Morocco, Nile lechwe, nilgai and blackbuck [antelope] from India, European mouflon sheep, Persian gazelles, Pere David’s deer from China, and so on. Significantly, not all the species being raised in Texas are hunted, and only six are regularly hunted for profit. Currently, Texas ranchers take pride in providing new habitats for as many as nine species threatened with extinction on their native grounds.
Also, a number of environmental organizations focus the majority of their efforts and resources on protecting species and their habitats. For instance, the mission of the National Audubon Society is to conserve and restore natural ecosystems, focusing on birds and other wildlife for the benefit of humanity and the earth’s biological diversity. In the United States , the Audubon Society has more than 550,000 members, 508 state and local chapters and more than 100 Audubon Sanctuaries and nature centers comprising more than 300,000 acres.
The Nature Conservancy, a nonprofit organization founded in 1951, is the world’s largest private international conservation group. The mission of the Nature Conservancy is to preserve the plants, animals and natural communities that represent the diversity of life on Earth by protecting the lands and waters they need to survive. To carry out this goal, the Conservancy sets its conservation priorities through ecoregional planning, attempting to preserve at least one representative example of each unique ecosystem.
The Conservancy both hires biologists and ecologists and works with various academics to establish its conservation priorities. Rather than protest and lobby, the Nature Conservancy largely uses a nonconfrontational approach to protecting species in situ : it purchases habitat.
The Conservancy runs the largest private system of nature sanctuaries in the world. To date, the Conservancy and its 1,029,012 members have protected and maintained 12,089,000 acres in the United States in nearly 1,400 private preserves. This amounts to an area greater than the combined size of Connecticut , Delaware , New Jersey and Rhode Island . The preserves range in size from less than half an acre, to several hundred thousand acres. In addition, the Conservancy has helped like-minded organizations preserve more than 80 million acres in the Asia Pacific, Canada , the Caribbean and Latin America .
“Ownership would improve conservation of endangered species and their habitats.”
All of the Conservancy’s preserves are managed to maintain the ecosystem or habitat as a functional whole. These preserves are field laboratories, dedicated both to studying specific ecosystemic goods and their interrelationships as protected by the specific preserve, and to better understanding how to improve ecosystem management and protect biodiversity worldwide. The Conservancy does not promote the preserves for recreation, and many of them are not open to the general public.
Expanding the benefits of ownership to endangered species could encourage more private conservation efforts. For example, government could offer tax incentives or credits to landowners who create habitat for endangered species on their land. Or, in a reversal of previous policies, the government could pay bounties to people for every breeding pair of endangered species found to inhabit their property for all or part (in the case of migratory species) of the year. Adjoining landowners, seeing the financial benefits accruing to their neighbors who protect species would then have the incentive to manage their own lands similarly.
[page]President Bush’s innovative concept of the ownership society is indebted to Western intellectuals. Great thinkers from Aristotle to Locke to the founders of this country recognized that secure individual property rights are an effective means of promoting both individual happiness and social welfare, and of maintaining political liberty. However, neither they nor the Bush administration have recognized that property rights could also be used quite effectively to protect the environment.
People typically use their property to increase their well-being, which, as Adam Smith argued, redounds to the benefit of society. But property use comes with responsibilities. First, property owners bear the costs of the bad decisions that they make with their property if their choices result in economic losses or in the destruction of the property itself. Secondly, they have the responsibility not to use their property in ways that violate the rights of others — and are penalized when they do so.
“Property owners have incentives to make wise choices.”
Government subsidies for agriculture and coastal or floodplain development, and policies that discourage the promotion and protection of wildlife on peoples’ lands, have severed the link between the decisions of individual property owners and the negative consequences of their choices. These policies lead to a variety of economic ills, but they also result in environmental destruction. Applying the concept of the ownership society to these policies would reduce incentives to destroy the environment and, indeed, could create positive incentives for entrepreneurial efforts to provide environmental amenities on privately-owned land.
NOTE: Nothing written here should be construed as necessarily reflecting the views of the National Center for Policy Analysis or as an attempt to aid or hinder the passage of any bill before Congress.
[page]- David Boaz, Defining an Ownership Society (Washington, D.C.: Cato Institute, 1995), p. 1.
- “Common law” is a label used to describe the ancient legal process of discovering and delineating the law on a case-by-case basis. Much of this discussion of the common law comes from H. Sterling Burnett, “Ecosystemic Goods: The Pro’s and Con’s of a Property Rights Approach,” Dissertation (Bowling Green, Ohio: Bowling Green State Univeristy, 2001).
- 3 Barb. 42, 43; N.Y. App. Div. 1848, aff’d 2 N.Y. 159 (1849).
- Gifford Pinchot, The Fight for Conservation (University of Washington Press, Seattle: 1967).
- Elizabeth Brubaker, Property Rights in Defence of Nature (London: Earthscan, 1995) and Roger E. Mieners and Andrew P. Morriss (Eds.), The Common Law and the Environment (Lanham, Maryland: Rowman & Littlefield, 2000).
- John Baden, “Destroying the Environment: Government Mismanagment of Our Natural Resources,” National Center for Policy Analysis, NCPA Policy Report No. 124, 1986.
- Aristotle, “Politics,” Book II, Chapter 5 [1263], in Richard McKeon, ed., The Basic Works of Aristotle (New York: Random House, 1941).
- John Locke, Second Treatise of Government , Thomas P. Peardon, ed. (Indianapolis: Bobbs-Merrill Company, Inc., 1952), 1st edition.
- President George W. Bush, Speech, June 17, 2004.
- Garrett Hardin, “Tragedy of the Commons,” Science , November 11, 1986, pp. 1243-48. See also Garrett Hardin and John Baden, Managing the Commons (New York: W. H. Freeman & Co., 1977).
- Environmental Working Group, Farm Subsidy Database, “Total USDA Subsidies in United States .” Available http://www.ewg.org:16080/farm/progdetail.php?fips=00000&progcode=total.
- Environmental Working Group, Farm Subsidy Database, “Commodity Subsidies in United States .” Available http://www.ewg.org:16080/farm/progdetail.php?fips=00000&progcode=totalfarm.
- U.S. Department of Agriculture, “FY 2006 Budget Summary and Annual Performance Plan,” Washington , D.C. Available http://www.usda.gov/agency/obpa/Budget-Summary/2006/FY06budsum.pdf.
- Environmental Working Group, Farm Subsidy Database: 1995-2004. Available http://www.ewg.org:16080/farm/progdetail.php?fips=00000&progcode=total_cc.
- U.S. Department of Agriculture, “FY 2006 Budget Summary and Annual Performance Plan,” Washington , D.C. Available http://www.usda.gov/agency/obpa/Budget-Summary/2006/FY06budsum.pdf.
- Daryll E. Ray, “Cost of Avoiding Real Issue: $17 Billion a Year,” MidAmerica Farmer Grower , Vol. 19, No. 13, March 29, 2002.
- Environmental Media Services [ EMS ] “Fast Facts,” 2002. Available here.
- Jonathan Tolman, “Federal Agricultural Policy: A Harvest of Environmental Abuse,” Competitive Enterprise Institute, August 1995.
- Ibid., p. 6.
- Rep. Earl Blumenauer, “Agricultural Subsidies,” Position Statement, 2004. Available http://blumenauer.house.gov/issues/Issue.aspx?IssueID=87&SubIssueID=89.
- General Accounting Office, “Crop Insurance: USDA Needs to Improve Oversight of Insurance Companies and Develop a Policy to Address Any Future Insolvencies,” Washington , D.C. , GAO-04-517, June 2004. Available here.
- Robert Dismukes and Joseph Glauber, “Why Hasn’t Crop Insurance Eliminated Disaster Assistance?” USDA Economic Research Service, Amber Waves , Vol. 3, Issue 3, June 2005.
- U.S. Office of Management and Budget, “Budget of the United States Government, FY2006: Department of Agriculture” Washington , D.C.
- Noel Gollehon, William Quinby and Marcel Aillery, “Agricultural Resources and Environmental Indicators, Chapter 2.1: Water Use and Pricing in Agriculture,” Economic Research Service, U.S. Department of Agriculture, Washington , D.C. , Agricultural Handbook No. AH722, April 2002, page 77.
- Fact Sheet, “Water Conservation and Restoration,” Natural Resources Defense Council, June 7, 2001.
- None of these figures reflects the full cost of water,including equipment, subsidies, etc. See Noel Gollehon, William Quinby and Marcel Aillery, “Agricultural Resources and Environmental Indicators, Chapter 2.1: Water Use and Pricing in Agriculture,” Economic Research Service , U.S. Department of Agriculture, Washington , D.C. , Agricultural Handbook No. AH722, April 2002.
- Fact Sheet, “Water Conservation and Restoration,” Natural Resources Defense Council, June 7, 2001.
- “The Conservation Reserve Program: Summary and Enrollment Statistics, 2004,” Farm Service Agency , U.S. Department of Agriculture. Available here.
- U.S. Department of Agriculture, “FY 2006 Budget Summary and Annual Performance Plan,” Washington , D.C. , p. 28. Available http://www.usda.gov/agency/obpa/Budget-Summary/2006/FY06budsum.pdf.
- “Program Status, Wetlands Reserve Program,” Natural Resouces Conservation Service , U.S. Department of Agriculture. Available here.
- See the Natural Resouces Conservation Service , U.S. Department of Agriculture, “2005 Allocations by Program.”
- J. Bishop Grewell, “Farm Subsidies are Harm Subsidies,” American Enterprise , October/November 2003.
- Ibid.
- General Accounting Office, “Agricultural Pesticides: Management Improvements Needed to Further Promote Integrated Pest Management,” Washington , D.C. , GAO-01-815, August 2001, p. 4.
- Ibid.
- H. John Heinz III Center for Science, Economics and the Environment, The State of the Nation’s Ecosystems: Measuring the Lands, Waters, and Living Resources of the United States ( New York City : Cambridge University Press, 2002).
- Nancy N. Rabalais et al., “Characterization of Hypoxia: Topic 1 Report for the Integrated Assessment on Hypoxia in the Gulf of Mexico,” U.S. Department of Commerce, National Oceanic and Atmospheric Administration, National Ocean Service, and Coastal Ocean Program, May 1999, p. xv.
- H. John Heinz III Center for Science, Economics and the Environment, The State of the Nation’s Ecosystems: Measuring the Lands, Waters, and Living Resources of the United States ( New York City : Cambridge University Press, 2002).
- Jonathan Tolman, “Federal Agricultural Policy: A Harvest of Environmental Abuse,” Competitive Enterprise Institute, August 1995.
- U.S. Fish and Wildlife Service, “Status and Trends of Wetlands in the Conterminous United States 1986 to 1997,” Washington, D.C., 2000.
- U.S. Department of the Interior, “The Impact of Federal Programs on Wetlands — Volume II,” March 1994. Available here; and U.S. Fish and Wildlife Service, “Status and Trends of Wetlands in the Conterminous United States 1986 to 1997,” Washington , D.C. , 2000.
- Environmental Working Group, “Soaking Uncle Sam: Why Westlands Water District’s New Contract Is All Wet,” Washington , D.C. , September 14, 2005.
- Fact Sheet, “Program Status – June 2005,” California Bay-Delta Authority. Available http://calwater.ca.gov/Newsroom/FactSheets/CALFED_ProgramStatus_June_2005.pdf.
- Ninos Malek, “The Federal Government’s War on the Hungry,” George Mason University , 2004. Available here.
- Taxpayers for Common Sense, “Federal Sugar Subsidies: A Sweet Deal for Sugar Processors,” Washington , D.C.
- Sarah Thorn, “GMA Testimony on the U.S. – Australia Free Trade Agreement,” June 16, 2004.
- David Moberg, “Manufacturing Discontent,” In These Times , December 3, 2003. Available here.
- Todd Gabel, Adrienne Simpson and Pam Villarreal, “Mr. President, Tear Down This Wall: How Trade Barriers Burden Businesses, Consumers and the Economy,” Fraser Institute, Fraser Forum , June 2004, pp. 14-16. Available http://www.fraserinstitute.ca/admin/books/chapterfiles/Jun04ffGabel.pdf.
- Jonathan Tolman and Clark Massey, “Milked to the Bone,” Competitive Enterprise Institute, 1996. Available http://www.cato.org/pubs/regulation/reg19n4-cur.html.
- Jerry Kozak, Testimony before Committee on Agriculture, U.S. House of Representatives, April 5, 2001.
- Government Accountability Office, “Farm Subsidy Payments: USA Should Correct Weaknesses in Regulations and Oversight to better Ensure Recipients Do Not Circumvent Payment Limitations,” Washington, D.C., 2004.
- Global Policy Forum, “Farm Subsidies That Starve the World,” June 20, 2005.
- Sophia Murphy, Ben Lilliston and Mary Beth Lake , “WTO Agreement on Agriculture: A Decade of Dumping,” Institute for Agriculture and Trade Policy, February 2005.
- Anup Shah, “Sustainable Development: The U.S. and Foreign Aid Assistance,” 2005. Available here; Edward Crane and David Boaz, Cato Handbook for Congress ( Washington , D.C. : Cato Institute, 2002). Available here.
- World Bank, “Cotton Producers Face Losses Because of Rich Country Subsidies, Says ICAC Report,” News Release, July 11, 2002.
- Mark A. Groomberg, ” America ‘s Bittersweet Sugar Policy,” Cato Institute, 2001.
- Sophia Murphy, Ben Lilliston and Mary Beth Lake , “WTO Agreement on Agriculture: A Decade of Dumping,” Institute for Agriculture and Trade Policy, February 2005.
- As cited in Dan Griswold, “Reforming Farm Subsidies and Trade Barriers,” Cato Institute, 2004. Available here.
- Brian M. Riedl, “Federal Spending — By the Numbers,” Heritage Foundation, October 7, 2005, p. 5.
- U.S. Office of Management and Budget, “Budget of the United States Government, Fiscal Year 2006: Department of Agriculture,” Washington , D.C.
- U.S. Environmental Protection Agency, ” America ‘s Wetlands: Our Vital Link Between Land and Water,” U.S. Environmental Protection Agency , Washington , D.C.: Office of Water, Office of Wetlands, Oceans and Watersheds, EPA843-K-95-001, 1995.
- William S. Simple, “Wetland Functions and Values,” U.S. Environmental Protection Agency, Office of Water, p. 9.
- Ibid.
- U.S. Environmental Protection Agency, “Functions and Values of Wetlands,” Office of Wetlands, Oceans and Watersheds, EPA 843-F-01-002c, September 2001.
- Chesapeake Bay Foundation, Save the Bay: 2002 Bay Health Index.
- See, for example, The California Environmental Protection Agency State Water Resources Control Board, Non-Point Source Pollution Control Program Five Year Plan, July 2003-June 2008. Available http://www.swrcb.ca.gov/nps/docs/5yrplan/4_urban_category.pdf; or see Provincetown Center for Coastal Studies, Cape Cod Bay Monitoring Project. Available here.
- U.S. Environmental Protection Agency, “America’s Wetlands: Our Vital Link BetweenLand and Water,” U.S. Environmental Protection Agency, Office of Water, Office of Wetlands, Oceans and Watersheds, Washington, D.C., EPA843-K-95-001, 1995.
- Federal Emergency Management Agency, “A Chronology of Major Events Affecting the National Flood Insurance Program,” Washington , D.C. , 2004.
- Private insurers reentered the market for flood insurance, as contractors and managers of the federal National Flood Insurance Program.
- Federal Emergency Management Agency, “A Chronology of Major Events Affecting the National Flood Insurance Program,” Washington , D.C. , 2004.
- Gilbert F. White, “Human Adjustment to Floods,” University of Chicago Department of Geography, Research Paper No. 29, 1942. Published in book form in 1945.
- W. J. McGee, “The Floodplains of Rivers,” Forum , No. XI, as quoted in “A Chronology of Major Events Affecting the National Flood Insurance Program,” Federal Emergency Management Agency , Washington , D.C., 2004.
- Gilbert White et al., “Changes in Urban Occupancy of Flood Plains in the United States ,” University of Chicago Department of Geography, Research Paper No. 57, 1958.
- National Wildlife Federation and Taxpayers for Common Sense, “Crossroads: Congress, The Corps of Engineers and the Future of America ‘s Water Resources,” Washington , D.C. , March 2004. Available http://www.taxpayer.net/corpswatch/crossroads/.
- National Wildlife Federation and Taxpayers for Common Sense, “Crossroads: Congress, The Corps of Engineers and the Future of America ‘s Water Resources,” Washington , D.C. , March 2004. Available http://www.taxpayer.net/corpswatch/crossroads/; and Lee Larson, “The Great USA Flood of 1993,” Hydrologic Research Lab., Office of Hydrology, NOAA/National Weather Service, June 1996. Available here.
- Public Law 84-99, U.S. Army Corps of Engineers.
- Federal Emergency Management Agency, “A Chronology of Major Events Affecting the National Flood Insurance Program,” Washington , D.C. , 2004.
- In 1973, the Nixon Administration issued “New Approaches to Federal Disaster Preparedness and Assistance.”
- Federal Emergency Management Agency (FEMA), “Flood Statistics.” Available here.
- Federal Emergency Management Agency, “A Chronology of Major Events Affecting the National Flood Insurance Program,” Washington , D.C. , 2004.
- Chad Berginnis, “Bunning-Bereuter-Blumenauer Flood Insurance Reform Act Implementation and Flood Insurance Claims Issues,” Testimony: Association of State Floodplain Managers, Inc. before the Subcomittee on Housing and Community Opportunity , House Committee on Financial Services, April 14, 2005. Available here.
- Norbert Schwartz, “FEMA and Mitigation: Ten Years After the 1993 Midwest Flood,” Journal of Contemporary Water Research and Education , Issue 130, Pages 36-40, March 2005.
- Government Accountability Office (GAO), “National Flood Insurance Program: Oversight of Policy Issuance and Claims,” Washington , D.C. , Highlights of GAO-05-532T, April 2005. Available here.
- National Weather Service, “Flood Losses: Compilation of Flood Loss Statistics,” Hydrolic Information Center [last updated on January 5, 2004]. Available here.
- Federal Emergency Management Agency (FEMA), “Building on Success — By the Numbers: FEMA’s Response to The Historic 2004 Hurricane Season,” April 28, 2005.
- Tom Ross and Neal Lott, “A Climatology of 1980-2003 Extreme Weather and Climate Events,” National Climatic Data Center , Technical Report No. 2003-01, December 2003.
- U.S. Army Corps of Engineers, “Value to the Nation: Coastal Protection, Economic Impact,” Corps Program Results, Water Resource Management.
- H. John Heinz III Center for Science, Economics and the Environment, “Evaluation of Erosion Hazards Summary,” April 2000, page 14.
- Tina Bernd-Cohen and Melissa Gordon, “State Coastal Management Effectiveness in Protecting Beaches, Dunes, Bluffs, Rocky Shores: A National Overview,” Office of Ocean and Coastal Resource Management, National Ocean Service, NOAA, DOC, March 1998, page 4.
- H. John Heinz III Center for Science, Economics and the Environment, “Evaluation of Erosion Hazards Summary,” April 2000.
- National Wildlife Federation and Taxpayers for Common Sense, “Crossroads: Congress, The Corps of Engineers and the Future of America ‘s Water Resources,” Washington , D.C. , March 2004. Available http://www.taxpayer.net/corpswatch/crossroads/.
- U.S. Geological Survey and U.S. Department of the Interior, ” West-Central Florida Coast : Limited Sand Resources for Eroding Beaches,” February 1997.
- U.S. Army Corps of Engineers, Civil Works Program Statistics, Information Paper CECW-ZD, January 31, 2003; U.S. Army Corps of Engineers, “Civil Works Floodplain Management Initiatives: Value to the Nation,” April 2000.
- National Wildlife Federation and Taxpayers for Common Sense, “Crossroads: Congress, The Corps of Engineers and the Future of America ‘s Water Resources,” Washington , D.C. , March 2004. Available http://www.taxpayer.net/corpswatch/crossroads/.
- Ike Sugg, “How Not to Protect Wildlife,” Hoover Institute, Hoover Digest , No. 2, 2001.
- Thomas Lambert and Robert J. Smith, The Endangered Species Act: Time for a Change (St. Louis: Center for the Study of American Business, March 1994); and Ike C. Sugg, “Endangered Species Act (ESA),” Environmental Briefing Book (Washington, D.C.: Competitive Enterprise Institute, 1996). More recent research found that, for example, while 22 agencies had budgets explicitly containing endangered species expenditures, and while the USFWS claimed that the entire federal expenditure for ESA in 1996 totaled $285 million, five other agencies testified before Congress that their combined 1996 ESA expenditures were more than $560 million. See Randy T. Simmons and Kimberly Frost, Accounting for Species, The True Cost of the Endangered Species Act ( Bozeman , Mont. : The Property and Environment Research Center , 2004).
- Richard L. Stroup, The Endangered Species Act: Making Innocent Species the Enemy (Bozeman, Mont.: Political Economy Research Center, 1995).
- Daniel R. Simmon and Randy T. Simmons, “The Endangered Species Act Turns 30,” Regulation , Winter 2003-2004.
H. Sterling Burnett is a senior fellow with the National Center for Policy Analysis, a nonpartisan, nonprofit research and education institute in Dallas , Texas . While he works on a number of issues, he specializes in issues involving environmental and energy policy. He also serves as an adviser to the American Legislative Exchange Council Energy, Environment, Natural Resources and Agriculture Task Force (1996 – Present); a senior fellow with the Texas Public Policy Foundation (2005 – Present); and a contributing editor to Environment & Climate News (2005 – Present).
Dr. Burnett has been published in Ethics, Environmental Ethics, Environmental Values, The Review of Metaphysics, International Studies in Philosophy, The World and I, USA Today and the Wash-ington Post .
Dr. Burnett received a Ph.D. in Applied Philosophy from Bowling Green State University in 2001.