Medicaid, the joint federal-state health care program for the poor and near poor, is the largest single expenditure by state governments today. At the rate the program is growing, it is on a course to consume the entire budgets of state governments in just a few decades.
Although Medicaid is commonly assumed to be a health program for welfare recipients, there are ten times as many people on Medicaid as there are receiving welfare checks. Medicaid now costs American taxpayers more than Medicare, or more than $1,000 per year for every man, woman and child in the country. The tax burden for both programs combined is more than $8,000 a year for the average family of four. Nationally, Medicaid now covers:
- One in every six people.
- One in every three children.
- One in every two births.
More than one of every two nursing home residents.
New York’s Medicaid program is especially costly. New York has less than 7 percent of the U.S. population, but spends about 14 percent of the nation’s Medicaid dollars. In 2004, the latest year for which complete data is available:
- New York spent $10,349 per enrollee, compared to the nationwide average of $6,834. Only New Hampshire spent more.
- New York Medicaid spent about $2,165 for each state resident (more than any other state) and almost two-and-one-half times the national average.
Why Is New York’s Medicaid Program so Costly? Higher living costs do not account for the high Medicaid spending in New York. The state spends more because of policies that encourage higher spending and discourage cost control. Other states share some of these same problems, but none have such a wide array of perverse incentives. Specifically:
- Unlike most other states, New York offers coverage to virtually all optional populations, and covers almost all optional services.
- New York pays physicians less than almost any other state, even though physician therapies are often more cost effective than hospital therapies.
- In contrast to its treatment of physicians, New York pays hospitals generously; whereas in most states Medicaid pays the lowest hospital fees of any payer, in New York Medicaid pays the highest fees of any payer — including private insurers.
- New York does not use smart buying techniques, such as selective contracting with providers, to reduce costs.
- New York spends more than any other state on drugs and pays some of the highest drug prices of any state; the state imposes few restrictions on doctors who prescribe the most expensive drugs, when lower-cost alternatives are often just as effective.
- The political incentives to spend are greater since the New York legislature bears only a fraction of the cost (less than almost any other state); for every dollar the state spends, it can confer $4 of benefits.
- New York does not aggressively pursue fraud — even failing to spend a substantial portion of the federal funding available for antifraud efforts; in 2004, only 37 cases of suspected fraud were uncovered.
- New York’s insurance regulations raise the cost of private insurance, and make (free) Medicaid coverage more attractive.
- While personal and home care substitute for institutional care in other states, New York spends more than most states for all three, and a fourth of all Medicaid dollars spent nationwide for personal care are spent in New York!
If New York Medicaid were as efficient as the average state program, it could spend billions of dollars less to achieve the same health outcomes, and would have billions of dollars each year to fund tax cuts or other spending programs.
What Can New York Do to Improve Medicaid and Control Costs? New York can control costs and improve services, by adopting common-sense reforms; by contracting with private sector providers for services; by fundamentally restructuring its program; and by moving patients out of Medicaid and into private sector plans. As part of this reform effort, the state also needs to completely overhaul long-term care and home health services. The common-sense reforms include:
- Negotiating discounts for most medical services through selective contracting.
- Treating patients in outpatient settings, such as doctors’ offices, where medically appropriate.
- Paying higher fees to physicians to increase patients’ access to health care and reduce expensive emergency room visits.
- Controlling drug costs using private-sector techniques, including pharmacy benefit managers (PBMs).
- Setting up cash accounts that disabled Medicaid recipients can use to manage their own health care dollars and take direct control over the purchase of needed services.
- Adjusting payments to hospitals to reward facilities that achieve low infection rates and reduce errors.
- Coordinating care to improve its quality and reduce medical errors, such as drug interactions, and instituting disease management, which involves developing treatment plans based on current protocols and training patients how to the follow them.
- Pursing fraud aggressively by giving local governments the authority to prosecute fraud and financial incentives to recover payments.
Structural reforms are also needed. Local governments, including counties, pay about 25 percent of the cost of Medicaid, and the federal government pays more than half. Since Medicaid spending is determined by the state government, the way the program is financed violates the principle that those who spend the money should bear the responsibility of paying for it. One solution is to block grant the funds to local governments, and let them locally manage their own Medicaid dollars.
Insurance market reforms are also needed. One reason so many people turn to Medicaid is that they have been priced out of the market for private health insurance by cost-increasing regulations. New York insurance laws allow people to obtain insurance once they become ill (guaranteed issue) and require insurers to charge the same price regardless of age and health status (community rating). This encourages people to remain uninsured until they get sick and causes the cost for those who need insurance to be way too high. A better way is to establish high-risk pools like those now available in 32 states.
New York is one of four states with a pilot project that provides financial incentives for people to purchase long-term care insurance. When the insurance is exhausted, special eligibility rules allow them to receive Medicaid benefits while retaining assets equal to the value of the policy. This is a good program with a worthy goal. But compared to other states, New York’s rules are too restrictive. Also, the state needs to give people financial incentives to choose (less-costly) home care over nursing home care. Other financing mechanisms also should be encouraged, including reverse mortgages, home sales contracts and viatical settlements.
How Can We Empower Medicaid Enrollees? A more fundamental reform is the creation of cash accounts that enrollees use to pay out-of-pocket costs. About half the states have cash and counseling pilot programs under way, allowing disabled Medicaid enrollees to manage some of their own health care dollars. (Patient satisfaction is near 100 percent!) Florida and South Carolina are about to integrate such accounts into their regular Medicaid programs.
What Is the Alternative to Medicaid? The ultimate goal of Medicaid reform should be to move patients to the same type of private health plans most Americans have. Private-sector plans may appear less generous on paper than the current Medicaid program, but they usually allow enrollees to access a greater range of providers and facilities. Enrollees in a Florida pilot program, for example, will be allowed to use their Medicaid funds to pay premiums for employer-sponsored plans where they work. New York Medicaid patients should also be allowed to enroll in the same plans that cover state employees.
Some of these changes the state can make itself; others require waivers from the federal government. In either case, the state should move forward with reform. Without change, patient care will likely deteriorate, and the Medicaid Empire will sink the taxpayers of the Empire State.
[page]Medicaid is the largest single expenditure by state governments today. Costs rose rapidly over the past decade, and the country as a whole now spends more on Medicaid than it spends on primary and secondary education. 1 We also spend more on Medicaid (mainly for the poor) than we spend on Medicare (mainly for the elderly). 2 Medicaid and other health expenses already account for one in every five dollars of state spending, in addition to the burden on federal taxpayers.3 At the rate the program is growing, it is on a course to consume the entire budgets of state governments in just a few decades.4
It is sobering to realize that Medicaid alone costs more than $1,000 per year for every man, woman and child in the country — or $4,000 for a family of four. Since Medicare costs a comparable amount, the average family is spending about $8,000 on other people’s health care — an amount that for many is well in excess of what they spend on health care and health insurance for their own family.
“Medicaid is the largest single expenditure by state governments.”
There is a desperate need to restrain the growth of Medicaid spending. However, squeezing payments to providers or limiting coverage is not the best approach. The best alternative is fundamental reform that introduces choice and competition, and encourages private-sector coverage. Incremental steps toward these objectives would benefit Medicaid patients as well as taxpayers.
This study addresses problems in New York’s Medicaid program, surveys promising reforms currently underway in other states, and recommends a number of changes. Because Medicaid is a joint federal-state program, some fundamental reforms will require Congress to address the program’s future in a comprehensive way. But New York policymakers can make dramatic changes in program design and cost without new federal legislation.
[page]Medicare and Medicaid were created in 1965 at the height of President Johnson’s Great Society and War on Poverty. Medicare is a federally funded health care program for seniors and the disabled. Medicaid is a joint federal-state program for the poor and near poor. Although each state operates its own program, the federal government sets the parameters for Medicaid and matches state spending. Medicaid has grown far beyond the program originally envisioned and the scope of the current program is staggering. Nationally, Medicaid covers:
- One in every six people.
- One in every three children.
- One in every two births.
- More than one of every two nursing home residents.
The number of Medicaid enrollees nationwide rose by nearly one-third between 2000 and 2004.5 Currently at 53 million, the number is likely to grow much higher. There are 10 million to 14 million people who are potentially el`igible but have not enrolled.6 Additionally, the number of seniors who qualify for Medicaid long-term care benefits is projected to grow rapidly as the Baby Boom generation begins to retire. The population over age 65 will grow by nearly two-thirds (64 percent) by 2020, and the number of seniors over age 85 will grow by 84 percent by 2025.7
“Ten times as many people are enrolled in Medicaid as receive welfare.”
Although Medicaid is commonly assumed to be a health program for welfare recipients, only a small portion of enrollees receive Temporary Assistance for Needy Families (TANF), the main cash assistance program. Furthermore, the number of individuals receiving TANF has fallen from almost 13 million in 1996 to about 5 million in 2003; as a result, the proportion of Medicaid enrollees who are welfare recipients has also fallen.8 Surprisingly, there are ten times as many people on Medicaid as there are receiving welfare checks.
Who Qualifies for Medicaid? Federal law requires the states to cover certain populations, including low-income seniors and pregnant women, the blind and disabled, and all children living in poverty. The states `an choose to cover children and families above the poverty level. The states also impose their own asset tests to determine eligibility. In New York, for example, a Medicaid-eligible individual can own a home, a car and personal property.
Every state covers some optional Medicaid populations, which are currently about 29 percent of enrollees.9 New York, for instance, extends eligibility to include young children (ages one to five) in households with incomes up to 133 percent of the federal poverty level, and infants to age one and pregnant women with incomes up to 200 percent of the federal poverty level.
In theory, most seniors and most of the disabled are covered by Medicare, a wholly federal program paid for by the federal government. However, there is a class of Medicare recipients called dual eligibles. Although they qualify for Medicare, they can also receive Medicaid because of their low incomes and few assets. Medicare is the primary payer, but states must pay for any benefits Medicare doesn’t pay for if Medicaid covers them. More than one-third of all Medicaid costs are for dual eligibles.10
How Do Enrollees Get Medical Care? On paper, Medicaid coverage appears more generous than the health plans of most other citizens. Potentially, enrollees can see any doctor or enter any facility and have government pay virtually all costs. In practice, things are different.
Access to Primary Care. Physicians and other health care providers can choose whether or not to participate. About 30 percent of doctors do not accept any Medicaid patients, and among those who do, many limit the number of Medicaid patients they will treat. Access to care at ambulatory (outpatient) care clinics is also limited: A recent survey found two-thirds of Medicaid patients were unable to obtain an appointment for urgent ambulatory care. In three-fourths of the cases, the reason was that the provider did not accept Medicaid.11
Access to Specialists. The number of specialists who accept Medicaid is particularly limited.12 According to a recent New York Times series, for example:13
- In New York City, a child with an irregular heartbeat was not able to see a cardiac specialist for nearly four months.
- The parents of a boy needing corrective ear surgery were told the wait could be as long as five years.
- At specialty clinics run by teaching hospitals in the city, Medicaid patients often have to wait one to three hours for a 5 to 10 minute appointment with a less-experienced medical resident or intern.
The problem is not limited to New York:
- Physicians say the University of Colorado Hospital is refusing Medicaid patients, and Medicaid enrollees there can face six- to eight-month waits for appointments at specialty clinics.14
- A 45-year-old Seattle woman admitted to the hospital with a triple fracture of her ankle waited nine days for a doctor to agree to take her case, because none of the orthopedic surgeons on staff would accept Medicaid.15
“Medicaid appears more generous than private health plans, but access to care is more limited.”
Access Through Managed Care Plans. Medicaid managed care plans are one way the states have attempted to expand access to care, control costs and improve quality. The choice of physicians and facilities are limited to the providers in the plan (as in private insurance plans) but contractual arrangements between physicians and the plans ensure a degree of access that Medicaid patients typically do not have. Nationally, about 27 million Medicaid enrollees, 61 percent of the total, are in managed care plans.16 The percentage of Medicaid enrollees in managed care ranges from none in a few states to 100 percent in Tennessee. Of the 4 million Medicaid recipients in New York in 2004, 58 percent (2.3 million) were in managed care plans.17
Under routine Medicaid, health care providers are reimbursed according to fee schedules set by state administrators; and one reason so many doctors eschew the program is because fee payments are so low. Under managed care, however, the plans receive a set annual fee per enrollee to provide whatever health services the state covers and the plans can negotiate to pay providers higher fees than normal Medicaid rates.18
“Nationwide, one-fourth of Medicaid enrollees account for two-thirds of costs.”
In New York City, Medicaid managed care plans are operated by public hospitals, and outpatient care is provided by clinics and community health centers. Some of the provider networks only serve special populations, such as pregnant women, and once the women give birth, they must transfer to another network.19 Other states contract with networks created by the same private insurers who administer employer-sponsored health plans.20
“One-third of New York Medicaid enrollees account for three-fourths of costs.”
Alternatives to Managed Care. During the 1990s, large insurers and most employers turned to managed care as a way to control costs. One way or another, these systems tended to reward providers for cost control. Managed care has not proved popular with patients, however. Whereas fee-for-service medicine gives providers an incentive to overprovide services, HMO-type fixed payments create incentives to underprovide. All too often, patients viewed managed care as an impersonal bureaucracy that puts cost control ahead of patient welfare.21 We will explore Health Savings Accounts as an alternative to managed care below.
“Two-thirds of Medicaid spending is for optional benefits; one-third is for mandatory benefits.”
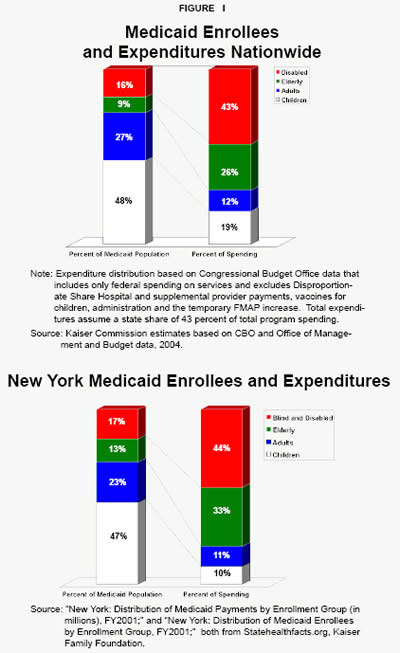
Where Do the Dollars Go? Roughly two-thirds of Medicaid spending nationwide is on optional populations and services:
- The general public tends to imagine the program primarily serves poor women and children; however, although this group includes three-quarters of all enrollees it accounts for less than one-third of the funds spent.22
- By contrast, the elderly and disabled account for about one-fourth of enrollees but more than two-thirds of all costs. [See Figure I.]
“Medicaid pays the bills of a majority of nursing-home residents.”
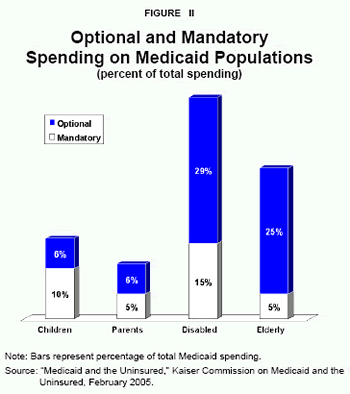
States have considerable flexibility to determine the types of services covered by Medicaid. The federal government requires every state to offer 14 mandatory benefits (for example, hospitalization, physician visits and so forth) but allows each state to choose which of 34 optional benefits it will cover, including prescription drugs, and long-term care. [See Appendix Table IIa-c.] Two-thirds of Medicaid spending is on optional benefits. [See Figure II.] 23
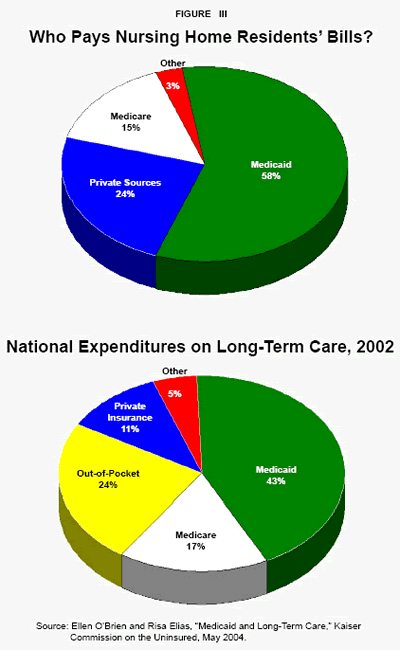
Nursing home care is an optional benefit that every state provides. Medicaid pays for 58 percent of all nursing home residents and 43 percent of all long-term care costs nationally. [See Figure III.] Long-term care is used by only 9 percent of all enrollees.24
“The distribution of federal Medicaid dollars does not reflect the distribution of poverty.”
How Is the Federal Contribution Determined? One might assume that the federal government’s Medicaid contribution is based on each state’s poverty population. This is not the case. Using the percentage of the nation’s poor that live in each state as an indication of need, many states receive far more Medicaid dollars than they should while others get far less. [See Table I.] New York, for example, has 8 percent of the nation’s poverty population, but gets 12.9 percent of all federal Medicaid dollars. By contrast, Texas has 10.3 percent of the nation’s poverty population, but receives only 6 percent of federal Medicaid dollars. As Figure IV shows, New York received 68 percent more than it would have based on the distribution of poverty alone.
- Vermont received more than twice as much as its portion of the poverty population.
- Maine received almost 97 percent more than it would based solely on the poverty distribution.
Among states that received far less than they should by this criterion:
- Virginia received only 69 percent of what it should have based on its share of the poverty population.
- Texas got about 57 percent of the funds it should have based on need.
- Nevada received only 51 percent.
Poverty versus Other Factors. Arguably, federal Medicaid spending should be based on more than the distribution of poverty.25 We should probably also consider ability to pay as well as differences in the cost of health care. Using state data on poverty, personal income per capita (as a proxy for ability to pay) and personal health expenditures per capita (as a proxy for health care costs), we performed a regression analysis of federal Medicaid dollars spent in each state. [See Appendix Table I.] It shows: 26
- A 10 percent increase in the poverty rate in a state increases federal Medicaid spending in a state by 8.2 percent.
- A 10 percent increase in per capita health expenditures increases federal Medicaid spending for a state by 12.6 percent.
- However, a 10 percent increase in a state’s personal income per capita has no effect on federal Medicaid spending.
“Some states receive far more federal dollars than if the money were distributed based on poverty.”
Based on our analysis some states are receiving far more or far fewer Medicaid dollars than would be indicated, taking into account all three factors. Texas should receive almost 9 percent of federal Medicaid dollars instead of its current 6 percent. By contrast, New York should receive only about 7 percent of total federal Medicaid dollars, instead of its current 12.9 percent.
The Federal Match Formula. What accounts for these disparities in the distribution of federal funds? The answer lies in a formula called FMAP (Federal Medicaid Assistance Percentage or the “federal match”) used to determine the percentage the federal government contributes to each state’s program.
The formula uses the ratio of per capita income in a state to per capita income nationwide (a proxy for both poverty and ability to pay) to determine the federal matching rate. However, there is a 50 percent floor on the federal matching rate and an 83 percent ceiling, designed to bring states closer to the national average in terms of their funding ability. A matching rate of 50 percent means that a state receives one dollar in federal funding for every state dollar spent. There is no limit on the number of state dollars the federal government will match; hence, states that spend more on Medicaid receive more federal dollars.27 [See Appendix I for a detailed explanation of the formula.]
“The federal matching formula rewards states that spend more.”
However, the matching rate is enhanced by an additional amount equal to 30 percent of the difference between 100 percent and a state’s calculated matching rate. For a state with a matching rate of 50 percent, the enhancement raises the matching rate to 65 percent. The enhancement benefits high-income states, since it is calculated from the 50 percent floor. New York, for example, receives about $1.86 for every dollar it spends instead of just the dollar-for-dollar match resulting from the 50 percent floor. Mississippi’s enhanced matching rate is 83 percent, so they receive $4.88 for every dollar they spend. However, the formula doesn’t benefit Mississippi more than New York.
The formula’s ability to narrow the disparities between states depends on how much each state spends. In 2004, New York spent twice as much per capita on Medicaid as did Mississippi ($2,165 per capita compared to $1,180 per capita, respectively). Even though New York’s matching rate per dollar is lower, they receive more federal Medicaid dollars ($23.4 billion compared to Mississippi’s $2.7 billion) because they spend more. Indeed, the Government Accountability Office reports that while the federal matching rate moves 30 states toward the national average (including Mississippi), it also moves about 21 states away from the national average (including New York).28
How Much Is Lost to Fraud and Abuse? Fraud and abuse have plagued Medicaid since its inception. In 1997, the General Accounting Office estimated that fraud and abuse may be as high as 10 percent of Medicaid spending.29 For example, a 1993 investigative report of the Illinois Medicaid system by the Chicago Tribune found:30
- In one year, 71,064 Medicaid patients visited a doctor’s office more than 11 times (compared to a national average of six visits per year), while four patients made more than 300 visits in one year.
- In one day, one patient saw five doctors, visited a pharmacy seven times and had 22 prescriptions filled with 663 pills.
The Tribune also uncovered “Medicaid mills,” that freely prescribed drugs, syringes and other medical products that were sold by patients on the street.
More recently, a year-long investigation of New York Medicaid by the New York Times found massive provider fraud. For example:31
- Dr. Rosen, a dentist in New York’s Medicaid program, claimed to have performed nearly 1,000 procedures in a single day.
- In September alone she claimed to have performed 9,500 procedures.
- All told, she and a colleague billed New York Medicaid $5.4 million in 2003.
Most fraud is committed by physicians and other providers, rather than patients, but providers often turn a blind eye to unscrupulous patients abusing or defrauding the system. For instance, the Times reports that a Brooklyn doctor prescribed more than $11 million worth of a synthetic growth hormone used to treat AIDS patients over a three year period. Investigators say these patients were part of an elaborate scheme to obtain a drug popular with bodybuilders buying on the black market. New York Medicaid’s yearly cost for this growth hormone grew from $7 million to $50 million within a year of the scheme becoming prevalent.
Another source of fraud and abuse is the federal Supplemental Security Income (SSI) program. Many people with disabilities access Medicaid benefits by qualifying for SSI. Since coverage is often related to medical conditions that are fairly easy to fabricate or exaggerate, individuals and parents have incentives to misrepresent their medical conditions. According to the Government Accountability Office (GAO), “middlemen” who provide translation services to beneficiaries who do not speak English, coach them on feigning and exaggerating mental disabilities in order to receive SSI benefits; middlemen also work with dishonest health care providers to supply faulty medical information. Additionally, a number of SSI recipients have admitted to transferring ownership of assets in order to quality for SSI benefits.
- Between 1990 and 1994, an estimated $74 million in assets were transferred, including cars, cash, houses and land.
- Between 1996 and 1997, the Inspector General’s Office received 12,680 complaints of SSI fraud, constituting about 37 percent of all fraud allegations received from the public.
Unlike the poor and near poor, whose income and assets can be documented, these recipients can “game” the system to obtain coverage.32
[page]Medicaid was intended to improve access to medical care and thereby the health of the indigent. Arguably, it has done neither. And as the program has expanded to cover additional populations, including the near poor and even middle class individuals, the evidence suggests that it is displacing, or crowding out, private health insurance coverage.
Impact on Access to Care. It is commonly assumed that Medicaid enrollees have greater access to health care than if they were uninsured. But there is little evidence that is true. Most enrollees rely on the same public and not-for-profit hospitals and clinics that have always provided a health care safety net for the poor.33 Medicaid is the primary social safety net for indigent health care — but not the only one. For example, community health clinics and hospital emergency rooms are often providers of last resort. The existence of this free care (charity care) often makes people eligible for Medicaid feel that enrollment is unnecessary. Free care, in other words, appears to be a substitute for Medicaid.
“Medicaid spending substitutes for free care by doctors and hospitals.”
In fact, where Medicaid spending is low, spending on free care is high — and vice versa. For example, an NCPA analysis of health regions in Texas found that the area with the highest average Medicaid cost per enrollee spent more than twice as much as the area with the lowest average cost.34 But we found that adding spending on free care to Medicaid spending cuts the variation in regional health care spending in half. In other words, free care substitutes for Medicaid spending, as regions that spend less on Medicaid tend to spend more on free care and vice versa. [See sidebar on “Free Care.”]
Impact on Health. An oft-cited argument for Medicaid is that making health care virtually free at the point of consumption encourages preventive care and improves health outcomes. This could potentially reduce overall health care costs. Unfortunately, there is little evidence that this occurs. Studies suggest explicit attempts to encourage the use of preventive care by Medicaid beneficiaries are generally unsuccessful. For example, one study found that outreach programs in North Carolina had a very small impact on utilization.35 Another study found that receiving Medicaid benefits for a year increased the probability children would receive checkups by only 17 percent. The researchers concluded that “factors other than insurance and income, such as the low educational attainment of low-income mothers, explain approximately 80 percent of the gap between low-income and other children in their well-child visits.”36 Additionally, there is no evidence that becoming eligible for Medicaid significantly improves child immunization rates.37
However, analyzing the use of Medicaid services tells us only about inputs, not outcomes such as health improvement. The evidence of Medicaid’s effect on health is conflicting. For example, Medicaid eligibility is somewhat associated with a lower risk of infant mortality.38 And University of Washington researchers found some evidence that Medicaid decreases low-weight births for medically high-risk women.39 Studies in other states, however, have found Medicaid expansion had little effect on prenatal care and outcomes.40
“Medicaid creates disincentives to work and save.”
Impact on Income and Wealth. Like other means-tested government benefits, Medicaid creates disincentives to work and save.41 Income tests discourage work by withdrawing benefits as income rises. Asset tests encourage people to transfer or spend down their assets or avoid saving to become or remain eligible. Knowing their medical needs will be covered by Medicaid, eligible families may boost consumption and save less for emergencies. University of Kentucky economist Aaron Yelowitz and Jonathan Gruber of the Massachusetts Institute of Technology found that Medicaid recipients consumed more and saved less, reducing their average household wealth in 1993 by $1,600 to $2,000 (in today’s dollars).42
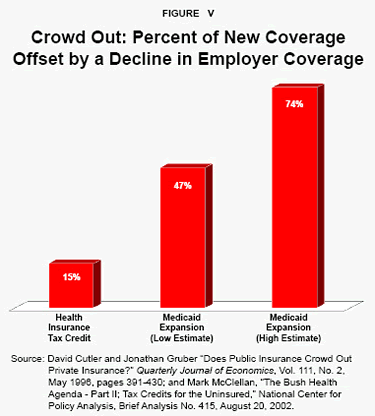
Impact on Private Insurance. Many assume Medicaid insures people who otherwise would not have access to private insurance.43 However, Medicaid also induces some people to drop their private coverage in order to take advantage of free health insurance offered by the state. Often this occurs when employers cease offering insurance coverage as large numbers of current and prospective employees become eligible for Medicaid. As a result of such crowding out, the cost of expanding public insurance programs has been high relative to the gain. For example, if for each new enrollee in a public program at least one person loses private insurance, there will be no net reduction in the number of uninsured, despite the higher taxpayer burden. If for every two new enrollees in the public program one person loses private insurance, the cost to the taxpayers for each newly insured person will double.44
David Cutler of Harvard University and Jonathan Gruber of the Massachusetts Institute of Technology found that Medicaid expansions in the early 1990s were substantially offset by reductions in private coverage.45 They found that for every additional dollar spent on Medicaid, private sector health care spending was reduced 50 to 75 cents on the average.46 Thus taxpayers incurred a considerable financial burden, but at least half, and perhaps as much as three-fourths, of the expenditures replaced spending by individuals, rather than buying additional medical services. [See Figure V.]
“Medicaid crowds out private insurance coverage.”
In 1997 Congress expanded access to public health insurance with the State Children’s Health Insurance Program (SCHIP). This program provides additional federal matching funds to states to cover children in families whose incomes are too high to qualify for traditional Medicaid. SCHIP also crowds out private coverage. Take a low-income working family covered by an employer-sponsored health plan. The employer might have covered some or all of the cost of insurance premiums for the employee and family with pretax dollars. But paying wages is more attractive to actual and potential employees if coverage is provided by the state. Thus SCHIP offered some employees the opportunity to increase wages and reduce their out-of-pocket health care costs.
“Increased Medicaid enrollment was offset by a drop in private insurance coverage.”
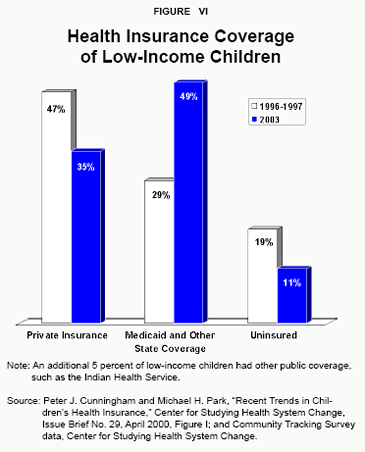
As a result of expansions of Medicaid and SCHIP, the number of poor children without health insurance fell from 19 percent in 1997 to 11 percent in 2003. During this period enrollment of low-income children in public programs increased from 29 percent to 49 percent.47 Meanwhile, the percentage of children from low-income families covered by private insurance fell from 47 percent to 35 percent, although there was little change in the percentage of privately insured children in households at higher income levels. [See Figure VI.] Thus, SCHIP apparently induced low-income employees to drop their children from company-sponsored health plans.48 The crowd-out of private insurance due to the expansion of public programs was 0.6, meaning that every percentage point increase in public coverage resulted in a reduction of about 0.6 percentage points in private coverage among low-income children.49
“Medicaid expansion has not reduced the ranks of the uninsured.”
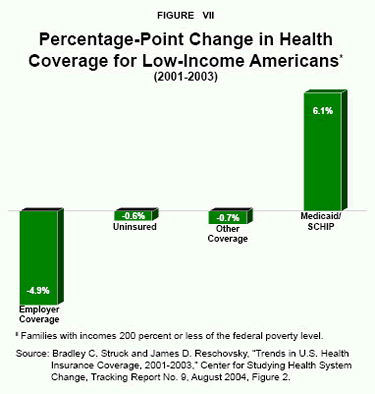
More recently, from 2001 to 2003, the proportion of low-income Americans enrolled in public programs rose 6.1 percentage points. However, this increase was offset by a 4.9 percentage point decline in coverage by employer-sponsored plans. Overall, the rate of uninsured fell only about one-half point.50 [See Figure VII.] Casual empiricism suggests that it takes a 13 percentage point increase in public coverage to reduce the uninsured rate by 1 percentage point.
[page]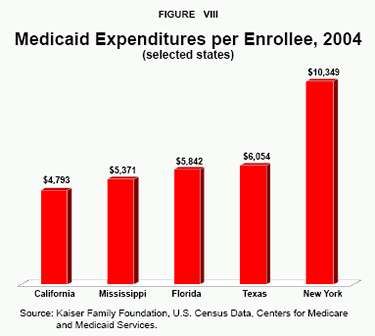
New York has less than 7 percent of the U.S. population, but spends about 14 percent of the nation’s Medicaid dollars.51 The average New Yorker spends more on Medicaid (through taxes) than the average citizen of any other state. The state also spends more on each Medicaid enrollee than almost any other state. Including federal, state and local spending, in 2004, the latest year for which complete data is available:52
- New York spent $10,349 per Medicaid enrollee, compared to the nationwide average annual cost of about $6,834. [See Figure VIII.] Only New Hampshire spent more.
- New York Medicaid spent about $2,165 for every man, woman and child living in state — more than any other state and almost two-and-one-half times the national average of $873.
“New York spends more per Medicaid enrollee than almost any other state.”
Why Does New York Spend So Much More Than Other States? Some might assume that Medicaid costs are higher in New York because the cost of living is higher than in other states, especially in New York City. However, we compared New York City to Columbus, Ohio, where the local cost of living is at the average for the nation as a whole. The findings:53
- In fiscal year 2003-2004, Medicaid spending in New York City averaged $9,842 per enrollee, almost twice as much as the $5,082 spent in Franklin County (Columbus).
- Adjusted for the cost of living in each area, New York City spending per enrollee was still twice as high as in Columbus, Ohio.
Thus higher living costs do not account for the relatively high Medicaid spending in New York.
New York spends more because of policies that encourage higher spending and discourage cost control. Other states share some of these same problems, but none have such a wide array of perverse incentives. Specifically:
- Unlike most other states, New York offers coverage to virtually all optional populations and covers virtually all optional services.
- New York underpays physicians and overpays hospitals, even though physician therapies are often more cost effective than hospital therapies.
- New York does not use smart buying techniques, such as selective contracting, to reduce costs.
- Compared to other states, New York pays premium prices for drugs and imposes few restrictions on doctors who prescribe the most expensive drugs, when lower-cost alternatives are often just as effective.
- The political incentives to spend are greater since the New York legislature bears only a fraction of the cost (less than almost any other state) of the benefits it confers; a substantial share of the cost is borne by county property-taxpayers in addition to federal taxpayers.
- New York does not aggressively pursue fraud — even failing to spend a substantial portion of the federal funding available for antifraud efforts.
- New York’s insurance regulations raise the cost of private insurance, and make (free) Medicaid coverage more attractive.
Let’s look at how each of these features of the system raises costs.
Costly Policy: Offering More Benefits to More People. One reason New York Medicaid is so costly is that the state covers virtually all optional populations and provides virtually all optional benefits.54 Medicaid covers an estimated 4 million New Yorkers,55 or one in every five residents. New York has a higher proportion of residents in Medicaid than most states — about 50 percent more than the national average (21 percent versus 14.3 percent).56
There are 35 optional Medicaid services for which the federal government will provide matching funds. New York provides 31 of these services. These include, for instance, podiatry, which is only funded in 26 other states. Only 17 other states fund “personal care” and only 15 others offer private duty nursing.57 [For a list of optional benefits, see Appendix Table IIa-c.]
“New York covers virtually all optional populations and benefits.”
Following is a detailed discussion of three of these optional benefits that are widely utilized in New York: long-term or nursing home care, home care and personal care, and transportation services. Long-term care is an optional benefit every state provides, but the New York program is unusually costly. In other states, home and personal care substitute for more expensive institutional care, but all three types of benefits are utilized in New York to a greater extent than other states. Finally, New York provides the most extensive, and expensive, transportation services of any state.
Optional Benefit: Long-Term Care. Among the optional benefits New York provides is long-term care. Although every state provides some nursing home benefits, New York spends more than the average state on institutional long-term care.
- About 17 percent of the Medicaid money spent on long-term care in the United States is spent in New York.58
- Nationally, Medicaid pays for two-thirds of nursing home care; in New York it pays for more than three-fourths of nursing home care (78 percent).59
What accounts for the higher spending on long-term care? One reason is that New York Medicaid has a higher proportion of blind, aged and disabled beneficiaries than the U.S. average — accounting for nearly one-third (32 percent) of its enrollees compared to the national average of 24 percent.60 Adding to this is the higher labor and long-term care costs in New York City. A comprehensive study of all the states by the federal government found that nursing homes in New York state were about 46 percent more expensive than the national average, and even after adjusting for differences in the cost of living are approximately 29 percent higher than the national average.61 Another study of metropolitan areas found nursing home costs in New York City were more than double that of other major cities.62
“One-fourth of all Medicaid personal care dollars are spent in New York.”
Optional Benefit: Personal and Home Care. Another widely utilized benefit is personal care and home care. Personal care, sometimes referred to as “custodial care,” generally involves assistance with activities related to daily living (bathing, toilet assistance, eating and housekeeping). Home care can also include assistance with daily living activities, but also includes skilled nursing.63 Some 13 percent of New York Medicaid enrollees utilize personal care and 8 percent use home care, compared to a nationwide average of 11 percent and 2 percent, respectively.64 And, according to the Citizens Budget Commission — a taxpayer watchdog group — New York provides much more home care than any other state:65
- Whereas those receiving home care benefits in other states get helpers an average of 11 hours per week, the average is 30 hours per week in New York.
- Average spending on personal care per capita is $18.11 across the country, but New York spends $91.21, more than four times as much.
- Overall, fully a fourth of all Medicaid dollars spent on personal care nationwide are spent in New York!
Home health aides typically come once a day to wash dishes, perform light cleaning, deliver or prepare meals, and help with bathing and dressing. Enrollees often begin receiving personal care after discharge from a hospital, when a Medicaid official assesses their level of disability and calculates the number of hours of assistance they need for daily living activities.
Once recuperated, most recipients have come to expect the higher level of service they were receiving (due to illness) and resist having the number of hours of personal care assistance cut back. If clients complain, the system generally favors clients over administrators. In New York, Medicaid enrollees often use home care attendants for nonmedical tasks such as shopping. Furthermore, in some cases, assistants are chosen by the recipients themselves, and can include other members of the household, relatives or neighbors. Thus, Medicaid often pays family members to do what they would have done anyway.
Home- and personal-care services may be justified when they allow the disabled or frail seniors to avoid institutional care, but many New Yorkers receiving home care could perform more of the tasks themselves and are receiving more assistance than is needed to keep them out of institutionalized care. Thus, apart from skilled nursing services, home care often amounts to free maid service.
Optional Benefit: Transportation. New York also provides such nonmedical services as transportation. For example, New York Medicaid pays for wheelchair-accessible vans (called ambulettes) to transport Medicaid enrollees with mobility problems to and from medical treatments. The service is intended to provide transportation only to those who use wheelchairs or who cannot walk without assistance. But most of those taking ambulette rides have no mobility problems and, for them, the service is actually a free taxi service. In 2005, the New York Times reported:66
- Two doctors each ordered more than 90 trips per day for patients.
- At another clinic, one patient used the service 153 times in a single year while another patient used the service 152 times — about one ride every two-and-one-half days.
- Other patients used the service more than 130 times.
“New York pays $60 to transport patients who could ride a bus for $2.”
For patients who qualify for the service, cheaper alternatives exist. A typical bus ride in New York City costs $2 and a taxi ride costs $10, according to the New York Times. But Medicaid typically pays contractors $25 or $31 each way to transport patients to their appointments in an ambulette. Overall, New York Medicaid spent $316 million to transport patients to doctors’ offices and hospitals in 2003. This works out to 10.5 million to 12.5 million rides per year.67
Costly Policy: Underpaying Physicians and Overpaying Hospitals. Routine examinations and treatments — including minor surgical procedures — can be provided more efficiently in a doctor’s office than a hospital. But many doctors who could provide such services do not do so. They do not participate in Medicaid because reimbursement is so low. As a result, the patients turn to much costlier settings, such as hospital clinics and emergency rooms.
The Effects of Underpaying Physicians. Medicaid reimbursement rates for physicians are typically lower than what physicians receive from the private sector in every state. But in New York the discrepancy is even greater. In fact, New York has some of the lowest physician payment rates found anywhere in the country. For instance:68
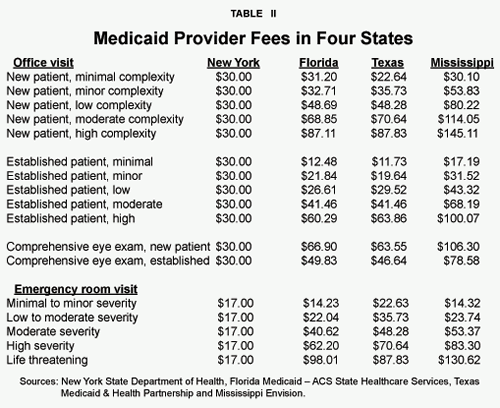
- New York doctor receives $30 for a visit by an established patient requiring a highly complex exam, whereas Mississippi pays a physician about $100 for the same exam. [See Table II.]
- An eye doctor in New York receives $30 for a comprehensive examination of a new patient, whereas Texas and Florida pay more than twice as much for the same service.
“New York underpays physicians.”
Another way to think about Medicaid physician payments is to compare them to what Medicare pays:
- Medicare pays physicians only 83 percent as much as private insurers, on the average, nationwide.69
- Medicaid fees for physician services are 69 percent of what Medicare pays, nationwide, according to the American Academy of Pediatrics,70 and perhaps as little as 62 percent, according to an Urban Institute estimate.71
- By contrast, in New York, Medicaid pays physicians only about 45 percent of what Medicare pays.72
Only two state Medicaid programs — in New Jersey and Rhode Island — pay physicians so little compared to Medicare. In New York City, for instance, Medicaid will only pay a specialist $30 for a consultation of moderate complexity, while Medicare pays $200.73 Medicaid physician payments also vary by type of service. For example:74
- New York Medicaid pays 65 percent of what Medicare pays obstetricians.
- It pays primary care providers only 40 percent of what Medicare pays.
- Other specialists are only paid about 31 percent of what Medicare pays.
“Hospital care substitutes for physician visits.”
These reimbursement rates affect access to care. Laurence C. Baker and Anne Beeson Royalty found that a 10 percent increase in Medicaid fees raised the number of poor patients visiting office-based (private) physicians by 3.4 percent, and correspondingly reduced the number visiting public physicians (such as in public health clinics) by 3 percent. 75 When physicians are rewarded for taking complex cases, they have an incentive to accept them. When fees are not adjusted for the complexity of the case, they have an incentive to avoid complex cases.
“New York spends nearly three times as much as the average state on hospital care.”
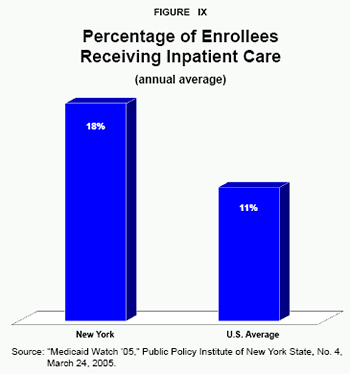
The Effects of Overpaying Hospitals. When access to private physicians is limited, patients rely more on inpatient treatment. In New York state, 18 percent of Medicaid patients receive inpatient care compared to just 11 percent nationally.76 [See Figure IX.] Furthermore, in contrast to its treatment of physicians, New York pays hospitals generously. When New York deregulated the hospital industry in 1997, the system of Medicaid fee-for-service was left largely intact, allowing Medicaid enrollees to go to any hospital, regardless of its efficiency. Consequently, Medicaid began to pay the highest fees of any payers — including private insurers.77 In most states Medicaid pays the lowest fees of any payer.
This generous payment policy does not give hospitals any incentive to increase productivity or reduce costs. As a result, in 2003, New York Medicaid paid about $10 billion to hospitals for inpatient care, subsidies for graduate medical education and hospital-based clinics — more than any other state Medicaid program. Furthermore:
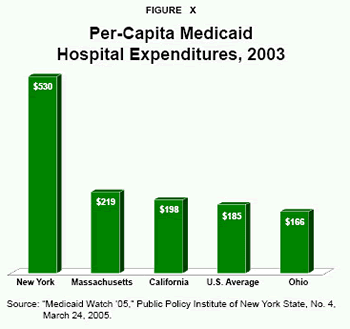
- New York spends nearly three times as much per state resident on inpatient care ($530) as the national average ($185).78 [See Figure X.]
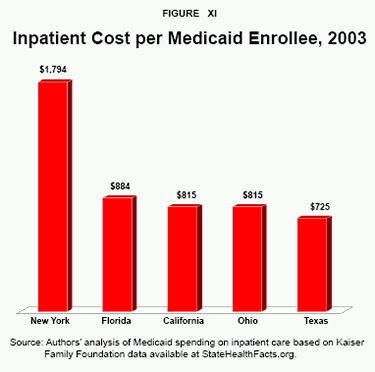
- The inpatient cost per Medicaid enrollee in New York is also greater than in other large states — $1,794 in 2003, compared to $725 in Texas, $815 in California and Ohio, and $884 in Florida.79 [See Figure XI.]
For instance, some New York hospitals have high fixed operating costs — due to a large number of empty beds. (Empty patient rooms generate no revenue, but incur costs — such as heating and cooling.) In fact, New York has 21 percent more hospital beds per capita than the national average. Statewide, about 9,100 hospital beds were eliminated from 1990 to 2005, but experts suggest that closing another 20,000 beds would make the system more efficient while meeting the demand for beds.80 New York has somewhat reduced excess capacity, but instead of closing the most inefficient and underutilized hospitals, it has closed a few beds at a number of hospitals.81
“New York spending per patient is higher than in other large states.”
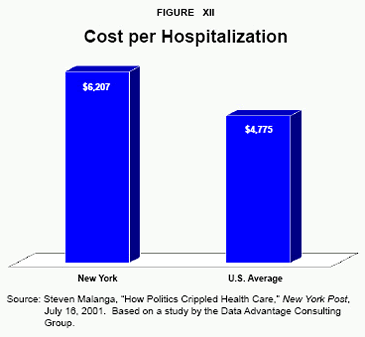
Furthermore, average administrative costs in New York hospitals are more than 13 percent higher than the national average and the cost of patient care is nearly 10 percent higher — after controlling for case severity and higher regional labor costs.82 For similar cases, Medicaid-paid hospital stays in New York cost about 30 percent more than the national average.83 [See Figure XII.] And patients spend 37 percent longer in the hospital, on the average, than patients with similar conditions in other states.84
“New York spends 30 percent more than average on similar cases.”
Costly Policy: Ineffective Managed Care. Managed care was introduced into Medicaid in order to increase access to care, and to provide services efficiently. In New York City, Medicaid managed care has done a poor job of pursuing both goals.85
Managed care organizations usually contract with area hospitals and doctors to provide services at negotiated discounts. However, most New York City Medicaid managed care plans are administered by large public hospitals, which are the primary providers of health services.86 These organizations do not have the same incentives to control costs as private sector insurers. For instance, a private sector insurer would seek to hold down the cost of caring for enrollees by contracting selectively with health care providers who were efficient at providing specific services. Yet a public charity hospital that has contracted to care for the same group has the incentive to perform all medical services in-house even if its facilities are not as efficient at providing some medical services as other hospitals. Even if the hospital is inefficient and losing money, keeping all medical services in-house minimizes loses. Whereas a nonprofit or for-profit health plan would go out of business, a charity hospital often uses political clout to increase subsidies.
Furthermore, most New York City public charity hospitals lack large networks of participating physicians and have to rely on outpatient clinics affiliated with the hospital.87 As a result, access to physicians is less convenient and many enrollees cannot see the same doctor each time they schedule an office visit. This reduced access to primary care physicians often leads to over-use of emergency departments in situations when a physician office visit would have been less costly.
Most states, including New York, have enrolled a significant proportion of their Medicaid beneficiaries in managed care plans. However, like most states, New York exempts substantial patient populations from its mandatory managed care enrollment: the elderly and disabled. Seventy percent of Medicaid costs in New York are for the elderly and disabled. The average yearly cost per person to care for them is 10 times higher than for nondisabled children and five times the cost of caring for the parents of nondisabled children. Exempting the most intensive users of Medicaid services from cost-control efforts is an expensive missed opportunity. These patient groups have problems accessing care, and could benefit from the continuum of care and case management that managed care networks can offer. For many of them, managed care is not even available on a voluntary basis.
Uniquely, New York applied for and received a special waiver to allow managed care plans, community groups and clinics to recruit new enrollees and help them fill out the enrollment forms. This process, known as “facilitated enrollment,” makes it easier to sign up ineligible people and gives HMOs the ability to steer enrollees to their own firms.88 It also allows managed care contractors to sign up less costly patients and avoid more costly ones.
An alternative to managed care is to allow patients to manage their own health care dollars and shop for care as empowered consumers in the medical marketplace. We will consider this option below.
“New York spends more on drugs than any other state.”
Costly Policy: Paying Premium Prices for Drugs. New York spends more on drugs than any other state — about $3.413 billion in 2002.89 It also pays higher average prices for drugs than any other state except New Jersey.90 And it spends more on drugs per enrollee than any of the other 10 most populous states, at about $957 per enrollee.91
Why? One reason is that the New York state program provides few incentives for enrollees to economize on drug costs, despite evidence that there is wide variation in prices for the same drug as well as less expensive generic and therapeutic alternatives for many drugs.92 Furthermore, according to a 2004 Inspector General’s report, New York consistently paid some of the highest prices of any state for Medicaid drugs.93 For instance:
- New York pays $3.67 per dose for the acid reflux drug Omeprazole even though an identical drug, Prilosec, is available over-the-counter for about 75 cents per dose.94
- New York paid $18.70 per container of the asthma drug albuterol while Texas Medicaid only pays $6.63.
Another reason for New York ‘s high drug costs is that the state does little to restrict the drugs for which it will pay. Many private health plans have some type of preferred drug list with increased cost sharing for drugs that have significantly cheaper alternatives. Most state Medicaid programs have a drug formulary, which is a list of prescription drugs for which the program will pay. The drugs are selected through a competitive bidding process, and drug companies usually agree to reimbursement rates that are steeply discounted from the retail price. Many states will only include one drug from a class in the formulary. Another way to save money is negotiating discounts with drug manufacturers.95 New York has taken steps to reduce drug spending, but their efforts have lagged behind other states and have so far been ineffective. It recently began encouraging the use of generic drugs, but doctors can easily substitute higher-priced brand drugs.96
“The State of New York pays $1 for every $4 in benefi ts it confers.”
As with other types of managed care there is a danger that drug formularies can become bureaucratic obstacles that prevent patients from getting the drugs they need. Also, administrators may be tempted to sacrifice quality care in order to reduce costs. Ideal drug policy minimizes costs without harming patient welfare. Poor drug policy harms patients and may (because of adverse health effects) not even reduce costs.97 Frank Lichtenberg of Columbia University has found that newer, more expensive drugs may offer more effective treatment and reduce total health care costs. Lichtenberg found that lowering the average age of drugs used by roughly a decade (that is, from 15 years to 5.5 years) results in an increase of $18 in drug spending but a net reduction in total health care spending by $111. Most of the net reduction was due to decreased hospitalizations and fewer office visits. 98
“Counties have cut services and raised taxes to pay for Medicaid.”
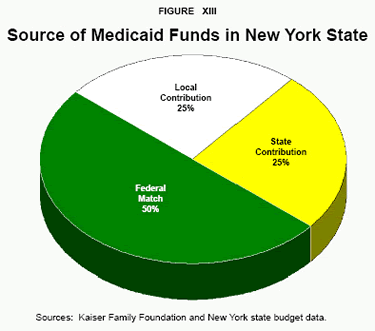
Costly Policy: Shifting the Cost of State Mandated Benefits onto Local Governments. One reason for the higher cost of New York Medicaid is the unusual way in which the program is financed. Unlike other states, New York requires its counties to pay a substantial portion of Medicaid costs.99 Figure XIII shows the break-down of New York Medicaid funding. Counties bear about 17 percent of the total cost of Medicaid. New York City’s local contribution is another 8 percent of the total. The federal government pays half the cost. Thus the State of New York pays only one-quarter of the cost of Medicaid.
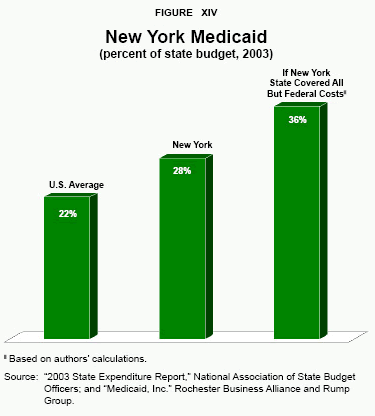
For every dollar the state spends, it can confer $4 of benefits. Politicians, therefore, are tempted to continue to confer benefits paid for by someone else. This means the state has much less incentive to economize.100 As a result, New York State spends about 28 percent of its budget on Medicaid — plus the counties’ spending — compared to about 22 percent of state budgets nationally.101 [See Figure XIV.]
According to the New York Times , many counties raised taxes more than 40 percent from 2003 to 2005. For instance, taxes in Albany County increased by about 70 percent over the past few years — largely to pay its share of Medicaid costs.102 To pay their Medicaid bills, some New York counties have cut other services:103
- Sparsely populated Chemung County closed a library two years ago.
- Chautauqua County cut back on bus routes and sheriff’s deputies.
- Oswego County reduced its work force by 16 percent and sold its nursing home.
- In 2005 Niagara County cut 96 staff positions.
Since property taxes are the main source of county revenue, Medicaid has caused substantial property tax increases. 104 According to the Public Policy Institute of New York, taxpayers living in upstate New York pay nearly $1 billion a year in additional taxes compared to an average state due to Medicaid.105 This has negatively affected the state’s economy.106 County leaders complain the tax rate is slowing business development. A 2004 Moody’s Investors Service report claims that counties in New York are facing financial trouble because of increasing costs, including employee wages and benefits, and the counties’ share of Medicaid.107
Costly Policy: Ignoring Fraud. As noted above, 10 percent of Medicaid spending nationwide may be lost to fraud.108 In New York, a former State Inspector General estimates that waste and unnecessary services that don’t rise to the level of criminality may add another 20 to 30 percentage points to this amount.109
“New York Medicaid spending equals more than one-third of the state budget.”
The New York Times found massive fraud merely by analyzing data obtained through the Freedom of Information Act. The state has failed to try reforms that other states have used successfully. It has also failed to pursue cases when fraud is found.110 A 2000 press release from the Office of the New York State Attorney General illustrates the size of the problem. On the occasion of the 25th anniversary of the New York Medicaid antifraud unit, Attorney General Eliot Spitzer’s office announced a total of $326 million in fines, overpayments and restitution had been recouped since the unit’s inception 25 years earlier.111 Yet the amount they recovered in two-and-a-half decades was equivalent to only about 7 percent of the estimated cost of fraud that occurred in 2005. In the past 15 to 20 years, the number of people dedicated to fighting Medicaid fraud in New York has fallen by about 70 percent. Interestingly, the amount of money recovered by the antifraud team has fallen by about that same percentage since 2000.112 In 2004, New York Medicaid paid about 400 million claims, but only 37 cases of suspected fraud were uncovered.113
Other states are far more aggressive in rooting out fraud. In recent years California added about 400 people to its antifraud staff. The Medicaid budgets in Ohio and Illinois are only about one-quarter of the budget in New York, but they audit three times as many providers each year.1140 The federal government is willing to pay 75 percent of the cost of beefed-up state antifraud efforts, but New York does not spend enough to receive the full federal match.
“New York uncovered only 37 cases of fraud in 2004.”
Until recently, New York counties were not allowed to police the Medicaid providers within their areas, even though they pay a significant portion of the costs. They could not investigate doctors and providers who where bilking the program with questionable billings, and were not even allowed to find out what local providers were billing Medicaid for services.115 The state alone had the power to investigate fraud. Unfortunately, the state has done a dismal job.116
In the fall of 2005, the New York State Department of Health finally allowed 12 counties to look for unusual patterns in billings from Medicaid providers that might indicate fraud.117 After examining just a small portion of the program, investigators in Rockland County discovered what appeared to be $13 million in questionable charges over a period of less than two years.118 Even when patterns of fraud are found, local officials are not allowed to prosecute, sue or even suspend the providers. Only the state Department of Health has that authority.119
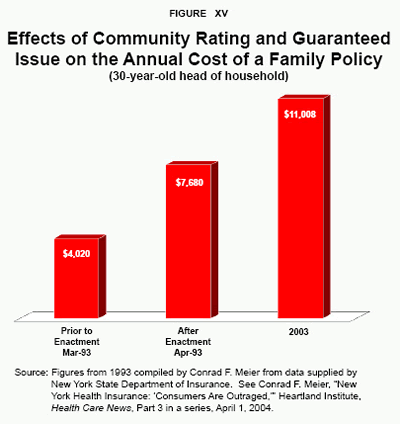
Costly Policy: Crowding Out Private Insurance . As noted, Medicaid crowds out private insurance coverage by offering a free alternative. New York exacerbated this effect by enacting two regulations in 1993 that raised the cost of private insurance : community rating and guaranteed issue . These laws allow people to obtain insurance once they become ill (guaranteed issue) and require insurers to charge the same price regardless of age and health status (community rating). As a result, young, healthier people are substantially overcharged for their insurance while older, sicker people generally pay less than their true cost of care. For instance:
- Just prior to enactment of these laws, a New York family of four headed by a 30-year-old could obtain coverage for about $4,000 per year.
- Immediately after enactment, that family’s cost rose to $7,680.
- After a decade of premium increases, health insurance now costs the same family about $11,000.120 [See Figure XV.]
Conversely, in 1993, a family headed by a 60-year-old paid $11,640 annually. Immediately after guaranteed issue and community rating were enacted this fell to $7,680 and 10 years later stood at about $11,008. So, in effect, the expected health care costs of the older, more-expensive-to-treat couple was shifted to the younger, healthier couple.
“Insurance regulations raise the cost of private coverage.”
Defenders of these laws claim that they protect consumers by guaranteeing access to coverage — especially for those who are ill and need care the most. But the only people who have an incentive to purchase coverage are those who are ill. After all, why pay premiums when you are healthy if you can always insure (at the same rate) after you get sick. But if only ill people join a health insurance pool, the cost per person will be enormously high. As more and more healthy people drop insurance and those remaining in the pool are sicker and more expensive to treat, premiums must be raised. This creates an incentive for the young and the healthy to drop their coverage or to avoid buying insurance in the first place. One study found that community rating and guaranteed issue in the small group market increased the likelihood of being uninsured by more than 28 percent.121
The Politics of Medicine. We have seen that Medicaid spending in New York is unusually high. But why do taxpayers and policymakers tolerate such high costs? New York City has an especially large number of medical schools, teaching hospitals and research centers. Higher Medicaid reimbursement rates for hospital services pay for these resources.122 New York labor unions are powerful, and hospital labor is well paid.123 In 2002, the New York State legislature increased Medicaid reimbursements for hospitals in order to raise the wages of certain health care workers.124 Although recruiting and retaining health care workers might sound like a worthy goal, the move was largely due to strong health care unions that primarily represent low-skilled workers.125 About 10 percent of New York’s nonagricultural workforce (800,000 people) is employed in health care, making providers politically powerful opponents of reform.126
Whenever fiscal restraint is suggested, reform opponents fight tooth and nail to derail the process. In 1999 the Service Employees International Union local 1199 and the Greater New York Hospital Association launched an expensive lobbying campaign warning of huge layoffs and closed hospitals.127 Again, in 2005, when Gov. Pataki announced plans to restrain Medicaid costs, the same union and the Greater New York Hospital Association ran advertisements using scare tactics to attack the plan.128
[page]If New York Medicaid were as efficient as the average state program, it could spend billions of dollars less to achieve the same health outcomes, and would have billions of dollars each year to fund tax cuts or other spending programs. Achieving average Medicaid efficiency is a modest goal. A more ambitious goal is to achieve the efficiency of the average private-sector health plan.
New York can improve Medicaid services, while controlling costs, by adopting common-sense reforms, including techniques commonly used in the private sector; by contracting with private sector providers for services; by fundamentally restructuring its program; by giving enrollees financial incentives to reduce unnecessary use of services; and by moving patients out of Medicaid and into private sector plans. As part of this reform effort, the state also needs a complete overhaul of long-term care and home health services.
Some of these reforms could be carried out by the state on its own, while others require what amounts to pro forma approval from the federal government. More aggressive reforms require specific federal waivers. [See the sidebar “Using Waivers to Implement Reforms.”] The most desirable reforms will require federal legislation.
Common-Sense Reforms
To reduce Medicaid costs, New York should begin by employing measures that are common in the private sector and that achieve results. The following are some examples.
“New York could contract with the most efficient providers for each service.”
Substituting Less-Expensive for More-Expensive Providers. Why pay more when the same quality of care is available for less? Private-sector health plans routinely contract selectively with providers, choosing to direct their enrollees to providers who charge less for the same level of quality. These plans typically require enrollees to use facilities and physicians that are “in network,” or to pay a larger share of the cost if they use providers that are “out of network.” Competition encourages potential contractors to discount services. It also improves quality by giving hospitals incentives to specialize in those services they do well.
Through specialization, hospitals can perform a large volume of procedures, or care for a large volume of patients with similar conditions, at a lower cost. Hospitals can reduce costs by eliminating inefficiencies, including unnecessary services, excessively long hospital stays, excessive compensation to noncritical staff, inefficient staffing levels, and so forth. Hospital executives will find innovative ways to cut costs when they have better incentives to do so. 129
Selective contracting can work for New York Medicaid. There are opportunities to negotiate discounts for most medical services. Other states are using competitive bidding and selective contracting for eyeglasses, medical equipment, transportation and other services. 130 For example, Medi-Cal , California ‘s Medicaid program, began selective contracting for hospital services in the early 1980s. Four years later the state was spending nearly 8 percent less than it would have without selective contracting.131 The Centers for Medicare and Medicaid Services (CMS) found that contracting reduced per diem charges for hospital stays in California about 16 percent below what they otherwise would have been. The greatest savings were in areas with stiff competition among hospitals.132
“Selective contracting can reduce costs and improve quality.”
Although New York Medicaid managed care plans are free to negotiate with providers, we have seen that there is an unfortunate conflict of interest. Many Medicaid managed care plans in New York City are administered by charity hospitals that have an incentive to use their own facilities as much as possible.
Over the last 10 years, hospital pricing in New York State has been deregulated so that private insurers are free to negotiate hospital charges for both their managed care and fee-for-service plans.133 This allows an insurer or health plan to selectively contract with hospitals for particular services and steer patients to those facilities by requiring a patient or doctor to obtain a preauthorization from the health plan before admission. Unfortunately, New York Medicaid has not taken advantage of this for hospitals serving its fee-for-service patients.134 In New York, hospital reimbursement rates for Medicaid patients are set by the state and do not vary, regardless of the hospital used.
New York Gov. George Pataki has proposed allowing Medicaid to contract for high-cost, specialty hospital services for fee-for-service patients.135 Medicaid would award contracts to selected hospitals and negotiate payment rates for services provided by those hospitals. For example, Medicaid could selectively contract specific high-cost procedures to “Centers of Excellence,” hospitals that perform a high volume of particular procedures for which there is a demonstrated relationship between volume and quality. Hospitals that don’t receive contracts would not be reimbursed for providing such services unless they were preauthorized, or the patient was admitted due to an emergency. This is a modest reform that is long overdue.136
Substituting Less-Expensive for More-Expensive Therapies. Treatment in outpatient settings, such as doctors’ offices, is generally less expensive than treatment in a hospital. However, Medicaid patients have limited access to physicians other than in public health clinics or hospital emergency rooms. Paying higher fees to physicians could increase patients’ access to health care and reduce expensive emergency room visits. The key to improving patient access is to raise reimbursement rates for examinations, tests and procedures that can be performed in a doctor’s office.
Performing more procedures in outpatient settings that were once only performed in hospitals (such as minor surgeries that don’t require an over-night stay) is a common way of reducing costs.137 A Pennsylvania study found about 10 percent of all hospitalizations for patients under age 65 are potentially avoidable. Caring for these patients in lower-cost, more appropriate settings could have saved about $2.8 billion. In some cases procedures were performed in hospitals that could have been done in outpatient clinics. In other cases, inpatient care could have been avoided by timely physician care.138
Substituting Less-Expensive for More-Expensive Drugs. Managed care health plans use a variety of techniques to control drug costs, including preferred drug lists, formularies, negotiated prices with drug companies and single-source drug distributors. For example, many plans require enrollees to use a specific mail-order drug supplier to avoid a higher copay. Health plans frequently contract with a pharmacy benefit manager (PBM) to handle drug benefits. PBMs require enrollees to obtain a preauthorization to purchase brand name drugs that aren’t on their list of preferred or formulary drugs, or to use a non-network pharmacy.
Medicaid managed care plans generally also use PBMs to manage their drug benefits. However, some states have rules and regulations that limit the ability of PBMs to control drug costs. For instance, laws that prevent a PBM from requiring the substitution of generic drugs when they exist are used in some states.139 There are several bills pending in the New York legislature that would limit the ability of PBMs to require the use of mail-order pharmacies.140 New York also has a bill pending that would require PBMs to reimburse any pharmacy willing to meet the requirements of a drug plan.
“New York could use privatesector techniques to control drug costs.”
New York Medicaid should follow the example of other states and encourage the use of less-expensive drug alternatives, where quality is the same — including therapeutic, generic and over-the-counter substitutes. In the past few years, a number of prescription drugs have been moved over the counter, and are available at a much lower cost and without the hassle of obtaining a prescription. For example, take Claritin, a drug used by allergy suffers that was formerly available only by prescription. When it became available over the counter, the price fell substantially. The current prescription version of the drug, called Clarinex, is chemically similar.141 Yet a year’s supply of Clarinex costs about $949, compared to only $280 for Claritin and less than $15 for an OTC generic equivalent.142 Another example is the prescription version of the heartburn medication Prilosec, which cost $122.99 for 30 capsules at Walgreens.com, a daily cost of about $4.10.143 Currently, Walgreens.com sells a box of over-the-counter Prilosec with 42 capsules for $25.99, or a daily cost of 62 cents.144
The drug company Glaxo recently asked the Food and Drug Administration for the right to sell the obesity drug Xenical (Orlistat) over the counter. This might be an effective medication for overweight Medicaid patients. Glaxo expects the over-the-counter version to cost about two-thirds less than the prescription price.145 However, doctors will continue to prescribe the prescription version because it will cost Medicaid patients less out of pocket, even if they are charged a small copay (usually $3).
Unfortunately, Medicaid (and Medicare) will not pay for over-the-counter drugs, even if they can be substituted for more-expensive prescription drug therapies. Furthermore, there is a danger that drug formularies will become bureaucratic obstacles to needed therapies. One way to resolve these problems is to allow Medicaid patients to control some of the funds for their own health care. New York should consider allowing patients, rather than bureaucrats, to make these choices.
“Patient satisfaction with Cash and Counseling programs is almost 100 percent!”
Arranging Cash Accounts for Patients with Disabilities. A number of states have received waivers that allow them set up cash accounts which disabled Medicaid recipients can use to manage their own health care dollars and have direct control over the purchase of needed services.146 These programs, called “Cash and Counseling,” use a defined contribution approach.147 The patient is given a set dollar contribution and is free to choose his or her providers. The programs also involve counseling to assure that the patient is well-informed. Under traditional Medicaid, the states select the providers without patient input. Under this program, the patient can now choose his or her own provider. Surveys of participants in the program show that they have a higher quality of life with fewer unmet health needs.148 Remarkably, patient satisfaction is almost 100 percent.149
Reducing Errors in Diagnosis and Care. Eliminating errors in diagnosis can lead to better treatment at lower cost.150 Some of the most dangerous and costly problems in our health system include drug misuse, antibiotic overuse, preventable hospital-acquired infections, and the under-diagnosis and mistreatment of chronic conditions.151 The Institute of Medicine found that between 44,000 and 98,000 people die each year from preventable medical errors.152 A recent report found that nearly 100,000 people may die annually of hospital-inquired infections alone.153
Hospital-acquired infections are the fourth largest killer in America. Even more frightening, a new and deadly infection known as MRSA (methicillin-resistant Staphylococcus auerus ) does not respond to commonly used antibiotics. In 2003, 57 percent of staph infections were a result of MRSA, and the percentage is rising. Additionally, hospital infections add $30 billion annually to the cost of health care. MRSA is commonly spread from patient to patient by doctors and hospital personnel and could be prevented by simple hygiene measures like washing hands before entering each patient’s room and changing outer garments between tasks. The problem is getting hospitals to enforce such measures. Some hospitals are taking aggressive steps, and both state and federal policies are changing to reduce this spreading epidemic:
- Some hospitals such as the University of Pittsburgh system are imposing stiff penalties, including termination and suspension of practice privileges, for staff and doctors who fail to wash their hands.
- Some states have passed laws that publicize a hospital’s “infection report card,” allowing patients to compare hospital infection rates before considering surgery; ideally, hospitals would compete for patients through reducing infection rates.
- Currently, the Centers for Disease Control and Prevention collect data on hospital infection rates, but it is kept secret; this information should be made available to the public.154
Many Medicaid hospital patients are infected with MRSA. Medicaid should demand that providers institute infection control programs. Payments to hospitals could be adjusted to reward facilities that achieve low infection rates and penalize those with higher infection rates. Hospital-acquired infections are a type of medical error that should be measured for quality ratings and addressed in contracts with providers.
Contracting with the Private Sector . Instead of paying for Medicaid services on a fee-for-service basis, New York Medicaid could contract with hospitals, clinics and physicians for specific services and therapies. This would allow the program to coordinate the care provided and establish quality standards.
Disease Management and Care Coordination. Many patients have multiple illnesses that require treatment by different specialists or in different facilities.155 In many cases they see numerous doctors who prescribe numerous medications to treat a variety of health problems. Unfortunately, these health care providers often have little (if any) contact with one another. The lack of coordination of care leads to poor quality health care and medical errors, such as harmful drug interactions.
“Coordinated care could reduce harmful drug interactions.”
Coordinating care typically involves a case manager who reviews the patient’s medical history and claims data, ensures that providers communicate with each other about the patient’s condition, and monitors the patient’s progress. The program allows health care providers and state social service agencies to exchange relevant information about all the services received by a patient and share it appropriately.
Recent studies have found that seniors often take too many medications – many of which are contraindicated. About 20 percent of seniors have at least one prescription each year that is questionable. All told, about seven million seniors are taking unsuitable drugs.156
Often, a medication is used merely to combat a side effect of another medication.157 Besides ensuring that appropriate care is given and clinical protocols are followed, care coordination can also reduce the risk of adverse drug interactions from inappropriate or contraindicated drugs. A Robert Wood Johnson-funded demonstration project to improve care coordination reduced medications judged to be potentially inappropriate by more than one-third (36 percent) over the course of 18 months.158
Disease management involves developing a treatment plan based on current treatment protocols for patients and training them how to the follow protocols.159 With the help of a case manager, patients formulate a plan for the control and treatment of their condition. The plan is essentially a list of established guidelines indicating which actions to take in response to various symptoms.160 Although monitored by a physician, much of the day-to-day care is administered by patients themselves, so training is a necessary part of such programs.
“Patients can be trained to manage chronic conditions.”
Self-Managed Care. Patients can also be trained to manage their own care, including administering drugs, monitoring vital signs, caring for wounds and so forth. For example, numerous studies have shown considerable benefit from self-management training for patients with Type 2 diabetes.161 Patients can be trained to inject insulin, monitor and maintain a log of blood glucose levels, and use the results to adjust their dietary intake, activity levels and medicine doses.162 In addition, many diabetics can reduce reliance on medications and control their diabetes completely by adhering to a meal plan, losing weight and exercising.163
Diabetes is the sixth leading cause of death by disease in the United States. Diabetics spend four times more money on health care than nondiabetics.164 By one estimate, nearly $2.5 billion in annual hospital costs for diabetes complications could be averted with appropriate care.165
Uncontrolled asthma is another chronic disease that creates large costs for Medicaid, as well as private insurers.166 The Asthma and Allergy Foundations of America estimates nearly 20 million Americans suffer from asthma — resulting in 500,000 hospital stays each year.167 More than 2.5 million school-age children suffer from asthma, missing nearly 15 million school days per year. The economic loss averages out to nearly $800 per child per year.168 A Dutch study comparing self-management to usual care found that those monitoring their own asthma achieved a savings of about 7 percent the first year and a 28 percent savings the second year compared to those in standard care with a primary physician.169
Caring for Special-Needs Patients. The problems of people with disabilities and chronic conditions range from schizophrenia to mental retardation to blindness to diabetes. These conditions require special therapies and specialists that Medicaid patients have difficulty accessing. Managed care plans that receive a payment for each enrollee that is not adjusted for their cost of care have an incentive to avoid enrolling them or to skimp on care. Medicaid should contract with specialists and specialized facilities for these patients, and pay risk-adjusted premiums based on the cost of care and incentives for performance (discussed below). For example, a network providing care for psychiatric patients could be given incentives to use outpatient therapy and drug treatment rather than more costly institutional care when it can achieve the same therapeutic outcomes.
The many different health needs of these groups make it unlikely that a single private insurer will insure the whole group, as a group. The state of Florida contracts with various private sector entities to serve people with specific types of disabilities. This allows benefits to be tailored to the needs of the individual enrollee.170 New York should explore such opportunities. For example, different providers could serve the mentally ill, the physically disabled, the drug addicted and so forth. The comparative advantage of these various providers would reduce costs and increase the quality of service.171
The services provided by contractors could be limited to those related to the disability. Regular Medicaid could provide other health services, or the disabled/chronically ill could be offered premium support to purchase other coverage. Higher-cost individuals with disabilities could be provided a larger personal health account (discussed below) to cover their needs. This would allow them a choice of benefits and health plans similar to the HIFA waivers in Florida and South Carolina.
“Financial incentives to providers can improve performance.”
Pay for Performance. A 2002 National Academy of Sciences report recommended that all federal health programs begin paying for quality care rather than paying for services rendered.172 The NAS says the programs should initially focus on the treatment of health conditions that account for most of the spending in public health programs, such as diabetes, depression, osteoporosis, asthma, heart disease and stroke. Medicare has begun implementing pay-for-performance initiatives.173
If New York only paid providers for outcomes it deemed worthwhile, it might reap significant savings. For example, Bridges to Excellence, an initiative of the Robert Wood Johnson Foundation, pays additional funds to physicians of diabetics in private health plans who achieve certain quality standards. The cost per diabetic is about $175, but that is only half of the estimated saving per diabetic patient from the reduction in treatment complications.174
Pursuing Fraud Aggressively. According to the New York Times , Medicaid has become “an economic engine that fuels one of the state’s biggest industries.”175 Any attempt to rein in spending has been fought bitterly by those profiting from them. Doctors, drug makers, hospitals and hospital workers’ unions have all fought attempts to provide tighter oversight of Medicaid spending.
State Medicaid claims data and other medical information could be used to identify fraud, abuse, overuse and unnecessary care, but seldom are. Most abuse is identified through tips or other unreliable means. Establishing a state database of billing information on Medicaid providers in New York would be useful. If one provider’s Medicaid billing began to increase significantly, case workers could quickly identify and check into the trend.176 The provisions of current “whistleblower” laws that allow private citizens who identify fraudulent providers to receive some of the recovered funds may be useful.
Software firms have developed information technology to more easily examine Medicaid billings using a number of different criteria. Salient Corporation is working with Chemung County, New York, to better manage Medicaid spending. Using Salient Corporation’s Muni-Minder software, officials can analyze the billings of individual suppliers, products and services utilization, or individuals, allowing them to uncover inefficiency, waste and abuse anywhere in the program. For example, Muni-Minder allows investigators to quickly identify the number and cost of prescriptions for brand-name drugs filled when a generic was available. A chart of the amount per recipient spent for any provider is easily created with only a few keystrokes.177
“Counties can be given financial incentives to uncover fraud.”
New York counties should have the power to investigate Medicaid billings of all providers and utilization of enrollees within their boundaries. They should, at the very least, have the authority to suspend providers and suppliers suspected of fraud. In cases where there is substantial evidence, counties should also have the authority to prosecute Medicaid fraud within their county. Since local governments pay only one-fourth of the cost of Medicaid, the benefit to them of discovering and eliminating fraud is only 25 cents on the dollar. If they were allowed to keep half of any funds recovered, they would have an incentive to double their efforts.
Finally, New York automatically enrolls recipients of Supplemental Security Income (SSI) in Medicaid. This encourages fraud, because the conditions which qualify many individuals for SSI are difficult to diagnose and easy to fake. New York could better determine who qualifies for Medicaid disability coverage by separating it from SSI coverage. It could provide additional resources to the appropriate screening bureau or create a panel to judge whether individuals are truly disabled. Savings from removing the unqualified from the rolls would serve as the funding source.
Structural Reforms
New York should reform the way in which it finances Medicaid, and consider reform of private insurance regulations.
Abolishing Unfunded Mandates. New York requires counties to contribute to the cost of Medicaid. Since Medicaid spending is determined by the state government, the way the program is financed violates the principle that those who spend the money should bear the responsibility of paying for it.
To address the growing tax burden on the counties, in 2005 the state capped the rate of increase in the counties’ payments. After three years, the annual increase in county Medicaid funding will be permanently capped at 3 percent.178 A further step would be for the state to assume the local share of Medicaid financing. However, a recent report suggests that shifting the local financing share to the state income tax would not save property taxpayers in upstate New York since they would have to pay higher income taxes to make up the counties’ share currently paid for with property taxes. The Public Policy Institute of New York State estimates a takeover of local county Medicaid bills by the state would increase the income tax burden of upstate New York by $1.08 billion but would only reduce property taxes by $815 million.179 However, if Medicaid were fully funded by the state, voters would be better able to identify and hold accountable the level of government responsible for their tax increases. This is because New York legislators would have to appropriate funds and raise taxes for any new spending they may be tempted to mandate.
Making Block Grants to Local Governments. One solution to this financing dilemma is for New York state to block grant the funds to localities, and let them locally manage their Medicaid dollars as well as spending on free care by public hospitals and clinics. This would give them more flexibility than state Medicaid regulations and reimbursement rates currently allow.
Deregulating Private Insurance. One reason for Medicaid expansions in recent years is the rising cost of private health insurance. Contributing to that rise are regulations that raise the cost of health care. State insurance laws regulate the premiums that can be charged and to whom an insurer must sell coverage. In many cases, they specify benefits that policies must provide.
Community rating, as we have seen, charges enrollees the same premium regardless of health status. In doing so, it essentially overcharges young, healthy individuals to cross-subsidize older, less healthy individuals. Enrollees who are overcharged are prone to drop their coverage. Guaranteed issue makes it easy for them to wait to obtain insurance until after they become sick. With fewer and fewer healthy individuals to offset the sick, the risk pool becomes increasingly unhealthy. Over time, this cycle causes premiums to skyrocket. Insurance becomes unaffordable.
“Risk pools can cover highcost patients.”
Direct state subsidies are a better way than community rating and guaranteed issue to cover patients who are uninsurable due to chronic health conditions. Thirty-two states have some type of high-risk pool for medically uninsurable residents. Those allowed to join generally have preexisting conditions that make insurance prohibitively expensive or impossible to obtain on their own, but they are not necessarily indigent or low-income. Each state program differs slightly, and maximum lifetime benefits vary. Most have waiting lists to join or waiting periods before covering preexisting conditions. The pools are state-subsidized and are expected to lose money.180
States insurance regulations require private insurers (and often public programs) to cover more than 1,800 specific benefits and service providers (such as acupuncturists and chiropractors).181 These mandates raise the cost of health insurance. Economists estimate that as many as 25 percent of the uninsured are priced out of the market for health insurance due to cost-increasing regulations.182 There are 43 mandated benefits and types of providers in New York state. Although New York has fewer mandates than Minnesota (60) and Florida (50), it has more than Michigan (25) and Wisconsin (29).183
Health Opportunity Programs
Consumer-driven health accounts are a way to give Medicaid patients financial incentives to reduce unnecessary use of medical services and to use those services (or make those lifestyle changes) that will improve their health. Legislation has been introduced in Congress that would establish a five-year demonstration project to allow 10 state Medicaid programs to set up “Health Opportunity Accounts” (HOAs) for Medicaid recipients, similar to Health Savings Accounts (HSAs).184 Proponents hope these accounts will create an awareness of the cost of health care and inject an element of consumerism into the purchase of medical services. Under this proposal, states would receive federal matching funds to contribute up to $1,000 per child and $2,500 per adult into the HOAs. Like personal health accounts in South Carolina and Florida, HOAs could be used to purchase a variety of medical goods and services, and unused funds would be available for future use by participants.185
“Health Savings Accounts let patients control some of the dollars spent on their care.”
When patients have the proper financial incentives, they will be better consumers of health care. Health Savings Accounts (HSA) are one way the private sector is providing such incentives. Innovative state Medicaid programs are finding ways to integrate such accounts into their programs using federal waivers. New York should consider establishing such accounts.
Flexible Spending Accounts in Florida . For example, a new pilot program in Florida is designed to improve outcomes by providing Medicaid enrollees with incentives to become actively involved in their care and treatment. Deposits will be made to a type of flexible spending account (FSA) for enrollees who practice healthy lifestyles. They can use the funds to purchase health care goods and services not covered by their plan. A panel will ultimately decide which activities qualify for this “enhanced benefit credit,” but they will likely include such things as participating in wellness programs, obtaining annual immunizations, or participating in disease management, smoking cessation and weight loss programs. In many cases, participants who leave the Medicaid program will have access to the funds for up to three years and can use them to pay premiums for private insurance.186
Personal Health Accounts in South Carolina . South Carolina plans to allow people to manage their own health care dollars by establishing Personal Health Accounts (PHAs), similar to HSAs.187 They will be able to use the funds to pay for medical services not covered by Medicaid plans or to pay premiums for coverage under their employer’s plan. [See the sidebar “Medicaid Reform in South Carolina.”]
Since PHAs would be wholly or partly funded with taxpayer dollars, they should be restricted to the payment of medical bills and insurance premiums. Beneficiaries who consume health care wisely and see their PHA balances grow could use the funds for medical services not covered by their health plan. And in the future, they would be able to use unspent balances to pay insurance premiums and buy medical care directly after they leave the Medicaid rolls. Through this account, beneficiaries would manage some of their own health care dollars and thus have incentives to make prudent health care choices.
“Patients can use accounts to purchase services.”
One objection to PHAs is the belief that the poor will forgo needed health care to accrue more cash. However, through a debit card, the state could ensure that the recipient completed certain medical procedures such as child immunizations or prenatal care before accessing any cash. The recipient could then use his or her remaining PHA funds for other health, social, child education or job training needs.
Another objection to allowing Medicaid beneficiaries to exercise choice in health care providers is that the poor, elderly, blind and disabled either lack the ability to choose between plans or may be hood-winked by unethical sales people. Although this may be true of certain populations, it isn’t true for most Medicaid recipients. Evidence shows that for certain services, the poor have just as much ability to choose as the middle class.188 Even individuals with mild cognitive disabilities can participate in decision-making regarding their own care if given the opportunity to do so, according to research by the San Francisco-based Family Caregiver Alliance. This might improve their satisfaction, since their preferences often differ from those of family caregivers.189
Alternatives to Medicaid
Economists have long known that competition among producers leaves consumers better off by providing a wider range goods and services at lower prices. In order to increase their profitability, competing firms also have an incentive to seek out information on goods or services their customers might find valuable.
Creating Competition to Insure Medicaid Enrollees. One way to provide an incentive for insurers to compete for the business of Medicaid enrollees is for the state to create a marketplace where providers offer prepaid services to beneficiaries. The role of the state would change from being the buyer of health care to facilitating a real market place in Medicaid.190 The way this might work is for the state to underwrite actuarially fair credits for enrollees to purchase services from providers. Properly designed risk-adjusted payments could avoid the problem of “cherry picking” healthier (that is, cheap to treat) enrollees. Software is available for risk-adjustment.191
An additional method to avoid “cherry picking” is to require an actuarial payment from one provider to another when enrollees switch plans.192 If a chronically ill enrollee leaves one plan for another, they would be required to make a payment to the new health plan. This would make firms less afraid to enroll chronically ill people since a payment would accompany the enrollee. It would also induce providers to provide chronic disease management to prevent enrollees from leaving.193
To further encourage participation in disease management and healthy behaviors, the state could provide a reverse health savings account. This is a type of flexible spending account where enrollees earn credits in return for participating in programs that improve health. These credits could be used to pay out-of-pocket costs. Florida currently is experimenting with this idea in its Medicaid reform plan.194
Encouraging Private Insurance. New York Medicaid has a very rich benefits package. In general, taxpayers generally have lower benefits in their private health insurance plans than those provided to Medicaid enrollees at taxpayer expense. This is unfair and unwise. It is unfair because taxpayers should not be forced to provide others with health benefits more generous than they purchase for themselves and their families. It is unwise because Medicaid recipients are largely insulated from many of the cost-controlling, quality-improving innovations that are available to private sector plans.
“Premium subsidies can replace Medicaid coverage.”
Private sector plans may appear less generous on paper than the current Medicaid program, but they usually allow enrollees to access a greater range of providers and facilities. Enrollees in a Florida pilot program will be allowed to use their Medicaid funds to pay premiums for employer-sponsored plans where they work. New York Medicaid patients should be allowed to enroll in private sector plans, including employer plans and individually owned insurance. They should also be allowed to enroll in the same plans that cover state employees.
Private sector plans have incentives to control costs and improve quality when they compete for customers in the marketplace. Medicaid patients should be allowed to benefit from such competition. The Florida program would allow some Medicaid beneficiaries to choose coverage from among competing private insurers. This would essentially move Florida Medicaid from a defined benefit entitlement to a defined contribution plan.195 Beneficiaries will receive risk-adjusted credits that reflect their health status with which to purchase managed care plans from providers.196
They will be able to choose among competing plans with different benefit packages.197 Counselors will assist patients in picking their benefit package.
Paying for Long-Term Care
Although long-term care is an optional benefit, it is one of the fastest growing areas of state Medicaid spending. Every state provides this benefit, and not just to the poor. Medicaid is paying for the care of a growing number of middle-class seniors. When they retire, most Medicare enrollees do not meet Medicaid income and asset tests for long-term care coverage. However, Medicare has annual and lifetime maximum benefits for nursing home care, which it provides mainly for rehabilitation following injury, illness or surgery. Seniors in need of long-term care who max-out their Medicare coverage, or those who need custodial care rather than medical treatment, must pay the cost out of pocket. However, seniors who exhaust their assets paying for nursing home care may be eligible for Medicaid to pick up the cost, if their incomes are low enough. This provides incentives for seniors to arrange their financial affairs just to meet asset and income tests for Medicaid long-term care benefits.
It is somewhat surprising that more seniors are qualifying for Medicaid long-term care coverage, since the poverty rate among seniors is the lowest of any age group. Furthermore, as a group, seniors have more assets than any other age cohort. According to the U.S. Census Bureau, at all income levels individuals reach age 65 with more household wealth than at any other time in their lives. Wealthier seniors arguably have enough assets to cover the cost of all but the longest nursing home stay. Senior households aged 65 and older have assets worth an average of $108,885, including home equity.198
“Seniors transfer assets to qualify for Medicaid.”
There are several methods that allow individuals to legally impoverish themselves. They can 1) transfer assets to their children, 2) divorce, and 3) set up irrevocable (Miller) trusts. For seniors following these strategies in order to have Medicaid pay for their long-term care, advanced planning is important: they must make their financial arrangements several years before the need arises, and once the need for care arises, they must get into a good-quality private nursing home and be able to pay for the first year’s care.
Advanced planning is important because when a state is determining the eligibility of a senior for Medicaid coverage, federal law allows it to “look back” and include as assets any funds that a senior transferred within three years of applying for long-term care benefits.199 An entire industry of attorneys practicing “elder law” has sprung up in recent years to help seniors transfer assets so that they will qualify.
For instance, a growing number of seniors have established Miller Trusts, also known as Qualified Income Trusts.200 Seniors may assign their investment income to the trust, which is designed to limit how the funds are distributed. Trust funds can be used to make certain payments including insurance premiums, support for a spouse, and $60 per month for personal needs. These trusts effectively allow people to hold back income that otherwise would go to reduce Medicaid’s cost for long-term care. Most asset transfers by seniors are not made to skirt Medicaid asset tests, and that makes it difficult to identify abuses; according to the 2002 Health and Retirement Study of the National Institute on Aging, one in five elderly households (22 percent) transferred assets in the prior two years.201
Another strategy to transfer assets is a divorce where the “well spouse” retains joint property while the “ill spouse” receives little of value.
“Home care costs much less than nursing-home care.”
Choosing a good nursing home is also important. Seniors can secure places in more expensive, higher-quality nursing homes by proving they have sufficient funds to pay for at least one year of care . Once their funds are exhausted, they generally cannot be discharged because of inability to continue paying their bills.202 At this point they apply for Medicaid. The facility typically accepts the Medicaid reimbursement, while providing care at a loss. To the senior, this is preferable to the typical Medicaid nursing home. Medicaid typically pays nursing homes a fixed daily rate per resident. Only a limited number of nursing home beds are available at such low rates, and there have been problems with the quality of their care. [ For a discussion of steps New York and other states can take to improve the quality of nursing home care, see the side bar on Improving Nursing Home Quality.]
Encouraging Community Care over Institutional Care. Medicaid encourages institutional care over home care. Although many states are beginning to change, they need to increase their use of less-expensive home care.203 Home care often costs only half as much as a nursing home.204 In some high-cost areas, the cost savings from home care may be even greater. For instance, home care in Washington, D.C., costs less than one-third as much as nursing home care. In Manhattan, it costs only about 20 percent as much as a year-long stay in a nursing home.205 Home providers can provide a range of medical services, including occupational or physical therapy. Nonmedical services that can be provided through home care include meals, and help bathing and dressing.206 However, as noted previously, New York spends more on home care, personal care and long-term care than other states, so it doesn’t appear the state is saving money. Other states’ home and personal care programs are designed as alternatives to nursing home care, rather than functioning as supplemental benefits. New York should follow their lead.
For example, Oregon, Washington and Wisconsin expanded home- and community-based care to help control rapidly increasing institutional care expenditures. These states were able to serve more people while controlling the growth in overall long-term care spending. Between 1982 and 1992 the combined number of nursing home beds in Oregon, Washington and Wisconsin declined by 1.3 percent, while total nursing facility beds nationwide increased by 20.5 percent.207
Ohio’s Commission to Reform Medicaid has proposed rewarding families that choose lower-cost options that save the state money, such as care in the home or community. This would allow an elderly parent living with family members to receive a few hours of home or personal care per week that could delay entry into a nursing home for a year. The financial incentive could be to exclude some assets from eligibility tests or shield them from cost recovery.208
“Seniors can be given financial incentives to choose home care.”
For example, the estates of seniors who received a few hours per week of home care might be subject to only 25 percent recapture of the costs paid by Medicaid. The estates of seniors cared for in the community might only be subject to recapture of 50 percent of the associated costs paid by Medicaid. However, as an incentive to family members to seek a lower-cost option for seniors needing long-term care, residents living in nursing homes would be subject to 100 percent recapture of the long-term care expenses paid by Medicaid.
Encouraging Private Insurance Coverage. Private insurance is available to cover nursing home and in-home care, but few seniors purchase them. There are limited state programs to encourage more private coverage. A pilot project in four states — New York, Connecticut, California and Indiana — called the Partnerships for Long-Term Care (PLTC) provides financial incentives to purchase long-term care insurance. The plan allows people to shelter their assets by purchasing a qualifying private insurance policy with a defined amount of coverage. When a policyholder enters a nursing home he or she first relies on the insurance. When the insurance is exhausted, special eligibility rules allow them to receive Medicaid benefits while retaining assets equal to the value of the policy.
“Long-term care insurance helps seniors shelter assets.”
In California and Connecticut Partnership programs, individuals purchase coverage from a number of competing private insurers. For each dollar of coverage, they protect a dollar’s worth of assets. For instance, a long-term care policy with $120,000 in benefits allows an individual to shelter $120,000 in assets and still qualify for Medicaid long-term care. Since most nursing home stays are less than one year, very few of those who have purchased policies have applied for Medicaid benefits.
In New York, however, Partnership policies are required to cover the cost of three years of nursing home care or six years of home care — potentially, $200,000 worth of services. In return, participants can shelter all their assets, not just an amount equal to the coverage received.209 Indiana uses a hybrid of the two approaches.
In 2004, just over 45,000 New Yorkers held Partnership-approved policies, less than 2 percent of the senior population. It appears the annual increase in policyholders is about 5,000.210 One way to encourage more New Yorkers to obtain coverage is to reduce coverage limits. The average length of stay for discharged nursing home residents is just under one year (272 days).211 The actuarial firm Milliman USA conducted a study of people with unlimited insurance coverage, and found that less than 8 percent of claims were for periods lasting more than 48 months. More than three-fourths of claims (76.7 percent) were less than two years.212
New York should use the approach of California and Connecticut, allowing Partnership policies to shelter assets equal to the value of the policy selected by the beneficiaries, whether one or two years, or unlimited coverage. This would allow individuals to select the amount of coverage, according to their tolerance for risk.
Encouraging the Use of Assets to Finance Long-Term Care. There are more than 13 million households headed by people aged 62 years or older. Many seniors own their homes, but are reluctant to tap their equity to pay for nursing home care out of fear of losing their homes. However, they could obtain a reverse mortgage, which is a home loan that does not have to be repaid as long as the owner (which could include the spouse of a nursing home resident) lives in the house.213 Six million of these households could each access more than $72,000 in home equity using reverse mortgages.214 This would pay for a year or more of nursing home care and two or more years of home care in most areas.215 (The cost of nursing home facilities varies considerably, even within New York state. For instance, a year-long stay would cost more than $115,000 at a facility on Long Island, but less than $72,000 in central New York.)
Currently, seniors rarely use reverse mortgages for long-term care. Why should they? Home equity is generally an exempt asset when qualifying for Medicaid long-term care. Since seniors can obtain long-term care without taking out a reverse mortgage, they have little reason to do so. The solution is to remove the home-equity exemption and specify that seniors must first exhaust home equity using a reverse mortgage before qualifying for Medicaid long-term care. 216 An added benefit is that more people may plan ahead and purchase long-term care insurance if they are not allowed to shelter their largest asset while still qualifying for Medicaid.
A home sales contract is similar to a reverse mortgage; it allows a senior couple to sell their home now, but live in it the rest of their lives. This would be appealing to married seniors and seniors who are getting rehabilitative care and expect to leave the nursing home.
“There are other ways seniors can finance long-term care.”
Seniors with life insurance policies who enter a long-term care facility may qualify for viatical settlements to assist them with expenses. Viatical settlements are financial arrangements that allow terminally ill individuals to sell their life insurance policies at a discount in return for cash. The purchasing firm pays less than face value (generally 50 percent to 80 percent) depending upon life expectancy. The purchaser pays any remaining premiums and assumes the risk for life expectancy. In other words, the insured is not penalized for living longer than expected. One problem is that not everyone qualifies for this arrangement. Insurers, providers and states use different definitions for what they consider terminal illness. For instance, seniors expected to live more than five years likely will not qualify for this arrangement.217
According to the Federal Trade Commission, there are also tax implications that can be quite complicated. Viatical settlements where life expectancy is less than two years are exempt from federal taxes — although some states do not provide this exemption.218
The federal government should facilitate viatical arrangements and life settlements for people facing long-term care, including limiting tax liability. It should require such arrangements for life insurance owned by individuals applying for Medicaid long-term care coverage. Transfer of ownership of life insurance policies should be treated the same way as other asset transfers.
Increasing Estate Recovery. When beneficiaries die, states can recover the cost of their nursing home care from their estates. That could include a house, for example, since a home is typically not included in assets for determining Medicaid eligibility. Federal law also permits states to recover personal and real property in which the individual has an interest or legal title that aren’t included in the probated estate. Some states are aggressively pursing estate recovery, and all states receive federal funds to do so.219
Federal law also allows states to “look-back” at asset transfers three years from the time of death.
Future legislation should require that any funds placed in qualified income trusts be considered income for determining Medicaid eligibility. It could even eliminate the use of trusts that reduce current income. Furthermore, property settlements in divorces made prior to Medicaid eligibility should be subject to the same three-year rule as other divisions of property.
Holding Children Responsible for Their Parents’ Care . States should seek to recover current nursing home costs from beneficiaries’ families who are financially able to pay.220 About 30 states currently have filial responsibility statutes that require adult children to care for their indigent elderly parents. The statutes vary, but can force adult children to reimburse the state for programs or institutions that have cared for an indigent parent. There is no uniform federal filial responsibility statute. Medicaid costs could be reduced if states began to systematically enforce filial responsibility laws. One benefit would be that when adult children understand they may be responsible for a portion of their indigent parents long-term care needs, they will have an incentive to encourage their parents to plan for the future.
“Children should be asked to contribute to their parents’ care.”
States with filial responsibility statutes take a variety of approaches to enforcement: 21 allow some sort of civil court action to obtain financial support (or cost recovery) and 12 specify a criminal penalty for filial nonsupport; three states allow both civil and criminal actions. Children’s liability is limited under a variety of conditions. These include whether the adult child has enough income to actually contribute and if they were abandoned or deserted by the parent.
One possibility is for a state to automatically consider an adult child able to pay toward care of an indigent parent unless they file a public notice that they are not responsible for the debts of the parent. Additionally, adult children who refuse to support their parents could be required to relinquish inheritance rights and rights to any trust set up for them by a parent.
[page]New York can take many steps on its own to improve its Medicaid program. But federal legislative changes are required to fundamentally reform the system.
Block Grant Federal Funds. In the 1990s there were proposals in Congress to give states more flexibility and responsibility through a block grant.221 A report by the National Governors Association suggests an inflation-indexed block of money for long-term care. The states would then decide who and how much to cover.222 This is probably a good idea for all portions of Medicaid. In 2003, the Bush Administration proposed converting the federal match to a fixed block grant to the states. 223 This is similar to how Congress allocates federal funds for state welfare programs. One of the advantages of a block grant is predictability.224 It would limit the federal government’s financial exposure while allowing states to design programs to meet their unique needs with maximum flexibility.
Under the current system, every time New York Medicaid wastes a dollar, one-half of the waste is paid for by the federal government. Every time New York Medicaid eliminates a dollar of waste, only half the savings stays in New York , while the remainder is realized in Washington , D.C. With a block grant, New York as a state would realize the full benefits of every dollar saved and pay the full costs of every dollar of additional spending. Put differently, a block grant would allow New York to realize the full benefits of its good decisions and pay the full costs of its bad decisions.
In the current climate, a block grant to all states is unlikely. However, if five or six states requested a block grant, Congress in all probability would grant the request.
“Medicaid funds could be block granted to the states.”
A worry states have with a block grant is that the federal government might renege on the deal. A block grant converts a defined benefit entitlement into a defined contribution. Under the former system, payments are based on the state’s willingness to spend. Under the latter, spending is based on the federal government’s willingness to pay. So wouldn’t the states be at the mercy of the federal government under a block grant system?
One solution to this problem is to write into the pilot program the specific formula that determines how much New York and other participating states receive. Specifically, if New York currently receives 13 percent of all federal Medicaid dollars, the agreement could specify that the state will continue to receive 13 percent of all federal Medicaid dollars for the next few years.
A further advantage of the block grant approach is that all the funds the states currently receive would be at their disposal to allocate as they choose. Currently, Medicaid is a convoluted system of matching grants with separate pots of money for specific purposes. One of these pots is disproportionate share hospital (DSH) payments, which are designed to reimburse hospitals that care for a larger than average number of indigent patients. Texas is a perfect example of some of the ways this fractured funding distorts incentives.
In 2003, the Texas legislature passed a law requiring the Texas Department of Health and Human Services (HHS) to provide Medicaid services in the most efficient manner possible. Subsequent research found Medicaid HMOs were the most cost-effective way to provide services. In early 2005 the director of HHS announced plans to expand a pilot project and place 400,000 Medicaid recipients into Medicaid HMOs for an estimated savings of $401 million dollars over two years. However, Texas HHS was fought by public hospitals that stood to lose DSH payments. The argument was that Texas hospitals stood to lose more federal matching funds and DSH funds than the proposed would save by providing care in a more efficient manner.
Under a block grant, a state would have the flexibility to use DSH payments to reimburse hospitals, or use the funds to cover indigent patients in more efficient ways. This would allow it to target funds to the most appropriate facility and pay for care only through the most efficient provider.225 For instance, a state could use the funds to reimburse neighborhood clinics or community hospitals rather than pay for expensive care in emergency rooms. It might also provide an incentive for hospital facilities to provide indigent care in the most efficient manner rather than seeking federal funds for care rendered in their emergency departments.
Allow Cost-Sharing. Copayments and increased cost-sharing have been used successfully by private health insurers for years to reduce unnecessary use of medical services.226 Out-of-pocket payments boost consumers’ incentives to consume goods and services wisely. One way to apply this principle to Medicaid is to offer enrollees who wish to purchase a drug not on the formulary the opportunity to receive the drug if they make a higher copayment. If a physician thinks a nonformulary drug offers significant benefits, copayments could be waived.
“When patients pay, they reduce their use of unnecessary medical services.”
Currently, states are only allowed to charge nominal copayments of $1 to $3 for medical services and prescription drugs, unless they receive a waiver.227 Certain mandatory populations, such as pregnant women and poor children, are exempt from cost-sharing. The National Governors Association favors allowing states to require cost-sharing and copayments from both optional and mandatory populations at their discretion.
However, cost-sharing should not be imposed for those services and treatments that have been shown to reduce preventable medical costs. States should, for example, provide first-dollar coverage for asthma treatments, because hospitalizations for severe asthma attacks are costly.228 But doctor visits for routine sore throats are almost always unnecessary; they occur so frequently because they cost the patient very little.
Repeal Limits on Long-Term Care Partnerships. An inflexible federal law — the Omnibus Reconciliation Act of 1993 — effectively limited Long-Term Care Partnerships to the four states that already had pilot projects.229 The law also prevented other states from waiving the estate recovery requirement as an incentive for individuals to obtain qualifying long-term care policies.
New federal legislation allows states to begin to offer these incentives again. However, the federal government still needs to clarify a few remaining details, such as how individuals can retain protection when moving from one state to another. 230
Make Long-Term Care Premiums Tax-Deductible. Commercial long-term care insurance is available, but few seniors — and fewer working-age adults — purchase it, even though 40 percent of nursing home residents are under age 65. One reason is that long-term care insurance is not given the same tax treatment as other health insurance.
People can use their health savings accounts (HSAs) as well as their flexible spending accounts (FSAs) to pay a limited amount of long-term care premiums tax free. Unfortunately, many people don’t have access to either HSAs or FSAs. And the amount of long-term care premiums that are non-taxable is limited based on age. For instance, individuals under 40 years of age can only deduct $260 per year while those 41 to 50 can deduct $490, 51-to 60-year-olds can deduct $980, 61-to 70-year-olds can deduct $2,600, and seniors over 70 can deduct $3,250. 231
Long-term care premiums are a medical expense under section 213(d) of the tax code, but those expenses are only deductible to the extent that they exceed 7.5 percent of adjusted gross income.
[page]“Medicaid reform is not simple, but it is essential.”
An alternative to uncontrolled Medicaid growth exists. It is not simple, and in many ways it is unsettling. It will require standing up to powerful interest groups. It will require dedicated staff. The alternative will not stop Medicaid budget growth, but it will lower the rate of that growth. It will provide policymakers with significantly greater control over costs and improve health outcomes. It will introduce some of the efficiency of the marketplace into Medicaid programs. And it will allow patients and providers to make more of their own decisions.
Out-of-control increases in Medicaid costs are not inevitable. But if reforms are not made soon, the question in a few years will be: Why didn’t policymakers take control of our destiny when they had the chance?
NOTE: Nothing written here should be construed as necessarily reflecting the views of the National Center for Policy Analysis or as an attempt to aid or hinder the passage of any bill before Congress.
[page]- “The Fiscal Survey of States,” National Governors Association and National Association of State Budget Officers, June 2005.
- Medicare is funded by the federal government through a combination of payroll taxes, premiums paid by beneficiaries and transfers from general revenues. Federal expenditures on Medicaid have about doubled in the last 10 years, rising from $89 billion dollars in 1995 to $176 billion in 2004. See “Budget of the United States Government, Fiscal Year 2006,” Historical Tables, Office of Management and Budget, February 23, 2005, pages 133-134.
- Medicaid and other health expenses already account for about 22 percent of state spending. See “The Fiscal Survey of States,” National Governors Association and National Association of State Budget Officers, June 2005.
- Vernon Smith et al., “The Continuing Medicaid Budget Challenge: State Medicaid Spending Growth and Cost Containment in Fiscal Years 2004 and 2005, Results from a 50-State Survey,” Kaiser Commission on Medicaid and the Uninsured, Kaiser Family Foundation, October 2004.
- Enrollment is expected to grow an average of about 4 percent annually through 2006. See “The Fiscal Survey of States,” National Governors Association and National Association of State Budget Officers, June 2005.
- Estimates of eligibility for public health care programs vary. One study found that just over half (51.4 percent) of eligible, nonelderly adults were enrolled in Medicaid in 1997. Of the remaining adults who were Medicaid eligible, 21.6 percent had private coverage while 27 percent were uninsured. Another study found that about seven million uninsured children eligible for either SCHIP or Medicaid are not enrolled. See Amy Davidoff, Bowen Garrett and Alshadye Yemane, “Medicaid-Eligible Adults Who Are Not Enrolled: Who Are They and Do They Get the Care They Need?” Urban Institute, Series A, No. A-48, October 2001. Of those children eligible for Medicaid or SCHIP, one-third are eligible for SCHIP while two-thirds are eligible for Medicaid. Eight percent of uninsured, low-income children are illegal aliens and, as such, not eligible for either Medicaid or SCHIP. See Lisa Dubay, Jennifer Haley and Genevieve Kenney, “Children’s Eligibility for Medicaid and SCHIP: A View from 2000,” Urban Institute, Series B, No. B-41, March 2002. Also see “The Uninsured in America ,” Blue Cross Blue Shield Association, February 27, 2003.
- Statement of Raymond C. Scheppach, Executive Director, National Governors Association, before the Medicaid Commission on Short-Term Medicaid Reform, August 17, 2005.
- “Changes in Participation in Means-Tested Programs,” Congressional Budget Office, Economic and Budget Issue Brief, April 2005. Available here; “Change in Number of AFDC/TANF Recipients,” U.S. Department of Health and Human Services, Office of Family Assistance. Available http://www.acf.hhs.gov/programs/ofa/annualreport6/chapter01/0111a.htm.
- “Medicaid: An Overview of Spending on ‘Mandatory’ vs. ‘Optional’ Populations and Services,” Kaiser Commission on Medicaid and the Uninsured, June 2005.
- Based on 2002 estimates from “Medicaid Expenditures for Dual Eligibles (full and partial) by State, 2002,” Kaiser Commission on Medicaid and the Uninsured. Available here. Access verified January 4, 2006. See also John Holahan and Brian Bruen, “Medicaid Spending: What Factors Contributed to the Growth Between 2000 and 2002?” Kaiser Commission on Medicaid and the Uninsured, September 2003.
- Potential medical providers, including physicians and clinics, were called by surveyors who posed variously as Medicaid, uninsured or insured patients seeking an appointment for a specific condition with a set of symptoms. The conditions described by the callers are considered medically urgent. Attempted access was considered successful when the caller was able to schedule an appointment within seven days. The surveys were conducted in major, geographically-dispersed urban areas. Brent R. Asplin et al., “Insurance Status and Access to Urgent Ambulatory Care Follow-up Appointments,” Journal of the American Medical Association , Vol. 294, No. 10, September 14, 2005, pages 1,248-1,254.
- Richard Pérez-Peña, “At Clinic, Hurdles to Clear Before Medicaid Care,” New York Times , October 17, 2005.
- Richard Pérez-Peña, “Trying to Get, and Keep, Care Under Medicaid,” New York Times , October 18, 2005.
- Allison Sherrym, “Doctors say Colorado Hospital is Refusing Poor Patients,” Denver Post , October 22, 2003.
- Heath Foster, “Low-Income Patients Left Waiting for Care,” Seattle Post-Intelligencer Reporter , January 26, 2004.
- Table, “Medicaid Managed Care Enrollment as of June 30, 2004,” Centers for Medicare and Medicaid Services.
- See “Medicaid Managed Care Penetration Rates by State,” in “2004 Medicaid Managed Care Enrollment Report,” Centers for Medicare and Medicaid Services , June 30, 2004 , . Access verified November 15, 2005.
- Presumably, plans are able to pay more because of other cost-reducing efficiencies.
- Outside of New York City , Medicaid uses traditional managed care organizations. See Richard Pérez-Peña, “Trying to Get, and Keep, Care Under Medicaid.”
- However, these plans cannot use the techniques private plans use to control utilization and costs — such as requiring preauthorization of services, and patient copays and deductibles.
- See Ronald E. Bachman, “Giving Patients More Control,” National Center for Policy Analysis, Brief Analysis No. 399, June 17, 2002; and Greg Scandlen, “Defined Contribution Health Insurance,” National Center for Policy Analysis, Policy Backgrounder No. 154, October 26, 2002.
- Kaiser Commission on Medicaid and the Uninsured.
- Examples of long-term care optional benefits include Intermediate Care Facilities – Mental Retardation (ICF-MR), inpatient and nursing facilities for individuals over age 65 in an institution for mental disease, home health care, case management, respiratory care for ventilator-dependent individuals, personal care, private duty nursing, hospice, Programs of All-Inclusive Care for the Elderly (PACE) and home- and community-based services. Similar optional services must be provided to children shown to need them. See Kaiser Commission on Medicaid and the Uninsured, June 2001. See “Medicaid ‘Mandatory’ and ‘Optional’ Eligibility and Benefits,” Kaiser Commission on Medicaid and the Uninsured, Policy Brief No. 2256, July 2001. Also see John Holahan, “Restructuring Medicaid Financing: Implications for the NGA Proposal,” Kaiser Commission on Medicaid and the Uninsured, Policy Brief No. 2257, June 2001.
- “HIFA: Will it Solve the Problem of the Uninsured?” National Health Law Program, HIFA Talking Points, February 28, 2002.
- For a discussion on factors that influence state Medicaid spending see Robert J. Buchanan, Joseph C. Cappelleri and Robert L. Ohsfeldt, “The Social Environment and Medicaid Expenditures: Factors Influencing the Level of State Medicaid Expenditures,” Public Administration Review , Vol. 51, No. 1, January/February 1991, pages 67-73.
- Regression analysis by Pamela Villarreal, an NCPA graduate student fellow, based on U.S. Census data and Medicaid data from the Kaiser Family Foundation.
- For a description of how the Medicaid federal match is calculated see “Medicaid Formula: Differences in Funding Ability among States Often Are Widened,” General Accountability Office, Report No. GAO-03-620, August 11, 2003, Appendix I: Legislative History and Description of the Matching Formula.
- Ibid, page 4.
- Leslie G. Aronovitz, “Medicaid Fraud and Abuse: Stronger Action Needed to Remove Excluded Providers from Federal Health Programs,” U.S. General Accounting Office, GAO/HEHS-97-63, March 1997.
- Maurice Passley, Bonita Brodt and Tim Jones, “Medicaid: System in Chaos,” a series in nine parts, Chicago Tribune , October 31-November 9, 1993.
- Clifford J. Levy and Michael Luo, “New York Medicaid Fraud may Reach into Billions,” New York Times , July 18, 2005.
- See “Supplemental Security Income: Action Needed on Long-Standing Problems Affecting Program Integrity,” Report to the Commissioner of Social Security, U.S. General Accounting Office, GAO Report HEHS-98-158, September 1998.
- “Medicaid’s architects envisioned a program that would provide poor people with mainstream medical care in a fashion similar to that of private insurance. As the decades have passed, that vision has largely faded…poor people continue to rely on providers that make up the nation’s medical safety net: public and some not-for-profit hospitals and clinics [that] by virtue of their location or social calling provide a disproportionate amount of care to the poor.” John K. Iglehart, “The American Health System-Medicaid,” New England Journal of Medicine , Feb. 4, 1999, pages 403-408.
- Medicaid spending per recipient varied from $4,425 to $2,101; a difference of about $2,300 . Adding spending on free care for the uninsured to Medicaid spending reduced the variation in health care spending to less than $1,200. NCPA analysis of health regions in Texas . See John C. Goodman, “Minority Report of the Texas Blue Ribbon Task Force on the Uninsured,” in Sen. Chris Harris (Chairman) and the Members of the Texas Blue Ribbon Task Force on the Uninsured, “Texas Blue Ribbon Task Force on the Uninsured,” Report to the 77th Legislature, State of Texas, February 2001, page 42.
- Janet Currie and Jonathan Gruber, “Health Insurance Eligibility, Utilization of Medical Care, and Child Health,” Quarterly Journal of Economics, May 1996, pages 431-466.
- “Learning from SCHIP and Learning from SCHIP II,” Agency for Health Care Policy Research, June 1998.
- See Janet Currie and Jonathan Gruber, “Saving Babies: The Efficacy and Cost of Recent Expansions of Medicaid Eligibility for Pregnant Women,” Journal of Political Economy , December 1996, pages 1,263-1,296.
- See Janet Currie and Jonathan Gruber, “Health Insurance Eligibility, Utilization of Medical Care, and Child Health,” National Bureau of Economic Research, NBER Working Paper No. 5052, March 1995.
- Laura-Mae Baldwin et al., “The Effect of Expanding Medicaid Prenatal Services on Birth Outcomes,” American Journal of Public Health , Vol. 88, No. 11, November 1998, pages 1,623-1,629.
- “Increased Access to Medicaid Had Little Effect on Pregnancy Care or Outcome,” National Program Project Report, January 2001. Results for project: Effect of Expanding Medicaid Coverage on Health Outcomes, Robert Wood Johnson Foundation. Available here. Access verified August 26, 2005.
- Michael F. Cannon, “Medicaid’s Unseen Costs,” Cato Institute, Policy Analysis No. 548, August 18, 2005.
- Jonathan Gruber and Aaron Yelowitz, “Public Health Insurance and Private Savings,” Journal of Political Economy, Vol. 107, No. 6, part 1, December 1999, page 1,259. Cited in Michael F. Cannon, “Medicaid’s Unseen Costs.” Cannon also notes that substituting consumption for asset accumulation (such as purchasing a car for transportation to work) decreases the likelihood of escaping poverty.
- For instance, it was widely assumed that the 1996 welfare reforms, which limited the eligibility of immigrants for Medicaid, would increase the uninsured rate of that population. Instead, the immigrant uninsured rate fell slightly as more immigrants purchased private insurance. See George Borjas, “Welfare Reform, Labor Supply, and Health Insurance in the Immigrant Population,” Journal of Health Economics , Vol. 22, No. 6, November 2003, pages 933-958.
- However, the loss of private insurance is likely to cause a small, offsetting increase in government revenues as employers substitute taxable wages for previously untaxed health benefits.
- David M. Cutler and Jonathan Gruber, “Does Public Insurance Crowd Out Private Insurance?” Quarterly Journal of Economics , Vol. 111, No. 2, May 1996, pages 391- 430. Also see Tanya T. Alteras, “Understanding the Dynamics of ‘Crowd-out’: Defining Public/Private Coverage Substitution for Policy and Research,” Academy for Health Services Research and Health Policy, prepared for the Robert Wood Johnson Foundation’s Changes in Health Care Financing and Organization Program, June 2001, pages 14–15; and RAND Health, “State Efforts to Insure the Uninsured: An Unfinished Story,” RAND, Research Highlights, 2005.
- Ibid. Cutler and Gruber found that most of the reduction came from workers deciding to drop private coverage (particularly for dependents) rather than because their employers stopped insurance coverage.
- Peter J. Cunningham and Michael H. Park, “Recent Trends in Children’s Health Insurance: No Gains for Low-Income Children,” Center for Studying Health System Change, Issue Brief No. 29, April 2000; and Community Tracking Survey.
- David M. Cutler and Jonathan Gruber, “Does Public Insurance Crowd Out Private Insurance?”
- Ibid. Based on NCPA calculations comparing the years 1997 and 2003.
- Bradley C. Strunk and James D. Rescholsky, “Trends in U.S. Health Insurance Coverage, 2001-2003,” Center for Studying Health System Change , Tracking Report No. 9, August 2004.
- Data from New York State Budget. Accessed July 2005. Population figures from the U.S. Census Bureau, Department of Commerce.
- Since Medicaid enrollees join and drop off the rolls during the year, average Medicaid enrollment is lower than total enrollment. Spending per full-time equivalent enrollee was $6,580 in 2003. Authors’ calculations using June 30, 2004, enrollment data, from the Centers for Medicare and Medicaid Services, and “Medicaid Spending 2004,” Kaiser Family Foundation, available at StateHealthFacts.org.
- NCPA analysis by Pamela Villarreal, based on the American Chamber of Commerce Research Association (ACCRA) cost of living index for the 2nd quarter of 2004 and figures for Medicaid spending. ACCRA compiles a quarterly cost of living index based on comparative survey data from various metropolitan and micropolitan areas. The index measures the cost of living based on a “basket of goods,” such as housing, groceries, health care and utilities, and are weighted according to government survey data on expenditure patterns.
- Denise Soffel, “Federal Medicaid Reform: What’s at Risk for New York ,” Community Service Society, Policy Brief No.11, June 2003.
- “March 2005 Medicaid Eligibility,” Department of Health, New York State , March 2005.
- Data from Centers for Medicare and Medicaid Services; accessed December 2005. Population figures from the Census Bureau, U.S. Department of Commerce.
- “Confronting the Tradeoffs in Medicaid Cost Containment,” Citizens Budget Commission, February 2004. Access verified December 22, 2005.
- ” New York : Distribution of Medicaid Spending on Long-term Care, FY2003,” Kaiser Family Foundation, 2004, available at StateHealthFacts.org.
- “Medicaid Watch ’05,” Public Policy Institute of New York State , Issue No. 5, March 28, 2005.
- “Quantitative Analysis of New York State Medicaid Spending,” Health Economics and Outcomes Research Institute, Greater New York Hospital Association, October 24, 2003.
- Nursing homes in New York state are reimbursed per patient per day based on historical costs. “Confronting the Tradeoffs in Medicaid Cost Containment,” Citizens Budget Commission, February 2004.
- Ibid.
- Robyn I. Stone, “Long-Term Care for the Elderly with Disabilities: Current Policy, Emerging Trends, and Implications for the Twenty-First Century,” Milbank Memorial Fund, August 2000.
- “Quantitative Analysis of New York State Medicaid Spending,” Health Economics and Outcomes Research Institute, Greater New York Hospital Association, October 24, 2003.
- Allen J. LeBlanc, M. Christine Tonner and Charlene Harrington, “State Medicaid Programs Offering Personal Care Services,” Health Care Financing Review , Vol. 22, No. 4, Summer 2001, page 155. Also see “Confronting the Tradeoffs in Medicaid Cost Containment,” Citizens Budget Commission, February 2004.
- Clifford J. Levy and Michael Luo, “New York Medicaid Fraud may Reach into Billions,” New York Times , July 18, 2005.
- Ibid.
- New York State Department of Health and Mississippi Envision.
- Direct Research, LLC, “Medicare Physician Payment Rates Compared to Rates Paid by the Average Private Insurer, 1999-2001,” Medicare Payment Advisory Commission, No. 03-6, August 2003.
- ” Kansas Medicaid Facts,” American Academy of Pediatrics, July 2005.
- See Stephen Zuckerman et al., “Changes In Medicaid Physician Fees, 1998– 2003: Implications for Physician Participation,” Health Affairs , Web Exclusive, June 23, 2004.
- Ibid.
- 73 Richard Pérez-Peña, “At Clinic, Hurdles to Clear Before Medicaid Care,” New York Times , October 17, 2005.
- Stephen Zuckerman et al., “Changes In Medicaid Physician Fees, 1998–2003: Implications for Physician Participation,” Health Affairs , Web Exclusive, June 23, 2004. Also see Richard Pérez-Peña, “At Clinic, Hurdles to Clear Before Medicaid Care,” New York Times , October 17, 2005.
- Laurence C. Baker and Anne Beeson Royalty, “Medicaid Policy, Physician Behavior, and Health Care for the Low-Income Population,” Journal of Human Resources , Vol. 35, No. 3, Summer 2000, pages 480 – 502.
- “Medicaid Watch ’05,” Public Policy Institute of New York State , Issue No. 4, March 24, 2005.
- Richard Pérez-Peña, “Hospital Business in New York Braces for a Crisis,” New York Times , April 11, 2005.
- “Medicaid Watch ’05,” Public Policy Institute of New York State , Issue No. 4, March 24, 2005.
- Authors’ analysis of Medicaid spending on inpatient care based on Kaiser Family Foundation data available at www.StateHealthFacts.org.
- Ibid.
- A panel modeled after the federal military base closure commission has been established to recommend hospitals and nursing homes for closure, consolidation or merger, and is due to report December 1, 2006. Raymond Hernandez and Al Baker, “Close Hospitals, Pataki Says in Medicaid Cost Proposal,” New York Times , March 17, 2005. See the Commission on Health Care Facilities in the 21st Century. Available at http://www.gnyha.org/pubinfo/chcf/CHCF_Origin_Mission.pdf. Access verified March 15, 2006.
- Richard Pérez-Peña, “Hospital Business in New York Braces for a Crisis,” New York Times , April 11, 2005.
- Steven Malanga, “How Politics Crippled N.Y. Health Care,” New York Post , July 16, 2001. Also see Steven Malanga “Health-Care Demagoguery,” Manhattan Institute, City Journal , Spring 2003.
- John Rodat, “After Eight Years of Waiting?” SignalHealth, April 13, 2005.
- Kathryn Haslanger, “Medicaid Managed Care in New York : A Work in Progress,” United Hospital Fund, 2003.
- The discounts were whittled down somewhat in later years by hospital mergers. See Jack Zwanziger and Cathleen Mooney, “Has Competition Lowered Hospital Prices?” Inquiry , Vol. 42, No. 1, Spring 2005, pages 73 – 85.
- Kathryn Haslanger, “Medicaid Managed Care in New York : A Work in Progress,” United Hospital Fund, 2003.
- Richard Pérez-Peña, “For Medicaid Clients, New Hurdle Looms,” New York Times , November 21, 2005.
- “Medicaid Drug Expenditures per Enrollee (2002),” National MSIS Tables, FY 2002, Centers for Medicare and Medicaid Services.
- Michael Luo, “Under New York Medicaid Drug Costs Run Free,” New York Times , November 23, 2005.
- “Medicaid Drug Expenditures per Enrollee (2002),” National MSIS Tables, FY 2002, Centers for Medicare and Medicaid Services, U.S. Department of Health and Human Services, 2002.
- See Devon M. Herrick, “Shopping for Drugs: 2004,” National Center for Policy Analysis, Policy Report No. 270, October 2004.
- Office of Inspector General, “Variation in State Medicaid Drug Prices,” U.S. Department of Health and Human Services, Report OEI-05-02-00681, September 2004.
- New York also spends millions for other proton pump inhibitors when Prilosec is about 80 percent less expensive. See Michael Luo, “Under New York Medicaid Drug Costs Run Free,” New York Times , November 23, 2005.
- Kaiser Commission on Medicaid and the Uninsured, “The Continuing Medicaid Budget Challenge,” October 2004.
- Clifford J. Levy and Michael Luo, ” New York Medicaid Fraud May Reach into Billions,” New York Times , July 18, 2005.
- Linda Gorman, “Medicaid Drug Formularies,” Independence Institute, Issue Paper 2-3003, April 2002.
- Frank Lichtenberg, “Benefits and Costs of Newer Drugs: An Update,” National Bureau of Economic Research, Working Paper No. 8996, June 2002.
- Counties in a few states, such as Iowa and North Carolina , bear part of the cost of Medicaid, but the county and city contribution in New York is apparently the highest of any state.
- From 1993 to 2003, New York counties’ Medicaid funding increased an average of 8.6 percent per year. See Governor’s Office, “Governor Pataki, NYS Association of Counties Announce Savings to Central New York County Taxpayers under Historic New Medicaid Cap,” Press Release, New York State , August 24, 2005.
- “2003 State Expenditure Report,” National Association of State Budget Officers, 2003.
- Richard Pérez-Peña and Michael Luo, “As New York Medicaid Grows, Swelling Costs Take Local Toll,” New York Times , December 23, 2005.
- Ibid.
- Albany County has a counter on its Web site that adds up the amount local taxpayers send to the state for Medicaid. As of November 16, 2005, the total was $60,131,169.23 — or $130 every minute. The total projected amount for the entire year was $68,661,118. See AlbanyCounty.com. Access verified November 16, 2005.
- “How High is the Upstate Tax Burden — and Why?” Public Policy Institute of New York , August 2004.
- County Medicaid Costs, New York State Office of the State Comptroller, 2005. Available here. Access verified November 17, 2005.
- Editorial, “Mad as Hell,” New York Sun , March 8, 2005.
- Leslie G. Aronovitz, “Medicaid Fraud and Abuse: Stronger Action Needed to Remove Excluded Providers from Federal Health Programs,” U.S. General Accounting Office, GAO/HEHS-97-63, March 1997.
- Clifford J. Levy and Michael Luo, “New York Medicaid Fraud may Reach into Billions,” New York Times , July 18, 2005.
- Ibid.
- Office of New York State Attorney General Eliot Spitzer, “Medicaid Fraud Unit Created in Wake of 1970’s Nursing Home Scandal Commemorates 25th Anniversary at Brooklyn Marriott,” Department of Law, Press Release, April 11, 2000.
- Ibid.
- Michael Luo and Clifford J. Levy, “As Medicaid Balloons, Watchdog Force Shrinks,” New York Times , July 19, 2005.
- Ibid.
- Richard Pérez-Peña, “A County Finds $13 Million in Questionable Medicaid Billing,” New York Times , January 6, 2006.
- Clifford J. Levy and Michael Luo, “New York Medicaid Fraud may Reach into Billions,” New York Times , July 18, 2005.
- Richard Pérez-Peña, “A County Finds $13 Million in Questionable Medicaid Billing,” New York Times , January 6, 2006.
- Rockland County only looked at pharmacies and general practitioners whose billings accounted for the top 10 percent of among their peers.
- Richard Pérez-Peña, “A County Finds $13 Million in Questionable Medicaid Billing,” New York Times , January 6, 2006.
- Conrad F. Meier, “New York Health Insurance: ‘Consumers Are Outraged,'” Heartland Institute, Health Care News , Part 3 in a series, April 1, 2004.
- “Health Care Mandates Increase Number of Uninsured,” Buckeye Institute, January 1, 1999. Also see William S. Custer, “Health Insurance Coverage and the Uninsured,” Georgia State University , Center for Risk Management and Insurance Research, December 10, 1998.
- James Doyle, ” New York City ‘s $4 Billion Medicaid Bill: What Is Driving the Rise in Costs?” Inside the Budget , New York City Independent Budget Office, No. 114, May 7, 2003.
- Jennifer Steinhauer, “New York, Which Made Medicaid Big, Looks to Cut It Back, New York Times , March 3, 2003.
- Ibid. In January of 2002 the Workforce Recruitment and Retention Act amended the Health Care Reform Act to fund workers’ training and boost wages.
- For background on health care unions in New York, see Steven Malanga, “Health-Care Ills,” Manhattan Institute, City Journal , Winter 2005; Steven Malanga, “Health-Care Demagoguery,” Manhattan Institute, City Journal , Spring 2003; Steven Malanga, “Medicaid Madness,” Manhattan Institute, City Journal , Autumn 2003.
- “Medicaid in New York State ,” United Hospital Fund, 2003.
- Steven Malanga, “How Politics Crippled N.Y. Health Care,” New York Post , July 16, 2001.
- Editorial, “Mad as Hell,” New York Sun , March 8, 2005.
- See, for example, Edwin Rubenstein , “Emergency Surgery for Medicaid,” Manhattan Institute, City Journal , Spring 1991.
- Texas Comptroller of Public Accounts, “Chapter 6: Health and Human Services,” Challenging the Status Quo Toward Smaller, Smarter Government, Texas Performance Review, Vol. 2, March 1999.
- James C. Robinson and C.S. Phibbs, “An Evaluation of Medicaid Selective Contracting in California,” Journal of Health Economics , Vol. 8, No. 4, 1989, pages 437-55.
- Jack Zwanziger, Glenn A. Melnick and Anil Bamezai, “The Effect of Selective Contracting on Hospital Costs and Revenues,” Health Services Research , October 2000.
- See ” New York State Health Care Reform Act (HCRA),” New York State Department of Health. Available here. Access verified January 17, 2006.
- The Medicaid program in New York State still uses a system of Diagnosis Related Groups (DRGs), Service Intensity Weights (SIWs), Trimpoints and Average Length of Stays (ALOS) to calculate Medicaid hospital payments. See “Hospital Inpatient DRGs, SIWs, Trimpoints, ALOS,” New York State Department of Health.
- “Analysis and Description of the Governor’s 2005-2006 State Budget and Health Care Reform Act Proposals,” Healthcare Association of New York State , January 21, 2005. Gov. Pataki’s proposal to selectively contract for certain services has not been implemented. The most recent regulations still use the old system of DRGs, SIWs and Trimpoints. Text available http://cumc.columbia.edu/dept/gc/issues/docs/01-20-05budgetattachmenttoElertFINAL.doc.
- Ibid.
- John C. Fortney, “VA Community-Based Outpatient Clinics: Access and Utilization Performance Measures,” Medical Care , Vol. 40, No. 7, July 2002, pages 561 – 69.
- “Avoidable Hospitalizations in Pennsylvania ,” Pennsylvania Health Care Cost Containment Council, Research Brief, Issue No. 3, November 2004.
- Pharmaceutical Care Management Association.
- Assembly Bill 2766, Senate Bill 2894 and Assembly Bill 6934 are similar in that they would prevent insurers from requiring prescription drugs be purchased through a mail-order pharmacy. This is referred to as the “employee’s mail order pharmacy bill of rights.”
- Some scientists would say it is pharmacologically the same. See Sylvester J. Schieber, “Why Coordination of Health Care Spending and Savings Accounts is Important,” 2004, unpublished.
- Prices for Clarinex and Claritin are for 30 doses from Walgreens.com. The price for the generic version of Claritin (Loratadine) is for Costco.com. All prices surveyed October 7, 2005.
- Price surveyed in May 2003.
- Price surveyed January 27, 2006.
- If approved, the OTC dose of Orlistat will be half that of the prescription version. A 60 mg dose has about 85 percent of the effectiveness of the 120 mg prescription dose, however. Many private insurers do not cover the cost of Orlistat. Many state Medicaid program may not cover it as well. See Christopher Snowbeck, “Glaxo Seeks Approval to Sell Obesity Drug Over the Counter,” Pittsburgh Post-Gazette , January 23, 2006.
- Jeffrey S. Crowley, “An Overview of the Independence Plus Initiative to Promote Consumer-Direction of Services in Medicaid,” Kaiser Commission on Medicaid and the Uninsured, Henry J. Kaiser Family Foundation, Issue Paper, November 2003.
- To facilitate the process of applying for these waivers, the Bush Administration has created a template waiver called Independence Plus. See Karen Tritz, “Long-Term Care: Consumer-Directed Services Under Medicaid,” CRS Report for Congress, Congressional Research Service, Library of Congress, January 21, 2005.
- Leslie Foster, Randall Brown, Barbara Phillips, Jennifer Schore and Barbara Lepidus Carlson, “Does Consumer Direction Affect the Quality of Medicaid Personal Assistance in Arkansas ?” Mathematica Policy Research, March 2003.
- James Frogue, “The Future of Medicaid: Consumer-Directed Care,” Heritage Foundation, Backgrounder No. 1618, January 10, 2003.
- Michael L. Millenson, Demanding Medical Excellence: Doctors and Accountability in the Information Age (University of Chicago Press: Chicago, 1997). An example of the possible magnitude of savings is shown by a study reported in Employee Benefit News, which estimates that the cost of poor quality health care services is $1,350 per employee. If even a fraction of that amount can be saved per Medicaid recipient, hundreds of millions or billions of dollars in taxes can be saved. See Craig Gunsauley, “Estimate: 30 percent of Health Spending is Wasted,” Employee Benefit News , August 1, 2002.
- A ground-breaking hospital study in the 1960s showed that treatment caused complications in one out of five patients, and about 7 percent of the complications were fatal. At the time, as many as eight out of 10 medical practices had not been scientifically validated. See Elihu Schimmel, “The Hazards of Hospitalization,” Annals of Internal Medicine , January 1964, pages 100-10.
- Committee on Quality of Health Care in America , Institute of Medicine , Linda T. Kohn, Janet M. Corrigan and Molla S. Donaldson, eds., To Err Is Human: Building a Safer Health System (Washington, D.C.: National Academy Press, 1999).
- Betsy McCaughey, “Unnecessary Deaths: The Human and Financial Costs of Hospital Infections,” Committee to Reduce Infection Deaths and the National Center for Policy Analysis, December 2005.
- Ibid.
- Brian Abery, Rhonda Cady and Erin Simunds, “Health Care Coordination for Persons with Disabilities: Its Meaning and Importance,” Institute on Community Integration University of Minnesota , Impact , Vol. 18 , No. 1, 2005. Available here. Access verified February 2005.
- Salynn Boyles, “Too Many Elderly Are Taking Dangerous Drugs,” WebMD Medical News, August 9, 2004; Lesley H. Curtis, et al., ” Inappropriate Prescribing for Elderly Americans in a Large Outpatient Population ,” Archives of Internal Medicine , Vol. 164, No. 15, August 9/23, 2004.
- Christopher Tedeschi, “Pill Overkill,” USC Health & Medicine , Summer 1996.
- Description of MainNET, Muskie School of Public Service , University of Southern Maine . Available here.
- According to the Disease Management Association of America, “disease management is a system of coordinated healthcare interventions and communications for populations with conditions in which patient self-care efforts are significant.” See “DMAA Definition of Disease Managment.”
- See “Take Control – Q&A to Having a Self Management Plan,” AsthmaAssistant.com. For instance, an asthma self-management plan could stipulate that if a patient’s “peak airflow” falls to 80 percent of their personal best peak airflow, they should increase medications at a pre-established rate and schedule a physician appointment. Patients should go to the emergency room if their peak airflow falls below 50 percent.
- Susan L. Norris, Michael M. Engelgau and K. M. Venkat Narayan, “Effectiveness of Self-Management Training in Type 2 Diabetes,” Diabetes Care , March 2001.
- Teresa Pearson, “Getting the Most From Health-Care Visits,” Diabetes Self-Management , March/April 2001.
- Patti Bazel Beil and Laura Hieronymus, “Money-Saving Tips: Supplies, Nutrition, and Exercise,” Diabetes Self-Management , March/April 1999.
- Ibid.
- “Economic and Health Costs of Diabetes,” Agency for Healthcare Research and Quality, U.S. Department of Health and Human Services, Healthcare Cost and Utilization Project Highlights, No. 1, AHRQ Pub. No. 05-0034, January 2005.
- Tjard R. Schermer et al., “Randomized Controlled Economic Evaluation of Asthma Self-Management in Primary Health Care,” American Journal of Respiratory and Critical Care Medicine Vol. 166, No. 8, August 2002, pages 1,062-1,072. For an evaluation of direct medical treatment costs for asthma, see Michael T. Halpern et al., “Asthma: Resource Use and Costs for Inhaled Corticosteroid vs. Leukotriene Modifier Treatment — a Meta-Analysis,” Journal of Family Practice , May 23, 2005.
- “Asthma Overview,” Asthma and Allergy Foundations of America . Available here.
- Li Yan Wang, Yuna Zhong and Lani Wheeler, “Direct and Indirect Costs of Asthma in School-age Children,” Preventing Chronic Disease , Vol. 2, No. 1, January 2005.
- Ibid. Implementation costs were mostly incurred in year one and amounted to about $200.
- Susan Konig, ” Florida Medicaid Plan Receives Federal Approval,” Heartland Institute, Health Care News, January 1, 2006.
- See “Medicaid Managed Care: Four States’ Experiences with Mental Health Carve-Out Programs,” U.S. General Accounting Office, September 1999.
- The National Academy of Sciences recommends that all federal health programs begin paying for quality care rather than for services rendered. See Janet M. Corrigan, Jill Eden and Barbara M. Smith, eds., Leadership by Example: Coordinating Government Roles in Improving Health Care Quality (National Academies Press: Washington , D.C. , 2002).
- Eric Henley, “Pay-for-Performance: What Can You Expect?” Journal of Family Practice , July 2005.
- John W. Rodat, “Pay for Performance — What’s Going On?” Signal Health , December 15, 2005. Access verified January 17, 2006.
- Clifford J. Levy and Michael Luo, “New York Medicaid Fraud may Reach into Billions,” New York Times , July 18, 2005.
- This database is referred to as a Medicaid provider information exchange. See Sarah F. Jaggar, “Medicare and Medicaid: Opportunities to Save Program Dollars by Reducing Fraud and Abuse,” U.S. General Accounting Office, GAO/T-HEHS-95-110, March 22, 1995.
- Communication from Jim McDermott of Salient Corporation. To learn more about their software, http://www.salient.com/Medicaid.pdf. Access verified January 12, 2006.
- See Press Release, “Governor Pataki, NYS Association of Counties Announce Savings to Central New York County Taxpayers under Historic New Medicaid Cap,” Governor’s Office, New York State , August 24, 2005.
- “How High is the Upstate Tax Burden — and Why?” Public Policy Institute of New York State , August 2004.
- “Risk Pools: State Health Insurance High-Risk Pools,” Communicating for Agriculture and the Self-Employed, Available here. Access verified February 2, 3006.
- See Victoria Craig Bunce and J.P. Wieske, “Health Insurance Mandates In The States 2004,” Council for Affordable Health Insurance, July 2004.
- John C. Goodman and Gerald L. Musgrave, “Freedom of Choice in Health Insurance,” National Center for Policy Analysis, Policy Report No. 134, 1988; and Gail A. Jensen and Michael Morrisey, “Mandated Benefit Laws and Employer-Sponsored Health Insurance,” Health Insurance Association of America, January 25, 1999.
- Victoria Craig Bunce and J.P. Wieske, “Health Insurance Mandates in the States: 2004,” Council for Affordable Health Insurance, July 2004.
- For a critical review, see Edwin Park and Judith Solomon, “Health Opportunity Accounts For Low-Income Medicaid Beneficiaries: a Risky Approach,” Center for Budget and Policy Priorities, November 1, 2005.
- Rep. Mike Rogers, “The Truth about Medicaid Reform: Puts America’s Most Vulnerable Families on Road to Self-Sufficiency,” letter, U.S. House of Representatives, November 7, 2005. Bill text available here .
- One limitation is that participants lose access to the funds once their income surpasses 200 percent of the federal poverty level.
- See Tracy Edge, ” Sanford ‘s Bold Move Necessary to Avoid a Crisis,” August 17, 2005. Available http://www.scgovernor.com/interior.asp?sitecontentid=7&newsid=614. Access verified August 26, 2005.
- For a discussion on giving Medicaid enrollees choice, see Irene Fraser, Elizabeth Chait and Cindy Brach, “Promoting Choice: Lessons from Managed Medicaid,” Health Affairs, Vol. 17, No. 5, September/October 1998.
- A. E. Benjamin and Rani E. Snyder, “Consumer Choice in Long-Term Care,” To Improve Health and Health Care, Volume V: The Robert Wood Johnson Anthology ( Hoboken , New Jersey : Jossey-Bass, 2003) Chapter 5.
- Michael Bond, “Reforming Medicaid in Kansas : A Market-Based Approach,” Flint Hills Institute of Public Policy, forthcoming.
- For example, see eBenX (http://www.ebenx.com/) and DxCG (http://www.dxcg.com/), Web sites that sell software to risk-adjust insurance premiums.
- This is discussed in detail in John C. Goodman, “Characteristics Of An Ideal Health Care System,” National Center for Policy Analysis, Policy Report No. 242, April 2001.
- Michael Bond, “Reforming Medicaid in Kansas : A Market-Based Approach,” Flint Hills Institute of Public Policy, forthcoming.
- Ibid.
- Robert Pear, ” U.S. Gives Florida a Sweeping Right to Curb Medicaid,” New York Times , October 20, 2005.
- Michael Bond, “Medicaid Pilot Takes Flight,” Journal of the James Madison Institute , Summer 2005, pages 8-10.
- Information obtained from “Governor Bush Signs Landmark Medicaid Reform Legislation,” EmpoweredCare.com, June 3, 2005. Accessed August 10, 2005.
- Shawna Orzechowski and Peter Sepielli, “Net Worth and Asset Ownership of Households: 1998 and 2000,” U.S. Census Bureau, Current Population Reports, P70-88, May 2003, page 11, Table F.
-
Congress is considering legislation that would increase the “look-back” period up to five years. In late 2005, both the House of Representatives and the U.S. Senate passed budget reconciliation bills that included provisions designed to reduce the growth of Medicaid spending. Under the House bill, the clock would not start ticking until the applicant applied for Medicaid long-term care coverage rather than the date of the actual transfer. The waiting period to sign up for Medicaid after an asset transfer would be the amount of the money transferred divided by the annual cost of nursing home care in the state multiplied by 12 months. For example, under current law if $20,000 was transferred less than three years prior, in a state where a year of nursing home care costs $60,000, the waiting period before eligibility for coverage would be four months ($20,000/$60,000 = .333 years). However, the waiting period would officially begin not when the senior applied for Medicaid, but much earlier — four months after the actual date the funds were transferred. As a result, the four months waiting period might have lapsed a year or two earlier. Under current law, seniors could conceivably give away sufficient funds to cover up to two years or more worth of care without having to wait for Medicaid eligibility.
Suppose a senior gave $20,000 to a granddaughter for college tuition four years prior to needing long-term care. Under the current law, the $20,000 would not be included in assets when qualifying for Medicaid. However, the transfer would fall within the five year period resulting in a waiting period of four months. Under the proposed House bill, the waiting period would begin not at date of transfer four years prior, but on the date of applying for Medicaid. For an analysis of both Senate and House bills, see Victoria Wachino et al., “Medicaid Provisions of House Reconciliation Both Harmful and Unnecessary,” Center for Budget and Policy Priorities, December 9, 2005.
- See Ronald Lipman, “Trust Helps Person Qualify for Medicaid Nursing Care,” Houston Chronicle , August 11, 2002.
- GAO “Medicaid: Transfers of Assets by Elderly Individuals to Obtain Long-Term Care Coverage,” United States Government Accountability Office, September 2005.
- Occasionally, a facility can transfer a patient if it can find a Medicaid-qualified nursing home that will accept the patient. However, most facilities need at least some private pay clients to offset Medicaid’s low reimbursement rate. For that reason, it is generally somewhat difficult to transfer patients once they qualify for Medicaid.
- Enid Kassner, “Medicaid and Long-Term Services and Supports for Older People Fact Sheet,” AARP Public Policy Institute, February 2005.
- For a pamphlet comparing the annual cost of home care and nursing home care across the country see U.S. Office of Personnel Management.
- Ibid.
- Marc Page Freiman, “A New Look at U.S. Expenditures for Long-Term Care and Independent Living Services, Settings, and Technologies for the Year 2000,” AARP, AARP Public Policy Institute, March 2005.
- See “Medicaid Long-Term Care: Successful State Efforts to Expand Home Services While Limiting Costs,” U.S. General Accounting Office, August 1994.
- Ohio Commission to Reform Medicaid, “Transforming Ohio Medicaid: Improving Health Quality and Value,” State of Ohio , January 2005.
- Mark R. Meiners, Director, Partnership for Long-Term Care, Center for Health Policy, Research and Ethics, George Mason University.
- Adrianna Takada and Patrick Breen, The New York State Partnership for Long-Term Care, State of New York Department of Health, Quarterly Update , Special Edition, Vol. 12, No. 1-2, January 1, 2004, to June 30, 2004.
- Data are United States for 1999. Average length of stay for current residents was significantly longer than for discharged – about 892 days. See A. Jones, “The National Nursing Home Survey: 1999 Summary,” Vital and Health Statistics, Series 13, No. 152, National Center for Health Statistics, June 2002.
- Claims include those for nursing home care, assisted living and home care services. See Dawn Helwig, Milliman USA , April 2005. Also see discussion in Susan B. Garland, “Long-Term-Care Insurance: How Much Is too Much?” New York Times , July 24, 2005.
- For more information about reverse mortgages see “Independent Information on Reverse Mortgages,” National Center for Home Equity Conversion.
- “Use Your Home To Stay At Home: Program Study Shows That Reverse Mortgages Can Help Many With Long-Term Care Expenses,” National Council on the Aging, Press Release and Fact Sheet, April 15, 2004.
- For a pamphlet on the annual cost of home care and nursing home care across the country, see U.S. Office of Personnel Management.
- Stephen A. Moses, “How to Save Medicaid $20 Billion Per Year and Improve the Program in the Process,” Center for Long-Term Care Financing, 2005.
- A life settlement is similar to a viatical settlement but does not require terminal illness to qualify. Policy owners can sell a life insurance policy for an amount much higher than the cash surrender value. See “Viatical Settlements,” Medicare.gov, March 31, 2005. Access verified January 25, 2006.
- Viatical Settlements: A Guide for People With Terminal Illness,” Federal Trade Commission, May 1998. Access verified January 2006.
- John C. Goodman and Devon M. Herrick, “Reforming Medicaid: More Flexibility For The States,” National Center For Policy Analysis, Brief Analysis No. 515, May 13, 2005.
- This section is based on Matthew Pakula, “The Legal Responsibility of Adult Children to Care for Indigent Parents,” National Center for Policy Analysis, Brief Analysis No. 521, July 12, 2005.
- Jeanne M. Lambrew, “Making Medicaid a Block Grant Program: An Analysis of the Implications of Past Proposals ,” Milbank Quarterly , Vol. 83, No. 1, January 26, 2005.
- Vernon K. Smith and Greg Moody, “Medicaid 2005: Principles and Proposals for Reform,” National Governors Association, February 2005.
- The President’s proposed a block grant that was budget-neutral for 2004. This would essentially lock into place each state’s 2004 payment for acute care.
- Jeanne M. Lambrew, “Making Medicaid a Block Grant Program: An Analysis of the Implications of Past Proposals ,” Milbank Quarterly , Vol. 83, No. 1, January 26, 2005.
- “Budget Options 2005,” Congressional Budget Office, Section 550 Health, 550-08–Mandatory Convert Medicaid Disproportionate Share Hospital Payments into a Block Grant (Section 13 of 22), February 15, 2005.
- James C. Robinson, “Renewed Emphasis on Consumer Cost Sharing In Health Insurance Benefit Design,” Health Affairs , Web Exclusive, March 20, 2002. Access verified August 16, 2005. See also Jason S. Lee and Laura Tollen, “How Low Can You Go? The Impact of Reduced Benefits and Increased Cost Sharing,” Health Affairs , Web Exclusive, June 19, 2002. Access verified August 16, 2005.
- Utah received a waiver in 2002 that allowed it to increase cost sharing through enrollment fees and copayments. Oregon received a waiver to impose nominal premiums of $6 to $20 per month. For a discussion see Marilyn Werber Serafini, “Balancing Act,” National Journal , August 13, 2005.
- For a discussion on a health plan where cost-sharing varies by type of condition, see Shaun Matisonn, “Medical Savings Accounts and Prescription Drugs: Evidence from South Africa ,” National Center for Policy Analysis, Policy Report No. 254, August 2002.
- Mark R. Meiners, Director, Partnership for Long-Term Care, University of Maryland.
- “The Deficit Reduction Omnibus Reconciliation Act of 2005” allows expansion of Long Term Care Partnership Programs to all states.
- “Medical and Dental Expenses,” IRS Publication 502, 2004.
A formula called FMAP (Federal Medicaid Assistance Percentage or the “federal match”) is used to determine the percentage the federal government contributes to individual state programs. The FMAP formula is not unique to Medicaid. It was established in 1946 and used to fund hospital construction under the Hill-Burton Act. FMAP was later used to determine benefi ts under Social Security’s Medical Assistance to the Aged program in 1958. At that time, the federal matching rate was narrower, ranging from a “floor” of 50 percent to a “ceiling” of 65 percent.1 In 1960, amendments to the Social Security Act raised the matching-rate ceiling to 80 percent. Once Medicaid was established in 1965, the formula was again revised, with a new maximum rate of 83 percent. The term “matching” is misleading, however. We would normally think of matching in terms of the government paying anywhere from 50 cents to 83 cents (depending on a state’s matching rate) for every dollar the state spends. However, that is not the case. Consider New York, with a matching rate of 65 percent. Given one dollar of Medicaid expenditures, New York pays 35 cents of that dollar, while the federal government pays the other half. Therefore, the federal government does not actually contribute 65 cents for each New York dollar of Medicaid; rather it contributes $1.86 for every dollar that New York spends. Similarly, if a state has a matching rate of 83 percent, the federal government contributes about $4.88 for every dollar the state spends on Medicaid.
The current formula is2
The first term on the right-hand side of the equation, 0.45, is called the multiplier. The second term is the ratio of a state’s per capita income (state PCI) to the overall United States per capita income (U.S. PCI), and is known as relative per capita income. This term is intended to represent a state’s resources as well as its general poverty rate. When the ratio of the state’s PCI to the U.S. PCI is multiplied by .45 and subtracted from one, the resulting value determines the federal government’s matching rate for that state. For simplicity, suppose a state’s PCI is the same as the U.S. PCI. The 0.45 means that the federal matching rate for that state would 55 percent.3 Notice, however, that the per capita ratio term is squared. This is done to magnify the differences among states in terms of resources and people in poverty. Additionally, the federal matching rate has a “floor” – it does not fall below 50 percent. (But recall that the federal government actually pays 65 percent of the cost, due to the enhanced match.) For example, suppose a state’s PCI ratio is 1.10, meaning their PCI is 10 percent higher than the U.S. average. Technically, their matching rate should be about 45 percent, but due to the fl oor, they receive 50 percent.4 On the other hand, a state with a PCI ratio of .95 (indicating only 95 percent of the U.S. average) receives a matching rate of 59 percent.
In determining a state’s PCI, the U.S. Department of Health and Human Services (HHS) uses the state’s average PCI over three years, beginning with the most recently available annual data, which is usually the rate in the fi scal year before the matching rate is effective.5
Critics of the formula have several arguments against the FMAP. First, the formula was ostensibly designed to narrow disparities among wealthy and poorer states by giving poor states a higher federal matching rate. But the 50 percent “floor” gives high-income states such as New York money that they may not need. It therefore widens the gap between rich and poor states, something that the formula was intended to remedy.
Moreover, critics argue that the PCI measurement has its own problems. First, using a threeyear- average to determine a state’s PCI is outdated since the most recent year used is the end of the fi scal year before the year that benefi ts are allotted, as well as the two years prior; therefore, the PCI does not refl ect a state’s current economic conditions. Second, they note that PCI is a poor measure of a state’s poverty population. It does not completely measure a state’s resources, nor does it indicate what percentage of the population is poverty-level. As a result, policymakers have debated using other measures, such as a state’s taxable total resources (TTR) to determine a state’s ability to fund Medicaid.6
- Kathryn G. Allen; Memorandum to Senator Daniel Patrick Moynihan, “Medicaid Formula: Effects of Proposed Formula on Federal Shares of State Spending.” U.S. Government Accountability Office, GAO/HEHS-99-29R, February 19, 1999; pages 1 – 30.
- “Medicaid Formula: Differences in Funding Ability among States Often Are Widened,” U.S. Government Accountability Offi ce, Report No. GAO-03-620, August 11, 2003.
- For a more detailed description of how the Medicaid federal match is calculated see “Medicaid Formula: Differences in Funding Ability among States Often Are Widened,” U.S. Government Accountability Offi ce, Report No. GAO-03-620, August 11, 2003, Appendix I: Legislative History and Description of the Matching Formula.
- States also received an enhancement of the matching rate, which is 30 percent of the difference between 100 and the calculated matching rate or the floor rate.
- “Medicaid Formula: Differences in Funding Ability Among States Often Are Widened.”
- For a description and analysis of the TTR, see “Medicaid Formula Proposal (pdf),” U.S. Government Accountability Office, Health, Education and Human Services Division, Report No. GAO/HEHS-99-29R.
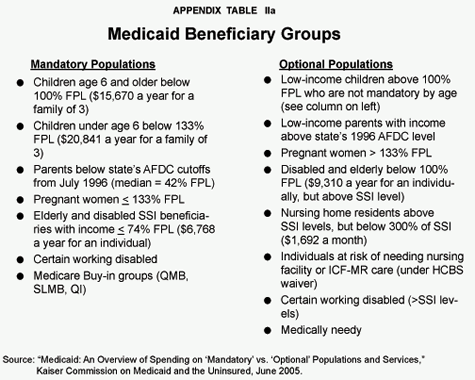
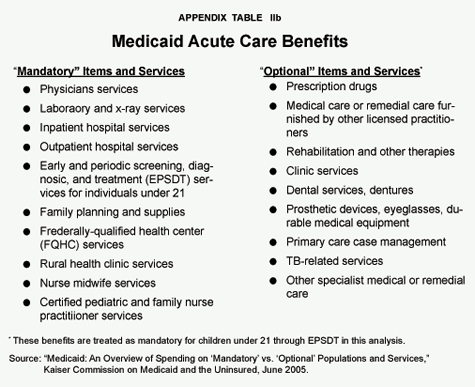
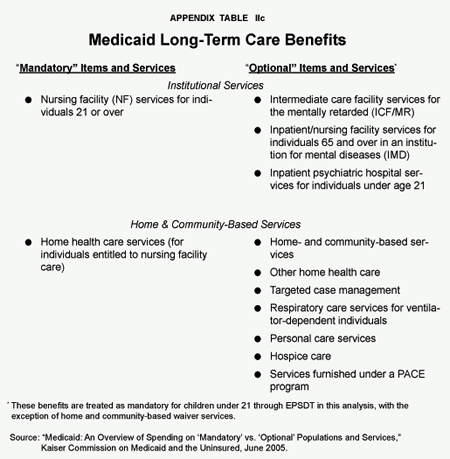
John C. Goodman is the founder and president of the National Center for Policy Analysis. The National Journal recently dubbed him the “Father of Health Savings Accounts,” and he has pioneered research in consumer-driven health care.
Dr. Goodman is the author/coauthor of eight books and more than 50 published studies on health care policy and other topics. He received a Doctor of Philosophy degree in economics from Columbia University. He has taught and done research at several colleges and universities including Columbia University, Stanford University, Dartmouth University, Southern Methodist University and the University of Dallas.
Michael Bond is Director of the Center for Health Care Policy at the Buckeye Institute and a professor in the Department of Finance at Cleveland State University. His work on Medical Savings Accounts (MSAs) and health-care policy reform has received national attention and appeared in a wide range of professional and popular publications, including Health Care Financial Management, Public Personnel Management, Compensation and Benefits Review, Benefits Quarterly and Business Horizons. He is the author of the nation’s first practical guide to establishing MSAs (published by the Buckeye Institute in 1997). He earned his Doctor of Philosophy degree and Master of Arts degree in economics from Case Western Reserve University.
Devon Herrick is a senior fellow with the National Center for Policy Analysis. He concentrates on such health care issues as Internet-based medicine, health insurance and the uninsured, and pharmaceutical drug issues. His research interests also include managed care, patient empowerment, medical privacy and technology-related issues.
Herrick received a Doctor of Philosophy degree in Political Economy and a Master of Public Affairs degree from the University of Texas at Dallas with a concentration in economic development. He also holds an Master of Business Administration degree with a concentration in finance from Oklahoma City University and an Master of Business Administration degree from Amber University, as well as a Bachelor of Science degree in Accounting from the University of Central Oklahoma.
Joe Barnett is Director of Publications at the National Center for Policy Analysis, where he is responsible for the institute’s publishing program, working with academic authors, independent experts and the NCPA policy staff in the writing, editing and printing of NCPA books, studies and periodicals. Barnett also edits Daily Policy Digest, the NCPA’s e-mail and Web-based newsletter summarizing public policy research news for opinion leaders. As an NCPA analyst and editor, he has conducted research, and written and edited studies covering economic, education, welfare, tax and regulatory policies.
Prior to joining the NCPA in 1995, Barnett held various positions with Ernst & Young and McGraw-Hill. He also served three years in Washington, D.C., as a legislative assistant to U.S. Representative Ron Paul (R-Texas). He received a Bachelor of Arts degree in English from the University of Texas at Arlington.
Pamela Villarreal is a graduate student fellow at the National Center for Policy Analysis. She received a Bachelor of Science in Economics degree from the University of Texas at Dallas in 2003, and will receive a Master of Science in Applied Economics degree in the spring of 2006. Pamela has authored or coauthored a number of NCPA publications on such diverse topics as the estate tax, big-box retailers and aid for Hurricane Katrina evacuees.