1European critics of the U.S. health care system often focus on the private provision of health care and health insurance. Yet the more important difference between the United States and other developed countries is the failure to control government spending. Other countries employ global budgets and control access to expensive drugs and new technology. The United States, by contrast, has very meager spending controls. If current trends continue, U.S. government health care spending will consume an ever growing portion of national income — far more so than any other developed country.
Government health care expenditures have grown much more rapidly than the economy in all developed countries. Between 1970 and 2002 these expenditures per capita grew at almost twice the rate of gross domestic product (GDP) per capita in 10 countries studied: Australia, Austria, Canada, Germany, Japan, Norway, Spain, Sweden, the United Kingdom and the United States.
- Over the past 30 years the annual rate of growth in real per capita government spending on health care was highest in Norway (5.3 percent), followed by the United States (5.1 percent) and Spain (5.1 percent).
- The growth rate was lowest in Sweden (2.6 percent) and Canada (3.1 percent).
Health care spending changes over time because of increases in benefits or changes in the age structure of the population. Because older people consume more health care than younger people in every country, aging populations will inevitably cause spending increases. However, benefit growth has been remarkably high and accounts for 75 percent of overall health care spending growth in the 10 countries analyzed. There are clear differences among the countries:
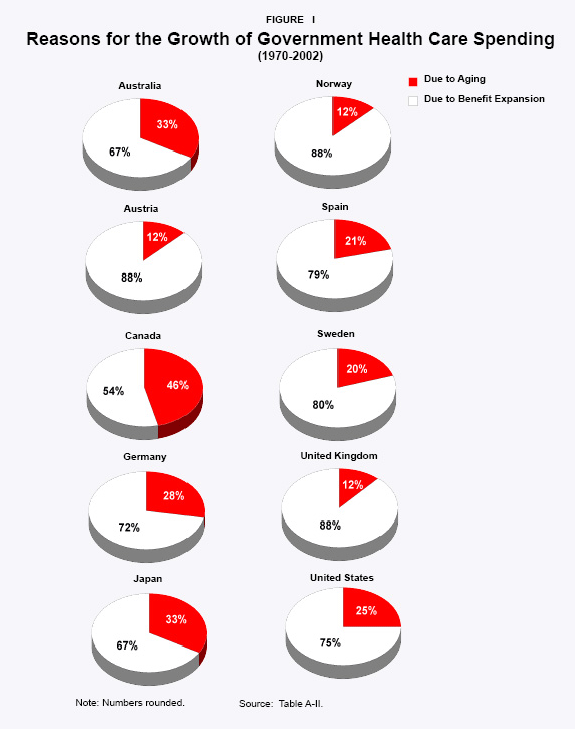
- Although aging explains only one-fourth of the growth of government health care spending overall, it explains almost half the growth (46 percent) in Canada and one-third (33 percent) in Australia and Japan.
- On the other hand, aging explains a little more than one-tenth of the growth (12 percent) in government health care spending in the United Kingdom, Austria and Norway.
Going forward, demographics will play a significant role in determining overall increases in health care spending. In 2002 the share of the population 65 and older in our 10 countries averaged 15 percent. By mid-century it will average 26 percent. Japan will remain the oldest of our countries, ending up in 2050 with 37 percent of its population age 65 or older — twice the ratio today. In Spain, Canada and Austria, the share of the elderly population will also double. The United States will retain its ranking as the youngest of the 10 countries. Its 2050 elderly share is projected at 21 percent.
By mid-century government health care spending will claim a much larger share of national resources than it does today.
- If current trends hold in the United States , by 2050 government health care spending will claim one-third of GDP.
- Government health care spending as a share of GDP will triple in Norway (to 25 percent) and more than triple in Australia and Spain (to 21.1 percent).
- More modest increases are predicted for Canada and Sweden , where the numbers will reach 13.5 percent and 12.9 percent, respectively.
By comparison, Japan 's government is now spending only 6.7 percent of the nation's output on health care, and spending will total 18.2 percent of GDP by mid-century. In the United States, government health care spending now totals about 6.6 percent of GDP. But if it continues to let benefits grow for the next five decades at past rates, it will end up spending 32.7 percent of its GDP on health care.
No country can spend an ever-rising share of its output on health care, indefinitely. There is a limit to how much a government can extract from the young to accommodate the old. When that limit is reached, governments go broke. Of the 10 countries considered here, the United States appears most likely to hit this limit.
[page]Government health care spending in developed countries grew much more rapidly than the economies of those countries over the past three decades. This phenomenon can be explained by answering two questions: How much of health care expenditure growth is due to demographic change (the aging of society)? How much is due to increases in spending on the average beneficiary (at different ages)?2 The distinction is important. Spending levels are determined by government policy, whereas demographics are largely outside government control.
This study uses demographic data from the Organization for Economic Cooperation and Development (OECD) and spending profiles based on the age and health status of beneficiary groups in each country to measure the growth in real (inflation-adjusted) health care spending between 1970 and 2002 in 10 OECD countries: Australia, Austria, Canada, Germany, Japan, Norway, Spain, Sweden, the United Kingdom and the United States. We first explain why health care spending has been rising. We then project the trend of the past 30 years forward to the mid-21st century.3
[page]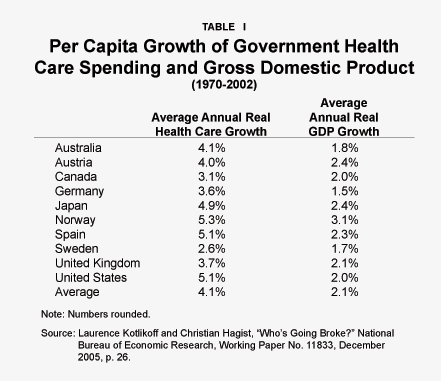
"Government health care spending in developed countries has grown twice as fast as their economies."
Government health care expenditures have been growing much more rapidly than gross domestic product (GDP) in all OECD countries. Between 1970 and 2002 these expenditures grew at almost twice the rate of GDP across the 10 countries. There are substantial differences among the countries, however, due largely to differences in governments' willingness to expand health care spending rather than to differences in demographic changes.
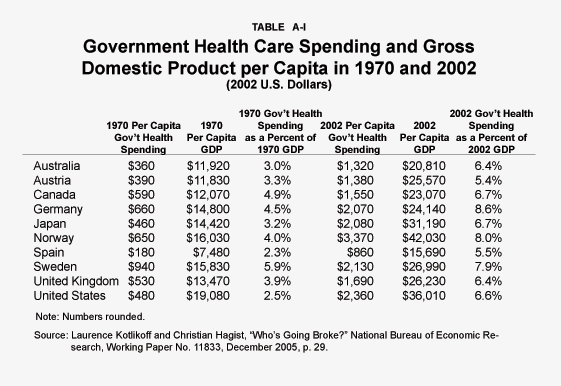
Health Care Growth versus the Growth of Per Capita Output. Table A-I in the appendix shows the level of government spending on health care per capita and per capita output in each of the 10 countries for 1970 and 2002. The table also shows how the percentage of each country's resources spent on government health care programs has increased over the period. Table I in the text shows the average annual growth per capita of health spending and GDP in each of the countries.
As Table I shows, over the past 30 years the annual rate of growth in real per capita government spending on health care was highest in Norway (5.3 percent), followed by the United States (5.1 percent) and Spain (5.1 percent). The growth rate was lowest in Sweden (2.6 percent) and Canada (3.1 percent). Overall government health spending per capita grew 1.9 times as fast as GDP per capita in the 10 countries. Spending grew 2.6 times faster than GDP in the United States, 2.4 times faster than GDP in Germany and 2 times faster in Japan.4
"Health spending changes over time because of benefit increases and changes in the age structure of the population."
Analyzing the Reasons for Growth. Government health care spending can be thought of as having two components: the average amount of spending on people at different ages (the level of benefits) and the number of people in each age bracket. Spending changes over time because of increases in benefits or changes in the age structure of the population. Because older people consume more health care than younger people in every country, the aging of the population will cause an increase in spending. Table II shows how spending varies by age in the various countries. Canada, for example, spends 7.5 times as much on people in their 80s as it spends on people in their 50s. In Australia and the United Kingdom the ratio is more than four to one. In Austria, Spain and Sweden, however, the spending ratio for the two age groups is close to two to one.
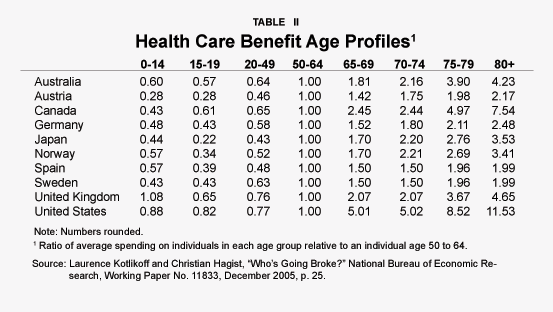
Note that the figures for the United States (an 11-to-one ratio of average spending on all those in their 80s versus all those in their 50s) cannot be compared directly to the figures for other countries because U.S. expenditures are for two specific populations — the elderly and the poor — whereas government health programs in the other nine countries cover most of the population. Thus spending profiles are quite different in the United States. In the case of Medicare, virtually all U.S. citizens qualify once they reach age 65. But only the disabled qualify prior to age 65.
"Benefit growth explains the lion’s share – 75 percent – of overall health care spending growth in the 10 countries."
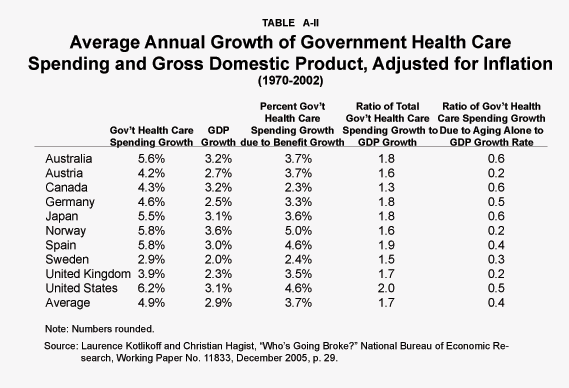
How much of the growth of government health care spending is due to demographic change (aging) and how much is due to increases in benefit levels? As shown in Table A-II in the appendix, benefit growth has been remarkably high and explains the lion's share — 75 percent — of overall health care spending growth in the 10 countries.5 Norway , Spain and the United States recorded the highest annual benefit growth. Norway averaged 5.0 percent per year. Spain and the United States were close behind at 4.6 percent.6
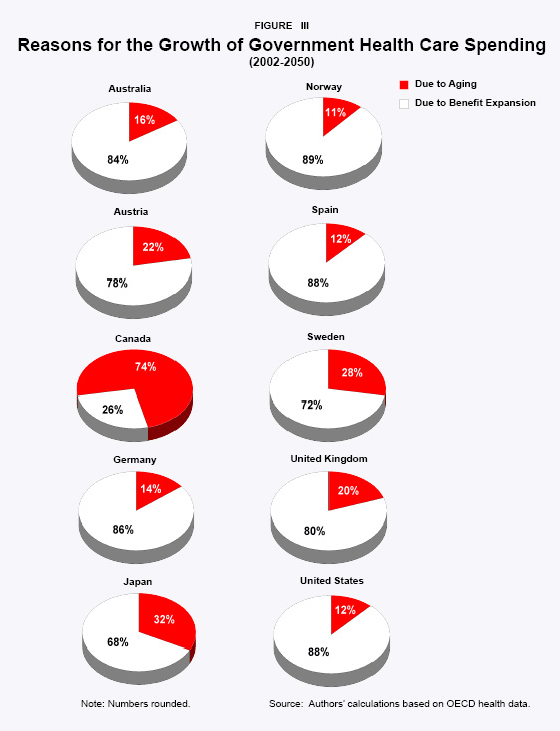
Again, there are clear differences among the countries. Although aging explains about one-fourth of the growth of government health care spending overall, it explains almost half the growth (46 percent) in Canada and one-third (33 percent) in Australia and Japan. On the other hand, aging explains a little more than one-eighth (12 percent) of the growth in government health care spending in the United Kingdom, Austria and Norway. [See Figure I.]
The last two columns of Table A-II compare total government health care spending growth to GDP growth with and without benefit growth over the 32-year period. Total real health care spending grew an average of 4.9 percent per year across the 10 countries. Had there been no growth in benefits, average spending would have increased at a rate of only 1.2 percent. Hence, three-fourths of health care spending growth can be traced to the growth of benefits.
During the same period, real GDP in these 10 countries was also growing, just not as rapidly. Real GDP grew an average of 2.9 percent annually. On average, government health care spending grew 1.7 times faster than GDP. Absent benefit growth, total health spending would have grown only 0.4 times as fast.
As the first column of Table A-II shows, the United States clocked the highest annual average real growth in spending, 6.2 percent per year. This is twice its 3.1 percent GDP growth rate. Had the level of benefits not increased, U.S. health care spending would have grown only half as fast as the economy. In addition to the United States, total real health spending grew in excess of 5 percent per year in Norway, Spain, Australia and Japan. Among all 10 countries, Sweden had the most success in keeping health care spending from growing faster than the economy. But even in Sweden health care spending grew 1.5 times faster than output [column four of Table A-II].
Explaining the Growth of Benefits. What explains the high rates of benefit growth in these countries? One explanation is the emergence of costly product innovations.7 A good example is Spain 's acquisition of CT scanners. Spain had only 1.6 CT scanners per one million inhabitants in 1984 compared with 11 per million in the United States.8 By 2001, Spain had 12.3 CT scanners per one million inhabitants vs. 12.8 in the United States.9 Japan also expanded its use of medical technology over the 32-year period. Indeed, Japan appears to now have the largest number of CTs of any developed country.10
"Costly advances in medical technology help explain the high rates of benefit growth."
Of course, technology doesn't arise spontaneously. It is acquired, and at considerable cost. The willingness of developed countries to pay larger shares of national income for advanced medical technology as well as medications suggests that health care is a "luxury good."11 The ratio of benefit growth rates to per capita GDP growth rates range from 1.14 in Canada to 2.29 in the United States. On the average, the ratio equals 1.73. This implies that for each 10 percent increase in per capita income there is a 17 percent increase in government spending on health care, on the average.12
Benefit Growth Through Expansion of Government's Share of Health Spending. Total benefit payments may be thought of as having two sources of expansion: (1) the growth in spending on people at a given age and (2) the growth in the percentage of the population at various ages covered by government programs. In the United States, for example, the rate of growth in Medicare spending per enrollee is close to the per person growth in spending by the privately insured.13 But over time, the number of enrollees in government health care programs has expanded, largely because of the increase in Medicare disabled enrollees. The growth in Medicaid spending has been fueled by the expansion of the eligible population to include the near-poor in addition to individuals in families with incomes below the poverty level. As a result, government health care spending has grown about 11 percent faster than private sector spending (10.79 percent versus 9.76 percent).14 In the other nine countries, by contrast, government health programs effectively cover the whole population, regardless of age. Thus there is little room for expansion of the beneficiary population.
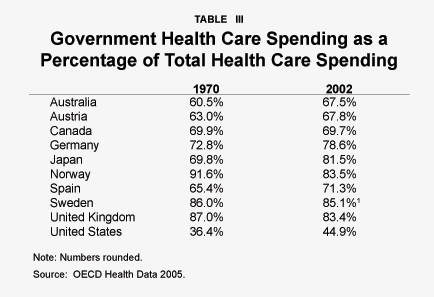
"Government spending has expanded to 44.9 percent of total health care spending in the United States over the past three decades."
Overall, as shown in Table III, public sector spending has expanded from 36.4 percent to 44.9 percent of total health care spending in the United States over the three decades. The government's share of health care spending also grew significantly in Australia (from 60.5 percent to 67.5 percent), Germany (from 72.8 percent to 78.6 percent) and in Japan (from 69.8 to 81.5 percent).
[page]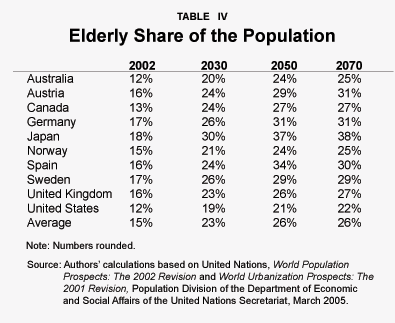
Although it is somewhat hazardous to extrapolate past trends many decades into the future, it is instructive to examine the path we are on now. If the 10 countries do not change course, what does the future hold?
Population Aging Over the Next 50 Years. Going forward, demographics will play a significant role in determining overall increases in health care spending. In 2002 the share of the population 65 and older in our 10 countries averaged 15 percent. By mid-century it will average 26 percent — a 75 percent increase. Table IV shows how the population share of the elderly will change in the 10 countries through time. Japan, which is currently the oldest of our countries, will retain that ranking, ending up in 2050 with 37 percent of its population age 65 or older — twice the ratio today. In Spain, Canada and Austria, the share of the population that is elderly will also double. The United States will retain its ranking as the youngest of the 10 countries. Its 2050 elderly share is projected at 21 percent, not much greater than the elderly share of the Japanese population today. By mid-century, the proportion of the elderly population across all 10 countries will increase from an average of about 15 percent today to 26 percent.
"The elderly share of the population in all 10 countries will increase from an average of about 15 percent today to 26 percent in 2050."
Since spending on health care is much higher for the elderly than for the young, continuing to let benefits grow as a country ages will accelerate the increase in health care spending. In the United States, for example, real government health care spending increased 690 percent between 1970 and 2002. If real benefit levels continue to grow at historic rates, real U.S. health care spending will increase 750 percent over the next 32 years. Absent past benefit growth, U.S. total real health care spending would have grown 160 percent between 1970 and 2002. And absent future benefit growth, it would grow 180 percent over the next 32 years. While demographics matter to overall health care spending, they are swamped in importance by benefit growth.
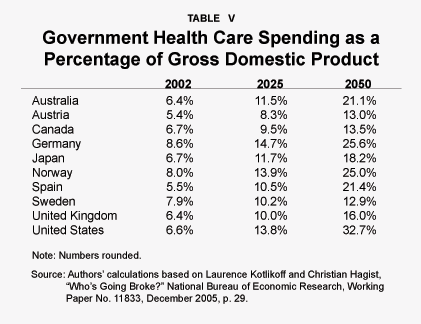
Government Health Care Spending as a Percent of GDP at Mid-Century. By mid-century government health care spending will claim a much larger share of national resources than it does today, in all 10 countries. [See Table V.] If current trends hold, by 2050 government health care spending will claim a whopping one-third of United States GDP. Over the next 50 years, resources supporting government health care spending will double in Australia and Spain and almost double in Norway. More modest increases are predicted for Canada and Sweden. [See Figure II.]
"Health care spending as a percentage of GDP will double in Australia and Spain over the next 50 years."
Analyzing the Reasons for Growth. Figure III shows how much of the expansion of government health care is due to demographics versus benefit growth (based on Table A-II in the Appendix). As the figure shows, if Canada manages to control budget growth in the future the way it has in the past, almost three-fourths of the growth in spending by mid-century will be due to the aging of the Canadian population and only one-fourth will be due to benefit expansion. In Japan, demographics will account for almost one-third of the spending increase, and benefit expansion will explain the other two-thirds. Demographics will account for about one-fourth of the spending increase in Sweden (28 percent), and slightly less than one-fourth in Austria (22 percent). By contrast, demographics alone will cause only 12 percent of the spending increase in Spain, Austria and the United States, and 11 percent in Norway.
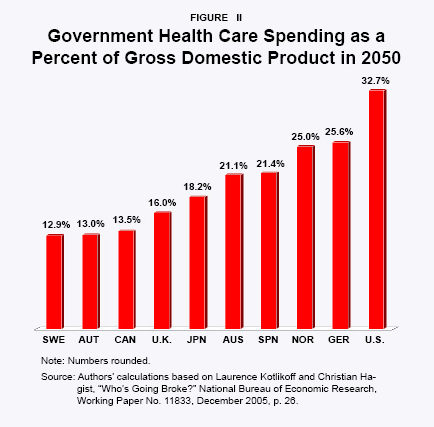
"By 2050, government health care spending will claim one-third of the U.S. economy if current trends continue."
The United States versus Japan. Japan's government is now spending only 6.7 percent of the nation's output on health care. If Japan maintains the same annual real benefit growth of 3.57 percent it experienced from 1970 to 2002 and its current rate of labor productivity, government health care spending will total 18.2 percent of GDP by mid-century. In the United States, government health care spending now totals about 6.6 percent of GDP. But if it continues to let benefits grow for the next five decades at past rates, it will end up spending one-third of its future GDP on health care.
"Excessive benefit growth is a more important factor than rising health care costs."
The difference between Japan's 18 percent and the United States' 33 percent is remarkable given that Japan is already much older than the United States and will age much more rapidly in the coming decades. The difference accentuates the obvious: Excessive growth in benefits can be much more important than aging in determining long-term health care costs. Moreover, the fact that projected U.S. health care expenditures are so high — the highest of any of our 10 countries when measured relative to GDP — suggests that the United States may be in the worst overall fiscal shape of any of the OECD countries, even though its demographics are among the most favorable.
Indeed, three-fourths of overall health care expenditure growth in the 10 OECD countries analyzed— and virtually all of the growth in health care expenditure per capita — reflect growth in benefits. Although OECD countries are projected to age dramatically, benefit growth, if it continues apace, will remain the major determinant of overall health care spending growth.
Because of different growth rates, our projections envision a radical divergence in health care spending by mid-century. But are such divergences sustainable?
One way to think about the unsustainability of the current path over time is to compare the United States and Canada. If private sector health care spending grows at the same rate as the public sector, the United States will be spending two-thirds of its national income on health care by 2050. By contrast, Canadians living across the border will be spending less than one-fifth. At the extreme, two outcomes are imaginable. U.S. citizens at that point could be enjoying medical technology breakthroughs that greatly enhance the quality of life, breakthroughs that would be denied to Canadians. Or the United States could be spending enormous amounts of money on care that provides only trivial quality of life improvements — in which case, Americans will be forgoing all sorts of other goods and services to which Canadians will have access. In either case, the radical divergence in living standards by populations whose underlying cultures are very similar is hard to imagine.
"No country can spend an ever-rising share of its output on health care, indefinitely."
Regardless of the benefits of health care spending, the very rapid growth documented here is clearly unsustainable. No country can spend an ever-rising share of its output on health care, indefinitely. Benefit growth must eventually fall in line with growth in per capita income. The real question is not if, but when, health care benefit growth will slow down. Raising benefit levels is one thing. Cutting them is another. If OECD governments spend the next three decades expanding benefit levels at their historic rates, the fiscal repercussions will be enormous and in large part irreversible.
The fiscal fallout is likely to be particularly severe for the United States. Like Norway and Spain, its benefit growth has been extremely high. But unlike Norway, Spain, and other OECD countries, the United States appears to lack both the institutional mechanisms (such as gatekeepers to control patients' access to care) and the political will to control its health care spending. America's elderly are politically very well organized, and each cohort of retirees has, since the 1950s, used its political power to extract ever greater transfers from younger workers. The recently-legislated Medicare drug benefit is a case in point. The present value costs of this unfunded liability are roughly $10 trillion, all to be paid for by future taxpayers.
There is, of course, a limit to how much a government can extract from the young to accommodate the old. When that limit is reached, governments go broke. Of the 10 countries considered here, the United States appears the most likely to hit this limit.
NOTE: Nothing written here should be construed as necessarily reflecting the views of the National Center for Policy Analysis or as an attempt to aid or hinder the passage of any bill before Congress.
[page]- This study is based on Laurence Kotlikoff and Christian Hagist, "Who's Going Broke? Comparing Healthcare Costs in Ten OECD Countries," National Bureau of Economic Research, Working Paper No. 11833, December 2005.
- Friedrich Breyer and Volker Ulrich, "Gesundheitsausgaben, Alter and Medizinischer Fortschritt: eine Regressionsanalyse," Jahrbuch für Nationalökonomie und Statistik, Vol. 1, 2000, pages 1-17, and Meena Seshamani and Alastair Gray, "Healthcare Expenditures and Aging: An International Comparison," Applied Health Economics and Health Policy , Vol. 2, No. 1, 2003, pages 9-16, examine the growth of health expenditures in Germany, Japan and the United Kingdom.
- For an explanation of the methodology, see Laurence Kotlikoff and Christian Hagist, "Who's Going Broke?"
- The 1.9 factor is obtained by averaging the 10 country-specific ratios of A to B, where A is the 1970-2002 growth rate of real health care expenditures and B is the 1970-2002 growth rate of real GDP.
- Table A-II shows overall growth rates, in contrast to the per capita growth rates shown in Table A-I.
- See Table 5 in Laurence Kotlikoff and Christian Hagist, "Who's Going Broke?"
- See Joseph P. Newhouse, "Medical Care Costs: How Much Welfare Loss?" Journal of Economic Perspectives, Vol. 6, No. 3, 1992, pages 9-16; and Peter Zweifel, "Medical Innovation: A Challenge to Society and Insurance," Geneva Papers on Risk and Insurance: Issues and Practice, Vol. 28. No. 2, 2002, pages 194-202.
- As reported in Organization for Economic Coordination and Development, Health Data 2004, 3rd ed. (Paris: OECD, 2004).
- See OECD, Health Data 2004.
- For this point, see also Uwe E. Reinhardt, Peter S. Hussey and Gerald F. Anderson, "Cross-National Comparisons Systems Using OECD Data," Health Affairs, Vol. 21, No. 3, 2002, pages 169-181.
- For a discussion and an overview of several studies concerning income elasticities of health care expenditures, see Jennifer Roberts, "Sensitivity of Elasticity Estimates for OECD Healthcare Spending: Analysis of a Dynamic Heterogeneous Data Field," Health Economics, Vol. 8, No. 5, 1999, pages 459-472.
- See Table 3 in Laurence Kotlikoff and Christian Hagist, "Who's Going Broke?"
- From 1969 through 2003, Medicare spending per enrollee averaged an annual nominal growth rate of 9.0 percent, compared to 10.1 percent for the privately insured. See Karen Davis and Sara Collins, "Medicare at Forty," Health Care Financing Review, Winter 2005-2006, Vol. 27, No. 2, Table 2, page 57.
- Authors' calculations based on data from the Office of the Actuary, National Health Statistics, Centers for Medicare and Medicaid Services.
Christian Hagist is a Ph.D. student fellow at the Research Center for Generational Contracts, Freiburg University, Germany. He received a German Diploma (equivalent to a master's degree) in Economics from Freiburg University in 2003, and will finish his dissertation in the spring 2007. Hagist spent six month at Boston University in 2005 as a visiting scholar where he worked with Laurence Kotlikoff.
Laurence J. Kotlikoff, a senior fellow with the National Center for Policy Analysis, is Professor of Economics at Boston University, Research Associate of the National Bureau of Economic Research, Fellow of the Econometric Society, a member of the Executive Committee of the American Economic Association and President of Economic Security Planning, Inc., a company specializing in financial planning software. Professor Kotlikoff received his B.A. in Economics from the University of Pennsylvania in 1973 and his Ph.D. in Economics from Harvard University in 1977. From 1977 through 1983 he served on the faculties of economics of the University of California, Los Angeles and Yale University. In 1981-82 Professor Kotlikoff was a Senior Economist with the President's Council of Economic Advisers. Professor Kotlikoff is coauthor (with Alan Auerbach) of Macroeconomics: An Integrated Approach and Dynamic Fiscal Policy ; author of Generational Accounting, What Determines Savings?; coauthor (with Daniel Smith) of Pensions in the American Economy; and coauthor (with David Wise) of The Wage Carrot and the Pension Stick. In addition, he has published extensively in professional journals, newspapers and magazines.