It is commonly understood that Social Security replaces about 40 percent of preretirement earnings for average workers. But what are we trying to replace? And why? If the real goal is to maintain consumption during retirement at levels comparable to preretirement consumption, preretirement earnings are not a very good guide. Fringe benefits comprise a growing share of preretirement compensation, particularly health insurance.
Even if we are confident we are measuring the right set of numbers, there is a further problem: How do you compare consumption opportunities over many years? Reported Social Security replacement rates are based on converting workers' past earnings into today's dollars using the rise in average wages over time — a process known as wage indexing. But since wages usually rise faster than prices, wage indexing compensates retirees more than is necessary to maintain their purchasing power. Price indexing, by contrast, would give a more accurate measure of preretirement resources available for consumption. The two indices produce very different replacement rates:
- Using wage indexing, Social Security replaces about 45 percent of preretirement earnings for the average worker retiring this year.
- Using price indexing, Social Security replaces about 55 percent of preretirement earnings.
The wages that Social Security payments are based on are essentially cash wages. They do not include noncash employee benefits. However, these fringe benefit dollars either allow direct consumption (in the case of health care, for example) or later consumption (as is the case with 401(k) contributions, for example). Thus, including fringe benefits would give a more accurate picture of earnings available for consumption. If preretirement health care dollars are added in and payroll taxes that fund Medicare are subtracted out, Medicare dollars net of premium payments should be added to Social Security to get comparable consumption figures for the years of retirement. Also, since payroll taxes that fund Social Security and Medicare are not available for consumption, these taxes should be subtracted from preretirement income along with other labor taxes to give a more accurate gauge of preretirement consumption opportunities. With these adjustments, the government replaces 85.3 percent of price-indexed preretirement "consumable income" for the average worker.
Looking to the future, the replacement rate will rise over time:
- For workers who are 46 years old today, elderly entitlements will replace 105.3 percent of price-indexed average preretirement compensation, net of federal labor taxes.
- As a result, today's middle-age workers will, on the average, consume more during an average year in retirement with government benefits alone (not including pensions and personal savings) than before retirement.
Since Social Security's replacement rate for preretirement earnings will remain relatively constant over time, almost all of the increase in replacement rates is due to Medicare. In fact, Medicare's replacement rate will rise dramatically:
- Medicare's replacement rate will grow over the next 20 years, from 37 percent of preretirement earnings for new retirees today to about 48 percent by the time today's 46-year-old workers retire, based on current projections.
- Although Medicare's replacement rate equals 70 percent of Social Security's rate for new retirees, it will equal 90 percent for workers retiring in 2027.
- For workers younger than age 37, Medicare benefits are projected to be larger than Social Security benefits, on the average.
Social Security and Medicare benefits are more generous than commonly thought, and benefits paid to seniors are projected to grow rapidly over time. Unfortunately, this growth in benefits will likely prove to be unsustainable. Policymakers must consider ways to control the growth in federal entitlement spending before it swamps the entire federal budget.
[page]This paper examines the size of elderly entitlements in several revealing ways. It identifies the degree to which Social Security and Medicare benefits replace preretirement income and consumption for new retirees and illustrates the relative growth in benefit payments to future retirees.1 Social Security replaces about 40 percent of earnings for average workers based on Social Security Trustees Report estimates.2 But workers' preretirement earnings are not the right target. If the real goal is to maintain consumption during retirement at levels comparable to consumption before retirement, earnings are not a good measure; potential consumption is better. By one measure, Social Security currently replaces more than half of preretirement consumption for the average worker. Social Security and Medicare together replace more than four-fifths of preretirement consumption for average retirees today, and that replacement rate will grow even larger over time.
[page]"Elderly entitlements should be compared to preretirement consumption instead of wages."
A convenient way to measure the value of Social Security benefits is to calculate the percentage of retirees' preretirement, or lifetime, earnings the benefits replace. Table I is based on projections in the 2006 Social Security Trustees Report and shows rates for workers in different income groups who are ages 65, 45 and 20 today.
The percentage of preretirement wages Social Security benefits replace depends on retirees' wage histories. Social Security replaces a smaller percentage of higher-wage workers' incomes because of the progressive benefit formula. Table I shows that for people who retired last year at the normal retirement age:
- Social Security benefits replaced 30.1 percent of preretirement wages for individuals who earned the maximum taxable income ($94,200 currently);
- Benefits replaced 43.1 percent of preretirement wages for individuals with medium lifetime earnings; and
- Benefits replaced 58.1 percent for individuals who earned 45 percent of the Social Security average wage over their careers.
Table I also indicates that the percentage of wages Social Security will replace for each income group will stabilize in the future due to changes to the benefit formula included in Social Security reforms enacted in 1983.3
[page]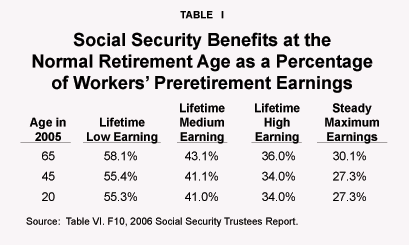
"Social Security replaces a higher percentage of wages for low-income workers than high-income workers."
When comparing the degree to which today's Social Security benefits replace the purchasing power of past earnings, it is important to use an appropriate method. The replacement rates given in the Trustees Reports are determined by comparing benefits at retirement to an individual's average annual lifetime earnings. Because of changes in price levels over time (inflation), past earnings must be adjusted so they are comparable to wages earned today. Ordinarily, this would be done by using a price index like the Consumer Price Index (CPI).4
However, the replacement rates presented in the Trustees Reports are determined by adjusting past earnings by means of a wage index. Since wages tend to rise more rapidly than prices over time (contributing to the growth in real incomes), wage indexing also produces higher average lifetime earnings than using a price index would.
"Wage indexing and price indexing of past earnings yields different results."
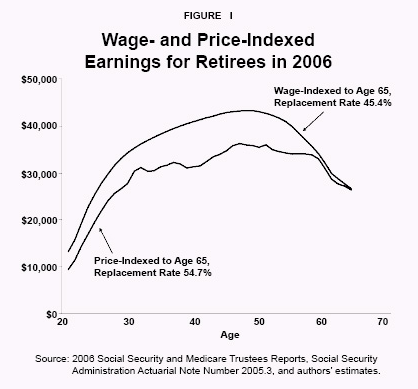
Effects of Price Indexing versus Wage Indexing. Figure I illustrates the effects of wage indexing and price indexing for average workers retiring this year.5 The same wages are used in each case, before accounting for inflation, but past wages are adjusted into today's dollars at retirement in two different ways: 1) wage-indexed to the Social Security average wage at age 65 and 2) price-indexed to the price level at age 65. As Figure I shows, the two methods produce different results:
- Using wage indexing, Social Security replaces about 45.4 percent of preretirement earnings for the average worker.6
- Using price indexing, by contrast, Social Security replaces 54.7 percent of preretirement consumption.
"Social Security replaces almost three-fourths of the real preretirement income of low-wage workers."
As these examples suggest, the way in which past earnings are compared to the Social Security benefits awarded to seniors at retirement makes a big difference in determining how much of lifetime earnings those benefits replace.
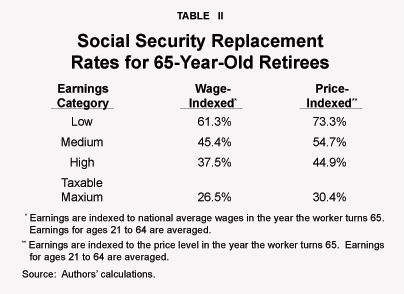
Table II presents the two alternative methods of calculating Social Security replacement rates for new retirees (workers born in 1941), but with four different levels of lifetime earnings (low, medium, high and earnings at the taxable maximum in each year). As suggested above, price indexing produces systematically higher replacement rates than wage indexing, and replacement rates fall as earnings rise due to Social Security's progressive benefit formula.
"Health care — before and after retirement — is part of consumption."
Most important, price indexing shows Social Security replaces 73.3 percent of the average lifetime earnings of low-earning workers while wage indexing indicates a 61.3 percent replacement rate. The price-indexed replacement rate for high earners is 44.9 percent.7 These estimates suggest that Social Security benefits are more generous than commonly thought.
[page]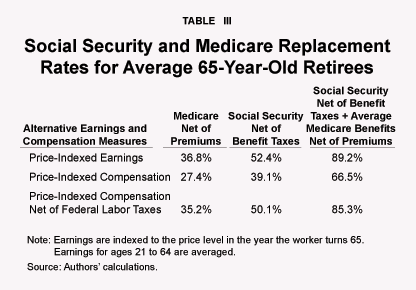
"Payroll taxes are not available for consumption."
Given that Social Security benefits are based on past earnings, it is natural to calculate replacement rates relative to those earnings. However, these comparisons ignore untaxed fringe benefits. Yet, fringe benefit dollars either allow direct consumption (in the case of health care, for example) or they put aside funds for later consumption (as is the case of 401(k) contributions, for example).
To get a more accurate picture of earnings available for consumption, therefore, the value of fringe benefits should be added into the calculation. On the other hand, it makes sense to subtract out payroll taxes and other labor taxes — especially Social Security and Medicare taxes — since these dollars are not available for current consumption.8
"Compensation includes health care and other fringe benefits."
Other adjustments also make sense if preretirement and postretirement consumption opportunities are to be compared. For example, if preretirement health care dollars are added in and payroll taxes that fund Medicare are subtracted out, Medicare dollars net of premium payments should be added to Social Security to get comparable consumption figures for the year of retirement.9 Also, if Social Security and Medicare payroll taxes and other federal labor taxes are taken out during the working years, Social Security benefit taxes paid during retirement should be removed from the calculation for the same reason.
After making all of these adjustments, what remains is after-tax consumable dollars both before and after retirement.
"Medicare will replace a growing share of workers' preretirement wages."
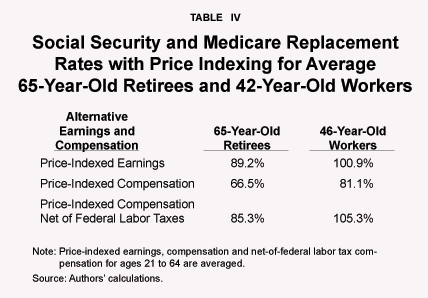
Table III presents replacement rates based on three measures of lifetime earnings or compensation for average workers born in 1941 who reach normal retirement age this year.10 These figures are adjusted by a price index, the conventional way of comparing consumption through time:
- Social Security and Medicare benefits — net of Social Security benefit taxes and Medicare premium payments — replace 89.2 percent of price-indexed earnings and 66.5 percent of price-indexed compensation.
- Surprisingly, when total price-indexed compensation is reduced by the tax payments workers make during their years in the labor force, Social Security and Medicare benefits replace 85.3 percent of average annual preretirement compensation.
"Combined benefits will be higher than preretirement wages for future retirees."
Thus, Medicare and Social Security benefits paid to new retirees will replace more than four-fifths of their average annual preretirement purchasing power.
[page]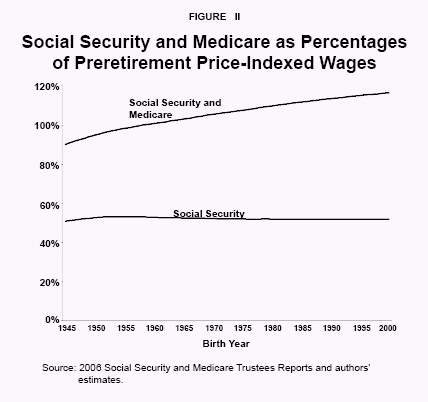
Social Security and Medicare will replace a growing share of preretirement price-indexed wages for future groups of retirees. As Figure II shows:
- Social Security, net of taxes, and Medicare, net of premiums, will replace almost 90 percent of average annual price-indexed earnings for workers born in 1945.
- For workers born in 1960 (retiring in 2027), elderly entitlements are projected to replace 100.9 percent of average wages.
And as Table IV indicates, Social Security and Medicare will replace more than 100 percent of the average preretirement purchasing power of future retirees when compensation net of federal labor taxes is considered. As a result, projected government benefits alone — not including pensions and personal savings — will provide today's middle-aged workers, on the average, higher annual potential consumption in their retirement years than before retirement.
Much of the rise in replacement rates will be due to the growth in Medicare benefits. For average retirees:
- Medicare's replacement rate will grow more than 40 percent over the next 20 years; while it currently replaces over one-third of preretirement consumption for new retirees, it will replace about half for workers retiring in 2027.
- Today, Medicare's replacement rate equals 70 percent of Social Security's for new retirees but will almost equal Social Security for workers retiring in 2027.
Beyond 2036, Medicare benefits for average workers will be greater than Social Security benefits.
[page]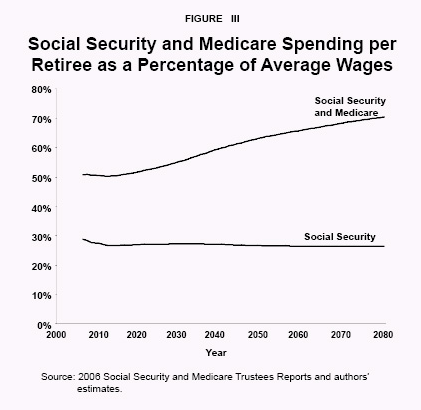
Since workers bear most of the cost of funding Social Security and Medicare benefits, it is revealing to compare Social Security and Medicare spending per senior to the earned incomes of average workers.
"Average Medicare benefits are a growing percentage of average workers' wages."
Average Net Federal Benefits versus the Average Worker's Wage. The average wage used in these comparisons is representative of average earnings in the economy. It includes wages in employment covered by Social Security, wages earned by the 6 percent of workers not covered by Social Security and wages above the taxable maximum.11
"Social Security benefits per retiree will decline as a percentage of average workers' wages."
Figure III presents the net benefits received by retirees as a percentage of average wages. The lower line in Figure III shows average net Social Security benefits received by retirees as a percentage of the average wage.12 In 2006, the average net Social Security benefit paid to retirees is expected to be about 29 percent of the average worker's wage. The percentage is projected to decline slightly due to reductions in payments to early retirees that were implemented as part of the 1983 reforms and to higher taxes on Social Security benefits as retirees' incomes rise. For example, by 2080 the average after-tax Social Security benefit will be 26.5 percent of the average worker's wage.
The upper line in Figure III presents Social Security and Medicare benefits combined. While Social Security benefits per retiree are declining relative to average wages, average Medicare benefits are rising.13 In 2006, average after-tax Medicare benefits are expected to equal 22 percent of the average worker's wage. They are expected to rise to 27 percent over the next 20 years and to 37 percent by midcentury.
- Average after-tax Social Security and Medicare benefits combined equaled 51 percent of average earnings in 2006.
- By the time the last of the baby boomers retire in 2032 combined benefits will equal 56 percent of average wages.
- By midcentury, they will rise to 63 percent and by 2080 they will exceed 70 percent of average wages.
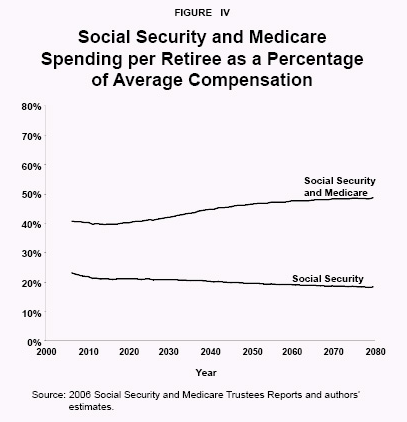
Average Net Federal Benefits versus the Average Worker's Total Compensation. Figure IV compares Social Security and Medicare benefits to total compensation:
- Combined average after-tax Social Security benefits and average Medicare benefits, net of premium payments, are expected to equal 41 percent of workers' average total compensation in 2006.14
- By the time the last of the baby boomers reach retirement age — in 2032 — combined average benefits are projected to grow to 43 percent of workers' average compensation.
- By midcentury, combined benefits will equal 47 percent of average compensation and will equal almost 49 percent by 2080.
"Combined benefits represent a growing share of average workers' total compensation."
Average Net Federal Benefits versus Net Average Compensation. The rising taxes needed to support Social Security and Medicare spending will reduce workers' after-tax compensation and potential consumption. Thus, a final comparison is needed to account for the growing tax burden necessary to support promised benefits.
Figure V shows average net retiree benefits relative to average after-tax compensation over time.15 The average Social Security benefit per retiree is currently about 30 percent of workers' average compensation; adding Medicare benefits increases the transfers.
- Average combined benefits are expected to be about 53 percent of average after-tax compensation this year.
- They will grow to 58 percent of workers' average after-tax compensation when the last of the baby boomers reach retirement age in 2032.
- They will rise to 65 percent in 2050 and to more than 69 percent of average after-tax compensation by 2080.
Thus, using this more restrictive measure of potential consumption, Social Security and Medicare transfers to the elderly will grow from just under half of workers' average total compensation to more than two-thirds under current law. Policymakers might want to consider the fairness of taking more and more of workers' paychecks to fund benefits to retirees equal to almost 70 percent of what the workers earn.
[page]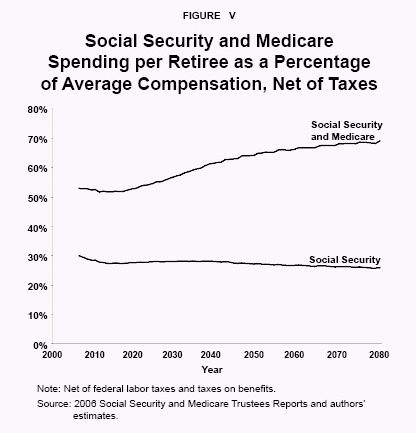
"Combined benefits are growing in comparison to average total compensation, net of payroll taxes."
Without changes, Social Security and Medicare will grow relative to the earnings and compensation of the workers who fund the programs. Further, the rate at which these entitlement benefits replace preretirement earnings of successive cohorts of retirees will rise. By the time today's teenagers retire, net Medicare and Social Security benefits will rival their average preretirement price-indexed wages.
"Projected benefit levels are not sustainable."
Implied replacement rates of 100 percent of retirees' own preretirement earnings and ever-growing transfers to retirees relative to taxpayers' own earnings may seem implausible, but they are derived from the projections in the Trustees Report. These projections assume no legislative changes in response to growing burdens; rather, they illustrate the implications of continuing currently legislated programs. These estimates also assume that scheduled and projected benefits will actually be paid to beneficiaries and that they will be financed with the current statutory payroll taxes, taxes on benefits and general federal revenues. Further, the projections assume that the growth in the size of government will not affect the rate of economic growth. The magnitude of the transfers implied, compared to the beneficiaries' own lifetime earnings, and compared to the earnings and compensation of the workers who are paying the benefits, suggests that the programs are not sustainable as designed.
NOTE: Nothing written here should be construed as necessarily reflecting the views of the National Center for Policy Analysis or as an attempt to aid or hinder the passage of any bill before Congress.
[page]- The estimates assume scheduled and projected benefits will actually be paid to beneficiaries and will be financed with the current statutory payroll taxes, taxes on benefits and general federal revenues. The projections assume that growth in the size of government will not affect gross domestic product (GDP) growth. Also, the term consumption as used here refers to spending and spending opportunities including health care.
- See Table VI.F10 in the 2006 Social Security Trustees Report; available at http://www.ssa.gov/OACT/TR/TR06/.
- Changes to the benefit formula in the 1983 reforms produce Social Security benefits that replace relatively stable shares of wage-indexed preretirement earnings for future retirees. The reforms also gradually raised the retirement age and increased taxes paid by workers and retirees.
- The particular CPI used to adjust postretirement Social Security benefits is the CPI-W. The CPI-W is used in the examples reported here.
- The two age-earnings profiles depicted in the figure represent workers with adjusted average earnings born in 1941. The Social Security Administration's Actuarial Note Number 2005.3 describes how the Social Security Average Wage is adjusted to produce Table VI. F10 in the 2006 Social Security Trustees Report. See Michael Clingman and Orlo Nichols, "Scaled Factors for Hypothetical Earnings Examples under the 2005 Trustees Report Assumptions," Social Security Administration, Actuarial Note Number 2005.3, September 2005.
- This wage index is the one used in the Social Security Trustees Report to calculate replacement rates. In the Trustees Report, hypothetical earnings for each income group are wage-indexed to the year prior to retirement. Using this method, calculations show that Social Security benefits replace 45.4 percent of the average worker's preretirement earnings. Note that this method is not the one used by the Social Security Administration to determine actual benefits under current law. The Social Security benefit formula averages the 35 highest-earning years, wage-indexed to age 60, and includes nominal earnings after age 60. Using the benefit formula method of calculating average earnings produces a replacement rate of 48.3 percent. Using the same method, Olivia Mitchell and John W.R. Phillips, "Social Security Replacement Rates for Alternative Earnings Benchmarks," Pension Research Council, Working Paper 2006-6, report a replacement rate of 48 percent for workers born in 1936. The replacement rate used in the benefit formula is 6.4 percent higher than the replacement rate comparable to the one reported in the Trustees Report. The comparison is highlighted here because the term "replacement rate" commonly refers to the replacement of the earnings used in a pension's benefit formula.
- The estimate of a 45.4 percent replacement rate for average workers born in 1941 is based on the methodology described for the estimates reported in Table VI. F10 in the 2006 Social Security Trustees Report. However, the Trustees Report estimate for the same group of workers is 42.9 percent. The use of 2005 scaling factors here is the likely cause of the difference in estimates. By the time individuals born in 1960 retire the replacement rates for each earnings category will stabilize given that the 1983 adjustments to the benefit formula will be fully phased in and the relationship between price and wage growth are projected to be stable in the years thereafter. The low, medium, high and taxable maximum replacement rates are projected to be 55.4 percent, 41.0 percent, 34.0 percent and 27.3 percent, respectively, in the long run.
- The value of fringe benefits is determined using historical compensation-to-wage ratios. In addition, past payroll taxes and nonpayroll tax federal revenues are based on their historical levels and are used to estimate compensation net of federal taxes. Historical compensation-to-earnings ratios are from Eugene B. Yang and Stephen C. Goss, "Economic Projections for OASDHI Cost and Income Estimates: 1992," Social Security Administration, Actuarial Study No. 108, December 1992. Historical federal nonpayroll taxes collected from labor are used to calculate an average tax on wages earnings. Given progressive tax rates this average overstates taxes collected from low and average earners.
- Medicare benefits are identified as the annual lifetime premium that is sufficient to fund each group of new beneficiaries' lifetime Medicare spending net of Part B and Part D premiums.
- The comparison is limited to average workers with scaled medium lifetime earnings born in 1941. Scaled earnings reflect the earnings profile for average workers. That is, earnings are less than the average earnings of all workers in the economy when workers are young, rise above average earnings when workers are in their mid-30s to mid-50s and then decline below the average at later ages. For more information, see the Social Security Administration's Actuarial Note Number 2005.3; available at http://www.socialsecurity.gov/OACT/NOTES/ran3/an2005-3.html.
- Social Security limits the amount of earnings subject to taxation in a given year. This limit increases each year with increases in the national average wage index. For earnings in 2006, the limit is $94,200. For the purpose of calculating the average wage reported in the 2006 Social Security Trustees Report, Table VI. F6, earnings above the taxable maximum were included.
- Income taxes on Social Security benefits have been netted out of total Old Age and Survivors Insurance (OASI) benefits before calculating the average benefit. These taxes include those credited to both the OASI Trust Fund and Medicare's Hospital Insurance Trust Fund. The share of aged to non-aged OASI beneficiaries is estimated from Table V.C4 from the 2006 Social Security Trustees Report, and the relative size of the average benefit for the aged and non-aged comes from the 2004 Annual Statistical Supplement. Given that income taxes on Social Security benefits affect higher-income retirees, the average benefit received is understated. Also, the calculation of average Social Security benefit per retiree in this section includes benefits awarded to spouses and the effects of benefit reductions due to early retirement.
- In calculating net Medicare benefits, Hospital Insurance (Part A) premiums paid by voluntary enrollees, as well as premium payments for Supplementary Medical Insurance (Parts B and D) are deducted from total Medicare expenditures. State transfers for Part D are also omitted. Thus, the average Medicare benefit only includes the net federal transfer. This average is adjusted by the historical relationship between the benefits received by the aged and the disabled to produce the average benefit for aged beneficiaries.
- The ratio of compensation to GDP is assumed to be constant in the Trustees Reports (see page 86 of the 2006 Trustees Report). The ratio of compensation to GDP calculated here is 0.60 for most years using the 2006 Trustees Report.
- Average compensation is reduced by federal payroll and income taxes in the following way. First, the payroll taxes are estimated using the statutory payroll tax rates. Second, the net general revenue funding requirements for Medicare (all parts) and Social Security are assumed to be financed by all nonpayroll tax federal revenues. An estimated 58 percent of the revenues are from labor taxes. Third, the nonpayroll tax revenues are assumed to be equal to the 50-year average historical share of GDP less the current level of GDP devoted to Supplementary Medical Insurance (SMI) funding. This treatment of income taxes overstates the income tax burden on an average worker given the relatively higher tax burden on higher-income workers.
Dr. Andrew J. Rettenmaier is the Executive Associate Director at the Private Enterprise Research Center at Texas A&M University. His primary research areas are labor economics and public policy economics with an emphasis on Medicare and Social Security. Dr. Rettenmaier and the Center's Director, Thomas R. Saving, have presented their Medicare reform proposal to U.S. Senate Subcommittees and to the National Bipartisan Commission on the Future of Medicare. Their proposal has also been featured in the Wall Street Journal, New England Journal of Medicine, Houston Chronicle and Dallas Morning News. Dr. Rettenmaier is the co-principal investigator on several research grants and also serves as the editor of the Center's two newsletters, PERCspectives on Policy and PERCspectives. He is coauthor of a book on Medicare, The Economics of Medicare Reform (Kalamazoo, Mich.: W.E. Upjohn Institute for Employment Research, 2000) and an editor of Medicare Reform: Issues and Answers (University of Chicago Press, 1999). Dr. Rettenmaier is a senior fellow with the National Center for Policy Analysis.
Dr. Thomas R. Saving is the Director of the Private Enterprise Research Center at Texas A&M University. A University Distinguished Professor of Economics at Texas A&M, he also holds the Jeff Montgomery Professorship in Economics. Dr. Saving is a trustee of the Social Security and Medicare Trust Funds. His research has covered the areas of antitrust and monetary economics, health economics, the theory of the banking firm and the general theory of the firm and markets. He has served as a referee, or as a member of the editorial board, of several major U.S. economics journals and is currently an editor of Economic Inquiry. Dr. Saving has authored many articles and two influential books on monetary theory. He has been president of both the Western Economics Association and the Southern Economics Association. After receiving his Ph.D. in economics in 1960 from the University of Chicago, Dr. Saving served on the faculties of the University of Washington and Michigan State University, moving to Texas A&M in 1968. Dr. Saving served as chairman of the Department of Economics at Texas A&M from 1985-1991. Dr. Saving is a senior fellow with the National Center for Policy Analysis.