Some activities of government clearly contribute to economic growth. The United States, for instance, would not be nearly as productive without physical infrastructure (roads and bridges), protection of property and an educated work force. These activities are largely funded by taxation. At least initially, each tax dollar taken from the private economy to fund these activities yields more than a dollar increase in total output.
Beyond some minimum level, however, government becomes a net drain on the economy. Empirical evidence shows that as the tax burden rises beyond a certain level, the rate of economic growth slows. As government grows, money flows to less productive projects (think "bridges to nowhere"), and taxes are increasingly used to redistribute income through transfer payments (such as Social Security and Medicare) and to fund myriad special interest group projects. Whereas private decision-makers tend to make decisions based on economic costs and economic benefits, elected officials tend to make decisions based on political costs and political benefits (as reflected, for example, in votes, campaign contributions and so forth). High tax rates reduce the incentives of taxpayers to produce, while beneficiaries of government largesse are discouraged from additional effort.
There is a point, however, at which economic resources are allocated most productively between public and private uses. At this level of government taxing and spending, the economy will grow at the fastest sustainable rate, benefiting the poor and middle class as well as the rich. What is this optimal level of government? A reliable econometric model developed for this study finds:
- To maximize economic growth, federal, state and local taxes combined should average about 23 percent of gross domestic product (GDP).
- Tax revenues as a share of GDP have not been at that level since 1950, and for years have averaged between 30 percent and 34 percent of GDP.
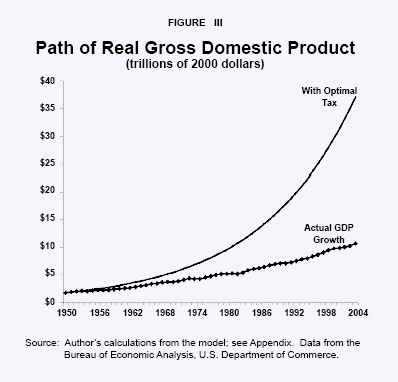
Real GDP increased at a compound growth rate of 3.5 percent per year from 1950 to 2004. If instead of rising to 30 percent and more, an average tax burden of about 23 percent of GDP had been in effect throughout the 54-year period, the growth rate would have been 5.8 percent per year. As a result:
- Real GDP would have been $37 trillion by 2004, more than three times greater than it was with the higher tax burden.
- The average American family would have more than three times as much real income today as it actually has.
Would Americans have had to sacrifice important government programs in order to keep the overall tax rate down? Not at all. At the lower rate of taxation, higher growth would have produced more government revenue than the amount government actually collected at higher tax rates. Specifically:
- At a 23 percent rate of taxation, government at all levels would have collected $61.9 trillion more in taxes.
- This is enough money to have funded all actual spending programs enacted during that period with no public debt.
Going forward, the model implies that if the U.S. tax burden were reduced to the growth-maximizing rate and the rate of economic growth were raised, by 2030 real GDP would be almost twice as great as it would be at the lower average rate of growth over the last half century.
[page]"High tax rates discourage work and investment, increase efforts to avoid taxes and reduce government revenues."
In the 18th century, economist Adam Smith observed that raising tariff rates beyond a certain level was self-defeating because imports, and hence tariff revenue, fell. One reason was that high tariffs encouraged smuggling. In the 20th century, President John F. Kennedy recognized the same inverse relationship between tax rates and government revenue when he proposed broad tax cuts – cuts that were passed in 1964, after his assassination. "It is increasingly clear that no matter what party is in power, so long as our national security needs keep rising, an economy hampered by restrictive tax rates will never produce enough revenues to balance our budget – just as it will never produce enough jobs or enough profits," Kennedy said in a speech in 1962. "It is a paradoxical truth that tax rates are too high today and tax revenues are too low and the soundest way to raise the revenues in the long run is to cut the rates now. The experience of a number of European countries and Japan have borne this out."2
Ironically, the insight of John F. Kennedy was a basis for what has become known as the supply-side revolution, later popularized by Arthur Laffer. It furnished the impetus for President Ronald Reagan's cuts in marginal tax rates. As a practical matter, the income tax is somewhat progressive. A progressive tax structure discourages additional productive effort, and as a result, tax revenue is lower than it would be with a flatter income tax structure. Lower marginal and average tax rates encourage work and investment, and reduce efforts to avoid taxes.3
The supply-side emphasis on the tax revenue consequences of high levels of taxation ignored the more important question of their effect on economic growth. The Reagan tax cuts led to a tremendous expansion of the economy during the 1980s, and arguably into the 1990s.4 Economic growth raised revenues as the income of Americans grew. In recent years, a number of economists have explored the relationship between the overall tax burden – measured as a percentage of the output of goods and services or personal income – and the rate of economic growth.5
Empirical evidence shows that as the tax burden rises beyond a certain level, the rate of economic growth slows. [See Figure I.] Why economies grow and what government policies (if any) allow some societies to grow rapidly or cause countries to stagnate or decline has been debated for many years. Determining the tax structure that leads to the greatest creation of private wealth, and with it the largest amount of tax revenue, is a key to solving some major economic problems of our time.
[page]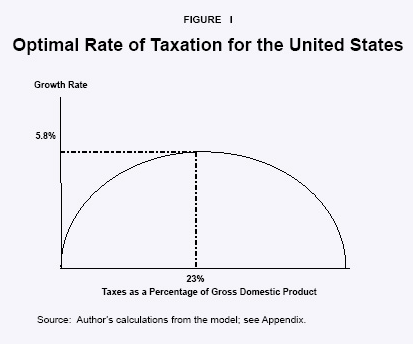
"Taxes beyond a certain level slow economic growth."
Resources in a society may be allocated privately through the market system or politically through government. When resources are allocated privately, they tend to be allocated to the highest-valued use as entrepreneurs and capitalists seek the highest economic rate of return on their assets. When politicians (or central planners) allocate resources, they tend to be influenced by political costs and political benefits, as reflected, for example, in votes and campaign contributions.
Taxes are collected for two basic purposes. First, they are used to provide "public goods," such as national defense and a legal system.6 Second, they are used to redistribute income. When government takes a dollar from taxpayers and spends it on a government program, there are three possible outcomes: the economy's total output of goods and services can go up, it can go down, or it can remain unchanged. Most people acknowledge that at least a minimum of government is necessary to the functioning of a free society and a growing economy. By providing a common defense against foreign enemies, a criminal justice system that promotes law and order, and perhaps other "public" goods such as infrastructure (roads and bridges), protection of property and an educated work force, government expenditures contribute positively to private economic activity and make it more productive. These are activities largely funded by taxation. Thus, up to this level, reducing private goods by a dollar yields more than a dollar increase in total output.
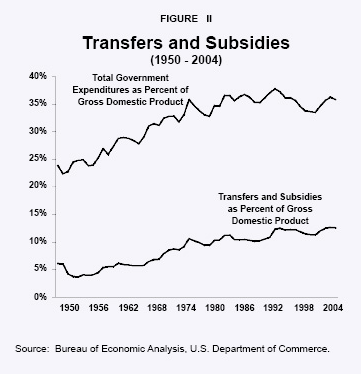
Beyond some level of taxes and spending, however, government becomes a net drain on the private sector. Beyond this level, taxes tend to be increasingly used for transfer payments such as Social Security, Medicare and Medicaid and to fund a myriad of special interest group projects. The reduction in incentives produced by such taxes lowers the rate of economic progress. This is what has happened in the United States. Between 1950 and 2004, transfer payments and subsidies (such as government business loan programs) doubled from 6 percent of GDP to more than 12 percent. [See Figure II.] They now comprise more than one-third of government expenditures.7
"Social Security, Medicare and other income transfer programs have increased the size of government."
Penalizing success with high marginal tax rates and subsidizing failure with generous public transfers damages economic efficiency. People work fewer hours and do not work as hard, there is more job shirking and absenteeism, and workers take longer vacations. Moreover, to avoid the burden of taxes, people will engage in avoidance and evasion – diverting resources from the most productive uses to uses that lower their tax burden. Tax avoidance and tax compliance (including record keeping and form filing) are "deadweight costs" imposed on the economy by the tax system. Income redistribution schemes reduce incentives to innovate, save and invest, and they generally lower the rate of economic growth. Hence, reducing private goods by a dollar yields less than a dollar increase in total output.
[page]A low tax burden was a major contributor to America 's early economic growth:
- In the 18th century, federal, state and local taxes combined were less than 5 percent of GDP, and 95 percent of federal revenue came from tariffs.
- In the 19th century, tax revenue as a share of GDP gradually rose, but it never exceeded 10 percent.
"The income tax has allowed government to grow."
The personal income tax, introduced by the federal government in 1913, made it possible to transform the United States from a low-tax to a high-tax economy, and two world wars supplied the impetus.8 Most state governments, and some city governments, have since enacted their own income taxes – essentially piggybacking on the federal tax system.9
- With America 's participation in World War I, total (federal, state and local) tax revenue exceeded 10 percent of GDP for the first time.
- The 20 percent barrier was broken with America 's entrance into World War II.
- By 1969, at the beginning of the Nixon administration, tax revenue had reached 30 percent of GDP.
- Since then, total federal, state and local taxation has ranged from about 30 percent to 34 percent of GDP.
Today, federal, state and local taxation is about 31 percent of GDP. Government spending, however, is about 35 percent of GDP – with the difference paid for in the short run by government borrowing and in the long run by higher taxes.
How has the increasing tax burden affected economic growth? Economic growth occurs as a result of increases in productivity. Empirical studies have found that as the burden of government rises, productivity growth slows.10 There is evidence pointing to the growth in the size of government since World War II and the accompanying increase in taxes as a cause of slower growth in the post-war period.
This line of reasoning suggests that there is an optimal size of government. It further suggests that this optimal size is defined by the level of taxation that maximizes economic growth.
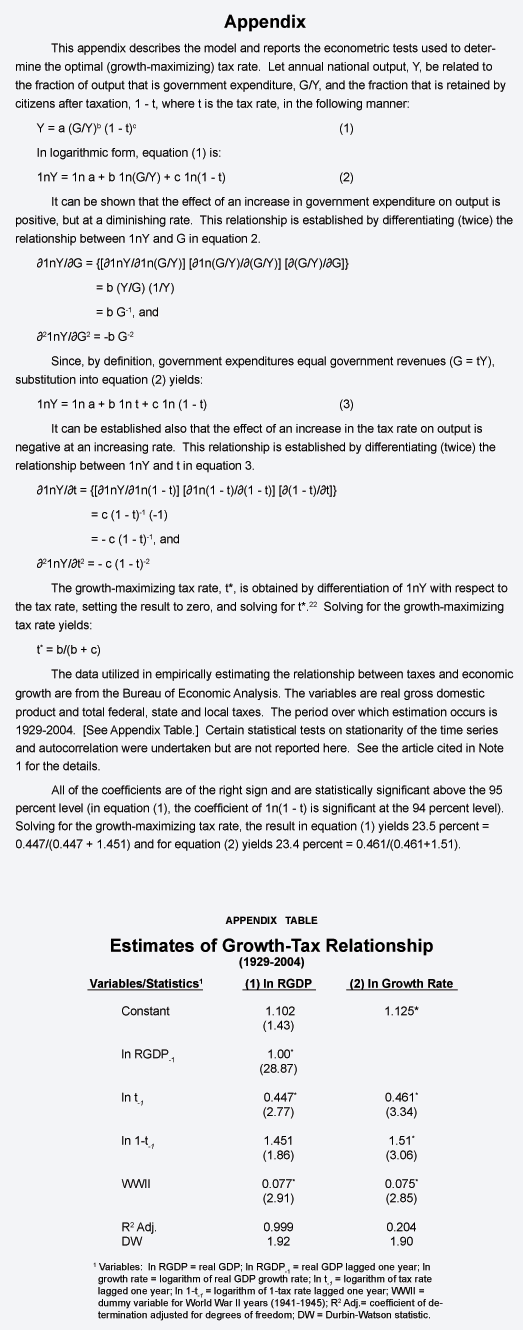
[page]This study uses a simple but reliable econometric model.11 The parameters of the model (which are described in the Appendix) were estimated using data from standard statistical sources. The equations of the model were then solved to calculate the growth-maximizing rate of taxation – the rate at which increased taxes and spending cease to raise the rate of economic growth and begin to reduce it.
The optimal (growth-maximizing) average rate for federal, state and local taxes combined is between 23 percent and 23.5 percent of GDP. Taxes as a share of GDP were at the optimal rate in 1950 and have not been there since.
The optimal tax rate derived from this model are consistent with previous studies that conclude that the optimal size of government is 19 percent of GDP and that government spending of 20 percent of GDP maximizes productivity.12 The numbers will vary, depending on the model used and the period of years analyzed, but all of these estimates imply that the economic growth rate, and hence the level of GDP, is far below what would have been achieved had the nation's total tax rate been kept at its 1950 level.
[page]In 1929, federal, state and local taxes combined consumed about 10 percent of GDP. In 1950, they were 23.4 percent of GDP – roughly the optimal tax rate calculated from the econometric model. By 1969, the tax share broke the 30 percent barrier and has been rising slowly since then. Real GDP was $1.8 trillion in 1950 (in 2000 dollars). By 2004, real GDP was nearly $11 trillion, reflecting a compound growth rate of 3.5 percent per year. Figure III shows the path of real GDP. It also shows that, at the optimal rate of 23.4 percent of GDP, the corresponding real compound economic growth rate would have been 5.8 percent instead of the actual 3.5 percent. As Figure III shows:
- Had the optimal tax rate been in effect throughout the 54-year period, real GDP (in 2000 dollars) would have been $37 trillion rather than $10.7 trillion in 2004.
- As a result, the average American family would have had more than three times as much real income as it has today.
"Americans lost $350 trillion of output from 50 years of toohigh taxes."
Cumulative Loss of Income. From the time the rate of taxation exceeded the optimal point, more and more American resources have been devoted to less and less productive uses. The annual loss of income accumulates over time. Because taxes have been too high since 1950, the resulting lower economic growth and failure to maximize wealth have robbed the nation of $350 trillion worth of output . Specifically:
- The accumulated real GDP from 1950 to 2004 was $287 trillion.
- At the 1950 tax rate, however, accumulated real GDP over the same period would have been $647 trillion – $359 trillion more actual output.
- On the average, this represents roughly $1.2 million in lost income over the lifetime of every individual.
In general, the U.S. economy has sacrificed $4 worth of income for every $1 of tax paid beyond the level of optimal taxation. The implications of this finding are staggering.
"The economy would be three times larger had the United States maintained the 1950 level of taxes."
Government Tax Revenues Lost. Exceeding optimal rates has been costly to government at all levels, too. In the short run, the revenue-maximizing tax rate is higher than the growth-maximizing rate, as the model shows. However, over the long run, revenues at the lower tax rate beat revenues at the higher tax rate due to the faster expansion of the income or production to which the tax is applied. Over the period from 1950 to 2004, federal, state and local governments collected a total of $89.5 trillion in taxes, adjusted for inflation. But if total taxes had been limited to 23.4 percent of GDP, government would have been collecting taxes on a far larger tax base, thanks to a higher growth rate. As a result, the combined governments would have collected $151 trillion . This implies:
- Had the nation's total tax burden been limited to 23.4 percent of GDP, government would have collected $61.9 trillion more in taxes.
- This additional revenue would equal the total of all deficits in real terms since 1949.
- Not only would government have had enough revenue to fund all spending programs enacted, but had the total rate been held at the optimal level, there would have been no public debt!
One might ask why citizens have allowed this destruction of private wealth through excessive taxation and why politicians have given up $61.9 trillion in revenues since 1950. There are several explanations.
"Most people don't know their total tax bill."
First, and perhaps foremost, people generally are cognizant only of their actual earnings, not their potential earnings. They do not miss the lost 2.6 percentage points of average annual growth in real output because they never had it. Also, many are ignorant of the intimate link between taxation, incentives and economic efficiency. Moreover, politicians have been ingenious in hiding taxes. Because most taxes on earned income are deducted from wages before the workers receive them, many are unaware of their actual tax burden. People also pay a host of other taxes (property taxes, sales taxes, excise taxes and so forth), but most do not know how much of their total income they pay in taxes because so many taxes are hidden or are a small portion of an individual transaction.
Second, the theory of government growth is still being developed. As mentioned above, government has grown at times by distinct jumps (World War I and World War II each yielded a permanent 50 percent or so increase in the tax burden) and at times incrementally (for example, the Roosevelt years, 1932-40, and during Johnson's Great Society of the 1960s). Patriotism silenced objection to higher tax rates and expansion of the tax base during the wars. The Great Depression conditioned people to the idea of a larger role for government. New and expanded government redistribution programs tend toward what might be called creeping incrementalism. For example, the food stamp program began in the early 1960s as a modest $175 million effort and now costs $36 billion.13 Another discrete jump in the size of government is on the horizon if it assimilates the $1.7 trillion health care industry. Proposals for national health insurance, if passed, would push taxes as a percent of GDP above the 40 percent level.
Third, politicians face a different set of priorities than do other citizens and often fail to appreciate how the world works. Most politicians are lawyers. The function of lawyers is to redistribute income between plaintiffs and defendants. Thus, politicians tend to view taxpayers and voters as the functional equivalent of plaintiffs and defendants. They often misunderstand how productive activities occur and how their decisions affect such activities. For example, for 200 years politicians have been told the benefits of free trade, yet with a couple of exceptions (such as Britain in the 19th century and the United States after World War II), protectionism has been preferred by politicians and generally favored by the public. For 200 years, politicians have been warned that excessive taxation promotes inefficiency and discourages compliance (from Adam Smith's observations about tariffs and smuggling to the supply-siders' observations about marginal tax rates). The deleterious effect of massive regulation on productivity is well known, yet the burden grows.14 Henry Manne, dean emeritus of the law school at George Mason University, has suggested that the amount of law, mainly statutes, is 100 to 1,000 times greater today than in 1933.15
[page]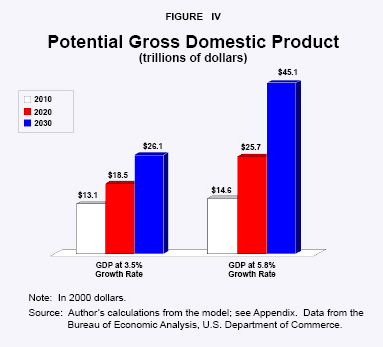
"A lower tax burden would raise the rate of economic growth."
For the past 50 years taxes have consumed an average of 30 percent of the GDP in the United States. These rates have resulted in lower GDP growth and lower tax revenues for the government, compared to the lower, optimal tax rate. For both fiscal conservatives and liberals, this is bad news: conservatives have always viewed higher tax rates as stifling job creation, innovation and entrepreneurship; for fiscal liberals who support the redistribution of wealth, higher rates of taxation leave fewer revenues available for the government to redistribute. So an optimal tax rate would benefit all of society, not just a select few.
Figure IV shows projected GDP in 5, 15 and 25 years with the growth rate at the optimal rate of taxation, compared to the current average GDP growth rate, beginning in 2005.
- By 2010, projected GDP at a growth rate of 5.8 percent would amount to $14.6 trillion, compared to about $13.1 trillion at a 3.5 percent growth rate.
- By 2020, projected GDP at the higher growth rate would be $25.7 trillion, compared to only $18.5 trillion at the lower growth rate.
- By 2030, GDP would be $45 trillion, almost twice as much as the $26 trillion resulting from the 3.5 percent growth rate.
"Future economic output would be higher with the optimal rate of taxation."
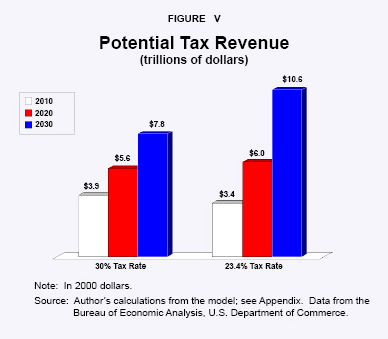
Furthermore, at a growth rate of 5.8 percent and an average tax rate of 23.4 percent of GDP, tax revenues would more than equal revenues at the lower growth rate of 3.5 percent and higher tax rate of 30 percent. As Figure V shows:
- In 2020, tax revenues at the lower average tax rate would be about $6 trillion, compared to $5.5 trillion at the higher average tax rate.
- By 2030, this difference would increase to $10.5 trillion for the lower average tax rate, compared to $7.8 trillion at the higher rate.
- Total tax revenues from 2005 to 2030 would be $148.2 trillion at the lower average tax rate, compared to only $136.9 trillion at the higher average tax rate, a difference of more than $11 trillion!
"Future tax revenues would be higher with a lower rate of taxation."
For comparison, this difference in projected federal revenues is greater than the unfunded liability of Social Security over this period.
[page]"An optimal tax rate would benefit all of society, not just a select few."
Most Americans, scholars included, subscribe to the Anglo-American public finance tradition of thinking of government as benign. From this point of view, policy choices often seem irrational and enigmatic. Public choice theorists see the behavior of the politicians and the constituencies that elect them as rational, self-interested and self-serving, having more to do with re-election and rent-seeking than with economic efficiency. In this view, excessive taxation may arise simply because the tax rate consistent with political equilibrium among competing special interest groups exceeds the rate that maximizes economic growth.
NOTE: Nothing written here should be construed as necessarily reflecting the views of the National Center for Policy Analysis or as an attempt to aid or hinder the passage of any bill before Congress.
[page]- This study is based on Gerald W. Scully, "The 'Growth Tax' in the United States," Public Choice, Vol. 85, Nos. 1-2, 1995, pages 71-80, and a version of that study, Gerald W. Scully, "What Is the Optimal Size of Government in the United States?" National Center for Policy Analysis, Policy Report No. 188, November 1994. The numbers and discussion have been updated and projections added with the assistance of Pamela Villarreal, an NCPA graduate student fellow.
- Address to the Economic Club of New York, December 14, 1962, available at http://www.americanrhetoric.com/speeches/jfkeconomicclubaddress.html
- It should be noted that revenue fell when marginal tax rates were cut by one-fourth in 1981. However, tax compliance increased and 70 percent of the projected revenue losses were recovered by 1985. See Lawrence Lindsey, The Growth Experiment: How the New Tax Policy Is Transforming the U.S. Economy (New York: Basic Books, 1990). Lindsey began his research convinced that supply-side responses were negligible. After examining the evidence, he became one of the strongest proponents of supply-side policies.
- Some of the gains achieved by the Reagan tax cuts were reversed during the first Bush and Clinton administrations. Income tax rate cuts during the current Bush administration have restored some of the previous gains. Today, the top income tax rate is 35 percent and, when the phase-out of the standard deduction and the personal exemption are figured in, the marginal tax rate on income is even higher for some taxpayers.
- See, for example, Gerald W. Scully, "The Size of the State, Economic Growth and the Efficient Utilization of National Resources," Public Choice, Vol. 63, 1989, pages 149-64; Philip J. Grossman, "Government and Growth: Cross-Sectional Evidence," Public Choice, Vol. 65, 1990, pages 217-27; Edgar Peden, "Productivity in the United States and Its Relationship to Government Activity: An Analysis of 57 years, 1929-1986," Public Choice, Vol. 69, 1991, pages 153-73; James Gwartney, Robert Lawson and Randall Holcombe, "The Size and Functions of Government and Economic Growth," Joint Economic Committee, U.S. Congress, April 1998; Gary S. Becker and Casey B. Mulligan, "Deadweight Costs and the Size of Government," Journal of Law and Economics, Vol. 46, No. 2, October 2003, page 310; and Martin Feldstein, "Tax Avoidance and the Deadweight Loss of the Income Tax," Review of Economics and Statistics, Vol. 81, No. 4, November 1999, pages 674-80.
- Infrastructure and other goods may be privately provided or publicly provided. The fact that we provide it publicly does not imply that we would be without infrastructure had government not supplied it. Strictly speaking, "public goods" have the characteristics of being nonrivalrous and nonexclusive. Nonrivalous means that when one person consumes the good, it does not interfere with others' consumption of the good. An example of this is a scenic view. Nonexclusive means that it is quite difficult to provide the good for some people while excluding others. An example is national defense. If some individuals in the United States are protected, then all are protected due to the impossibility of excluding certain households from protection against foreign invaders. Because of these characteristics of public goods, they tend to be underprovided by the private sector.
- Statistical Abstract of the United States.
- In 1913, the 16th Amendment to the Constitution was ratified, granting Congress the power to levy taxes on individual and corporate income. Initially, Congress passed a law authorizing a 1 percent to 7 percent tax on top personal income earners ($3,000 a year for single earners, $4,000 a year for married earners), and a 1 percent tax on all corporate income. In 1916, personal income taxes were expanded to cover all income earners, with rates ranging from 2 percent to 15 percent. See "History of the U.S. Tax System," United States Department of the Treasury; and Tax Foundation, "U.S. Federal Income Tax Rates History, 1913-2004," April 19, 2005.
- With few exceptions, state and local governments use the federal definition of income and rely on the federal government as protagonist in litigating whether particular income is taxable.
- For example, see E. A. Peden and M. D. Bradley, "Government Size, Productivity and Economic Growth: The Post-War Experience," Public Choice, Vol. 61, 1989, pages 229-45.
- For some criticisms of the model and a rebuttal by the author see, respectively, Peter E. Kennedy, "On Measuring the Growth-Maximizing Tax Rate," Pacific Economic Review, Vol. 5, No. 1, pages 89-91, February 2000, and Gerald W. Scully, "The Growth-Maximizing Tax Rate," Pacific Economic Review, Vol. 5, No. 1, pages 93-96, February 2000.
- See Philip J. Grossman, "The Optimal Size of Government," Public Choice , Vol. 56, 1987, pages 193-200, and Edgar A. Peden, "Productivity in the United States and Its Relationship to Government Activity: An Analysis of 57 Years, 1929-1986," Public Choice, Vol. 69, 1991, pages 153-73.
- "Annual Summary of Food and Nutrition Service Programs," U.S. Department of Agriculture Food and Nutrition Service, August 24, 2006. This figure includes only food stamps and WIC, and does not include school lunch and breakfast programs, or special programs for elderly, day care and American Indian reservations.
- The cost of complying with federal regulation was estimated at $580 billion in 1993. See Thomas D. Hopkins, "The Cost of Federal Regulation," Journal of Regulation and Social Costs, Vol. 2, No. 1, March 1992, pages 5-31.
- Personal conversation with the author.
[page]
Gerald W. Scully is a senior fellow with the National Center for Policy Analysis and professor emeritus of economics in the School of Management at the University of Texas at Dallas. His articles have appeared in the American Economic Review, the Journal of Political Economy, the Journal of Law and Economics, Public Choice and other scholarly journals. Dr. Scully is also an expert on the economics of sports. His most recent book is The Market Structure of Sports.