Although Social Security reform has received considerable attention in recent years, Medicare is the far-bigger problem. Medicare is growing at a faster rate and has an unfunded liability six times the size of Social Security.
Medicare is also on a spending path that will be difficult to sustain without unprecedented boosts in revenues. The reason: Per capita health care spending over the past half century has been rising at a rate two to three times faster than per capita gross domestic product (GDP). If this trend continues, health care's share of the economy will grow considerably:
- If the growth of real per capita health care spending exceeds the rate of growth of real per capita GDP by 2 percentage points, health care spending will consume almost 80 percent of GDP by 2075.
- Continuation of these past growth rates indefinitely would imply a five-fold increase in health care's share of the economy from present levels, crowding out the consumption of most other goods.
Clearly this path is not feasible. Therefore, in projecting the future, the Medicare Trustees assume that the rate of health care spending growth will moderate, eventually slowing to the rate of income growth after 75 years. This study uses the same assumptions as the Trustees report. Even with these assumptions, it is evident that the federal government has far more in projected benefit costs than it expects to receive in payroll taxes, premiums and other revenues dedicated to Medicare:
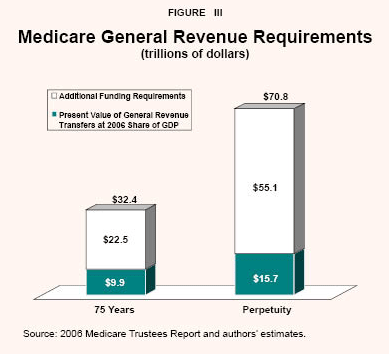
- The last Trustees report estimated Medicare's unfunded liability over the next 75 years at $32.4 trillion.
- Looking indefinitely into the future, the unfunded liability is $70.8 trillion.
- This is 14 times the amount of outstanding federal debt.
Medicare already spends more than it receives in dedicated taxes and premium payments. As baby boomer retirees begin to flood the system, the impact will be felt by every other federal program:
- Currently, Medicare claims about 11 percent of federal nonentitlement tax dollars.
- By 2020, Medicare deficits will claim one in every five federal tax dollars that are not already dedicated to Medicare and Social Security.
- This means that in just 13 years the federal government will have to stop doing one in every five things it does today if taxes are to remain at their current level and projected Medicare benefits are paid on behalf of the disabled and the elderly.
- By 2030, the deficits in Medicare will claim one in every three general revenue dollars; by 2050, they will claim one in every two.
What can be done? The suggested reforms include raising taxes, making seniors pay for more of their benefits, cutting benefits for higher-income beneficiaries and raising the eligibility age. Yet these reforms would not directly reduce health care spending growth; rather, they would change the allocation of the program's costs between taxpayers and seniors.
How, then, can the country get off the spending path it is on? On the demand side, someone must choose between health care and other uses of money. That is, someone must decide that the next MRI scan or the next knee replacement, for example, is not worth the cost. Such decisions could be made by seniors themselves, by the government (as it is in other countries) or by private insurers operating under government rationing rules. On the supply side, the way health care is produced must change fundamentally, replacing cost-increasing innovations with cost-reducing ones.
A common technique in other developed countries is to impose a global budget on health care providers. To estimate the effects of this type of rationing, projections were made that assume, starting with the baby boomer generation, Medicare spending on each year's cohort of newly eligible beneficiaries will be limited. After a beneficiary begins receiving Social Security benefit payments, they are indexed for inflation only. A similar method of indexing Medicare benefits is considered. Upon reaching age 65, beneficiaries would receive a health plan that covers projected lifetime Medicare costs as they exist in the year they retire. This benefit package would be indexed for inflation only. Although this reform is unquestionably harsh, it would reduce Medicare's unfunded liability by as much as 40 percent.
Why don't spending constraints accomplish more? The reason: 48 percent of the projected growth in Medicare is due to population growth and aging, while 52 percent is due to per capita spending growth in excess of per capita GDP growth. Reforms which limit reimbursements, therefore – even in a best-case scenario – can only affect part of the expected growth in Medicare spending.
The effects of beneficiaries making their own rationing decisions are also estimated, by creating a $5,000 deductible policy, with retiree Health Savings Accounts (HSAs) to fund spending below the deductible. The size of the deductible grows through time (as health costs grow) and since deposits to the HSAs would be made with after-tax dollars, withdrawals for any purpose would be tax-free. In this way, beneficiaries would be encouraged to make their own tradeoffs between health care and every other good or service. The effects could be substantial. Like the impact of global budgets, this reform could reduce Medicare's unfunded liability by as much as 40 percent if started immediately. Alternatively, if the reform is phased in, the government could initially make deposits to beneficiaries' HSAs.
Health care supply-side reforms are not simulated in this paper. However, there is ample evidence that when people spend their own money on health services, supply-side responses are considerable. This implies that a properly designed Health Savings Account could help move Medicare off its current spending course in two ways: 1) by allowing the elderly to reallocate health care dollars to goods and services they value more and 2) by spurring providers to provide care more efficiently.
[page]“Medicare's unfunded liability over the next 75 years is $32 trillion.”
Medicare is America's second-largest entitlement program, second only to Social Security. Oddly, while Social Security has received the bulk of the attention in recent years, Medicare is growing at a faster rate and has a long-term debt six times larger than Social Security's. Medicare's problems are well documented: The program, which currently represents 16 percent of federal spending, will double in size within the next three decades and nearly triple by midcentury. However, projected payroll taxes, premium payments and other revenues dedicated to Medicare are not nearly enough to meet these costs, leaving a deficit of more than $32 trillion over the next 75 years.
How will future taxpayers and seniors afford Medicare's soaring costs? That is the focus of this report. 1
[page]Medicare and Medicaid have had a dramatic effect on the public sector's role in the health care market. 2 Since the two programs were signed into law in 1965, the govenment's share of the health care market has increased substantially, while the share individuals spend out of pocket has declined. Total health care spending in the United States remained below 5 percent of gross domestic product (GDP) until 1958; since then, it has more than trippled. 3
Public versus Private Health Spending. The distribution of total health care spending between public and private payers has also changed. From 1929 to 1965, the government share of total spending averaged 22.5 percent of total health care spending. In the years since the creation of Medicare and Medicaid, the average public share has been 41.5 percent of the total. Medicare's share of total health care spending rose during the 1970s but has been relatively stable since then. However, Medicare's share will increase in the future as the prescription drug benefit enacted in 2003 is fully phased in.
Private Spending and the Rise of Third-Party Payers. Private health spending exhibits two key trends: First, there has been a marked transition over the years from first-party to third-party spending; that is, the share of health costs borne by consumers has declined dramatically and other entities (private insurance and public programs) are increasingly picking up the tab. Second, there has been a dramatic shift of health care financing from the private sector to the government, particularly since the introduction of Medicare and Medicaid.
The rise of third-party payment – and the decline of the out-of-pocket share – is rooted in policies enacted during World War II. Since wages were frozen, employers sought other means to attract employees, including increasingly generous employer-sponsored health benefits. A 1943 ruling by the Internal Revenue Service allowed the exclusion of employer-paid health care benefits from income and payroll taxes, providing preferential treatment for insurance purchased through an employer over policies purchased in the individual market. In 1954, the employer exclusion was formalized in the tax code. 4
Between 1948 and 1965:
- Out-of-pocket spending as a percentage of total health spending in the United States dropped from 71.2 percent to 52.2 percent, a 19 percentage point drop.
- Private health insurance grew by almost the same percentage, from 6.3 percent to 25.1 percent, a gain of 18.8 percentage points.
- At the same time, public spending as a percentage of the total increased slightly from 18.5 percent to 20.4 percent.
Clearly, out-of-pocket spending is declining, while third-party spending – particularly from government sources – is rising. These compositional changes help frame the current health care reform discussion.
[page]Medicare has three major parts: Part A, Part B and Part D. Medicare Part A (Hospital Insurance) – which pays for inpatient hospital care, skilled nursing, home health and hospice care – is funded by a 2.9 percent payroll tax on wages and taxes collected on Social Security benefits. According to the 2006 Trustees Report, Medicare Part A is already paying out more than it collects. The program can pay full benefits because it is able to draw on general federal government revenues. 5
“Spending on Medicare-covered services will average $15,269 per beneficiary in 2007.”
Medicare Part B mainly pays physicians' fees. Taxpayers fund three-fourths of the cost through general federal revenues and the remaining one-fourth is paid in premiums by retirees. Medicare Part D is the newly enacted prescription drug program. General revenues and state transfers (that is, taxpayers) foot the bill for 86 percent of the cost and the rest is funded by seniors' premiums. Medicare Parts B and D are sometimes collectively referred to as Supplemental Medical Insurance.
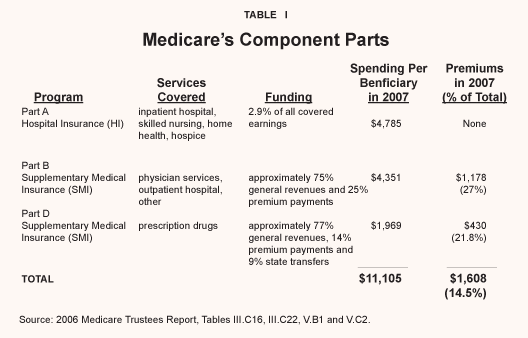
Table I summarizes each of Medicare's parts in terms of covered services, funding, and average spending and premiums:
- Total Medicare spending per beneficiary in 2007 is expected to average $4,785 for Medicare Part A, $4,351 for Part B and $1,969 for Part D.
- Thus, total Medicare spending this year is expected to be $11,105 per beneficiary.
- Of this total, beneficiary premiums will total $1,178 for Part B and $430 for Part D.
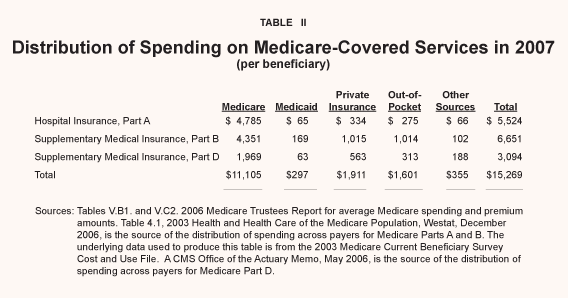
Table II shows the distribution of average spending by various sources on all services covered by Medicare.
- Total spending on Medicare-covered services are estimated to average $15,269 per beneficiary in 2007.
- Medicare will pay for about 73 percent of this total ($11,105), although beneficiaries will cover some of this amount through Part B and Part D premiums.
- Private insurance spending and seniors' out-of-pocket spending combined will pay an estimated $3,512 or 23 percent of the total; 6 the remaining 4 percent comes from Medicaid and other payers.
Medicare is on a spending path that will be difficult to sustain without unprecedented boosts in revenues. We have experienced decades of growth rates of health care spending in excess of the growth rate for the economy as a whole; consequently health care is growing as a share of the economy.
“Health spending grew two to three times faster than the economy over the past half century.”
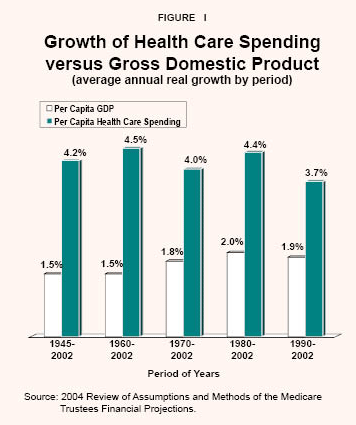
Health Care Spending versus National Income. Figure I shows the rate of growth of per capita health care spending compared with the rate of growth of per capita GDP over the past half century. As the figure shows, health care spending has been rising at a rate two to three times faster than per capita GDP. If this pattern continues, health care's share of the economy will grow considerably: 7
- If the growth of real per capita health care spending exceeds the rate of growth of real per capita GDP by 2 percentage points, health care spending would consume almost 80 percent of GDP by 2075.
- Continuation of past growth rates would imply a five-fold increase in health care's share of the economy from present levels, crowding out the consumption of most other goods.
Clearly this spending path is not feasible. So in projecting the future the Trustees assume that the rate of growth of per capita health care spending will moderate, eventually slowing to the rate of growth of per capita GDP after 75 years. This study uses the same assumptions as the Trustees report.
“The Trustees assume health care spending increases will slow to the rate of economic growth over the next 75 years.”
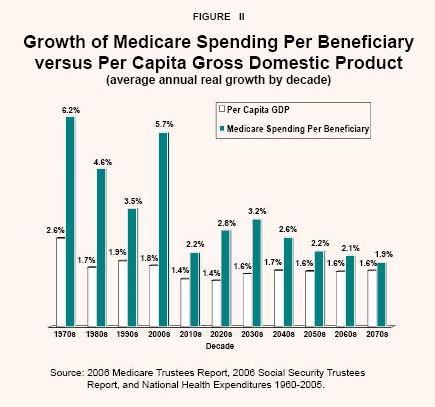
Medicare Spending versus GDP. Figure II compares past growth rates in real per capita GDP and real Medicare spending per capita and pro-jects future growth, reflecting the growth path adjustments adopted by the Trustees in their 2006 annual report. 8 From the 1970s to the 1990s, the annual growth rates in per capita spending declined due to the adoption of the prospective payments system and reforms in the Balanced Budget Act of 1997. The noticeable growth in the decade between 2000 and 2010 is due to the addition of prescription drugs under Part D. The future projections show per capita GDP declines slightly as the baby boomers move from contributing to GDP while working to entering their retirement years.
Additionally, as the baby boomers enter Medicare, the average age of the Medicare population will decline. Since spending on younger retirees is lower than on older retirees, the growth rate in average spending across all retirees will be lower. This is evidenced in the figure for the decade of the 2010s. However, as the baby boomers get older, the average age of the retired population will rise, as will spending. This movement of the baby boomers through retirement is reflected in the changing pattern of spending growth for the decades of the 2020s to the 2040s.
Examining the Reasons for Medicare's Rising Spending. What is driving Medicare's growth? In 1970, five years into the program's payment of benefits, Medicare paid benefits equaling 0.74 percent of GDP; by 2005 the program paid out benefits equal to 2.75 percent of GDP. Of this growth:
- Thirty-nine percent resulted from an increase in the number of beneficiaries.
- Fully 61 percent came from growth in per beneficiary spending in excess of the underlying growth of the economy.
“Average Medicare spending will decline in the short run as younger, healthier baby boomers become beneficiaries.”
Medicare's Impact on the Federal Budget. Until recently, Social Security and Medicare payroll taxes, Social Security benefit taxes and premium revenues combined exceeded spending on Social Security and Medicare. However, last year these two programs paid out $113 billion more than they collected. In the next few years the funding gap will rise rapidly. If no other changes are made in these programs, benefits will be paid only if we draw on the general revenues of the federal government.
“In order to pay benefits in 13 years (2020), the government will have to stop doing one in every five things it does today.”
Currently the two programs use 6.3 percent of nonentitlement revenues (federal revenues dedicated to all other programs besides Medicare and Social Security). By 2010, the combined projected deficits of Social Security and Medicare will equal almost 8.5 percent of nonentitlement federal revenues. By 2020, the deficits will grow to almost 25 percent, assuming no additional taxes. This means that within 13 years, in order to pay projected benefits to retirees and the disabled, the federal government will have to stop doing about one out of every five things it does today. Alternatively, it will have to raise taxes by about 20 percent, significantly cut benefits or make beneficiaries pay for substantially more of their benefits. Any of these options will be very painful.
By the time all of the baby boomers have reached their retirement years, projected Social Security and Medicare benefits will require almost one in every two nonentitlement tax dollars. By 2050, they will require nearly two-thirds.
“By 2050 the government will have to stop doing 60 percent of the other things it does today if taxes are not raised.”
Medicare's Unfunded Liability. Another way to summarize Medicare's projected drain on general revenue under current law is to compare the present value of its funding requirements to the dedicated funding sources over the same period. As Figure III shows:
- Medicare's general revenue funding requirements in excess of dedicated sources (payroll and Social Security benefit taxes, premiums and state transfers) is $32.4 trillion over the next 75 years.
- Looking indefinitely into the future, the unfunded liability is $70.8 trillion.
“Medicare's shortfall in 2080 could be funded with a 57 percent increase in taxes not already dedicated to entitlement spending.”
If the current level of general revenue transfers, as a share of GDP, continued over the next 75 years they would pay for $9.9 trillion of the $32.4 trillion. Stated another way, the current level of general revenue transfers, as a share of GDP, would cover only 30 percent of the program's general revenue obligations. This implies:
- An additional $22.5 trillion is required over and above continuation of the current general revenue commitment to fund Medicare's spending over the next 75 years.
- If the figures are extended to the infinite horizon, the additional funding gap is $55.1 trillion.
Medicare Funding Options
Assuming that paying projected Medicare benefits is the objective, and assuming that other federal programs are not cut, policymakers have these policy options:
1) Raise payroll taxes,
2) Raise all other federal taxes,
3) Increase the premiums paid by beneficiaries, or
4) A combination of tax and premium increases.
“The Medicare payroll tax could be raised from 2.95 percent of payroll to nearly 20 percent in 2080 to fund the additional deficit.”
None of these are popular with all of the various constituencies. Taxpayers – particularly the young – will find it increasingly difficult to pay the taxes necessary to fully fund the program, while beneficiaries bristle at the suggestion of paying a larger share of the program's costs. However, it is important to explore all the options and examine their implications. To that end, this section examines funding projected Medicare spending by increasing taxes, increasing premiums or a combination of the two.
“Paying the additional deficits through premiums would require half of retirees' Social Security benefits by 2030.”
Can the Funding Problem Be Solved with Higher Taxes? The first Medicare funding option isolates and examines how high taxes must rise to meet Medicare's future deficits if other funding sources are held constant at the 2006 level of GDP. The effects of two tax increases are estimated: (1) increasing general federal revenues other than the payroll tax and (2) increasing the payroll tax.
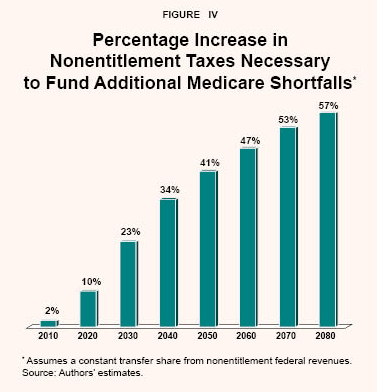
The first estimate assumes that (a) payroll tax rates remain at their current levels, (b) beneficiary premiums continue on their current course and (c) general revenue transfers to Medicare continue at their current share of national income. 9 This exercise takes the general revenue funding requirements in excess of the 2006 level and benchmarks them relative to the 25-year average level of nonentitlement federal revenues. With these assumptions, paying projected benefits will require substantial increases over time in all other sources of federal revenue. As Figure IV shows:
- By 2020, in just 13 years, all other federal taxes must increase 10 percent.
- By 2030, they must increase more than 20 percent, and by 2040 they must increase more than one-third.
- At the end of a 75-year horizon, all other federal taxes, including the income tax, must increase almost 60 percent.
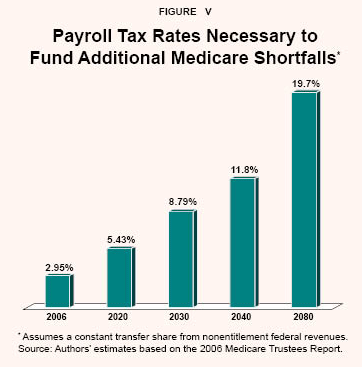
The second estimate assumes that Medicare deficits are covered solely by payroll tax increases. As Figure V shows:
- The current payroll tax of 2.9 percent would have to almost double (rising to 5.4 percent) by 2020.
- By 2030, the rate would be almost 9 percent, more than three times the current rate, and by 2040 it would be more than 4 times the current rate.
- By the close of the 75-year period, the required Medicare payroll tax would be 19.7 percent, almost seven times the current rate.
“By 2080, it would require premiums 30 times the current level to fund the additional deficit.”
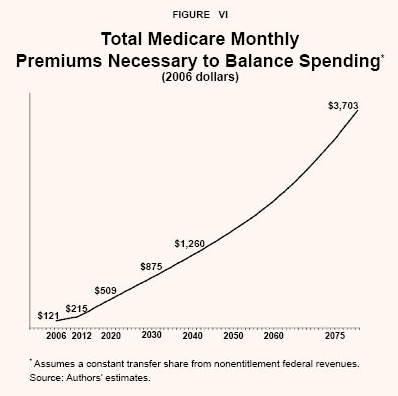
Can the Funding Problem Be Solved with Higher Premiums Paid by Beneficiaries? The second Medicare funding exercise isolates and examines how high premiums would have to rise if payroll taxes and taxes on Social Security benefits proceed as projected in the 2006 Trustees Report and general revenue transfers are held constant at the 2006 level of GDP. 10 As Figure VI shows, the burden on Medicare beneficiaries would be substantial:
- In 2006, seniors paid a monthly Medicare premium of approximately $121.
- By 2030, under this option, monthly premiums will grow dramatically to $875 in 2006 dollars.
- By the close of the Trustees 75-year projection period, Medicare monthly premiums would rise to more than $3,700 – almost 30 times today's level.
Since Medicare premiums are directly deducted from retirees' Social Security checks, these premiums will leave retirees with much smaller checks.
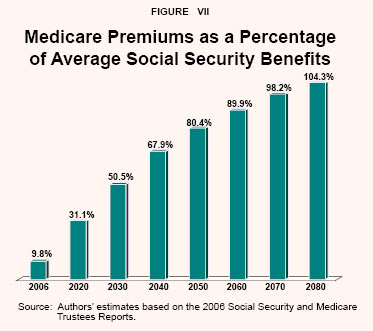
- Today, Medicare premiums consume less than 10 percent of the average new retiree's Social Security check. [See Figure VII.]
- By 2030, if Medicare deficits are covered by increasing premiums, premiums will consume more than half of the average retiree's Social Security check.
- By the 2070, premiums will almost consume the entire Social Security check of an average new retiree.
Thus, having seniors bear the cost of increased Medicare spending is ultimately the equivalent to using Social Security benefits to fund Medicare.
“If the additional deficits were funded exclusively by premiums, premiums would consume all of the average retiree's Social Security benefits by 2080.”
Can the Funding Problem Be Solved by Sharing the Pain? Clearly, financing Medicare's deficits by relying solely on the young (higher taxes) or the elderly (higher premiums) does not appear to be feasible: Either workers will face much higher taxes or seniors' Social Security benefits would be dedicated to paying Medicare premiums. Thus, if policymakers seek to reform Medicare within the system's current structure, there must be some sharing in the funding burden between the young and the elderly.
The most straightforward way of illustrating this sharing is to allow increases in the payroll tax rate to cover the projected Medicare Part A deficit and allow increases in premiums to cover the projected Medicare Part B and Part D deficits.
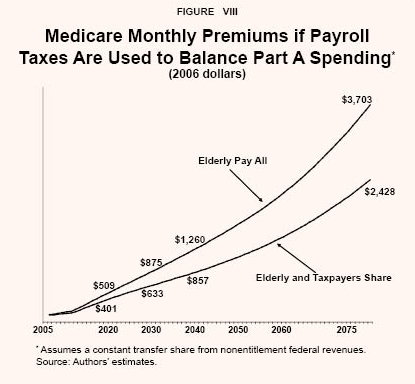
Raising Premiums. Figure VIII shows how sharing the burden between taxpayers and Medicare beneficiaries would affect beneficiaries' premiums. The figure's top line is drawn from Figure VI and assumes the Medicare debt is financed solely by raising seniors' premiums:
- Recall that if Medicare is financed solely by increases in premiums, the monthly premium will rise to $875 by 2030.
- By contrast, if the price hike is shared by beneficiaries and taxpayers, the monthly premium will rise to $633 by 2030.
- By 2080, the monthly premium level rises to $3,703, versus $2,428 if the increased spending is shared by beneficiaries and taxpayers.
“Covering the additional deficit with payroll taxes and premium increases would require one-third of seniors' Social Security benefits by 2030.”
Even if workers shared the burden through payroll taxes that match the full cost of Part A spending, the elderly would still have to give up a significant portion of their Social Security benefits to pay the Medicare premiums to cover the projected deficits in Medicare Part B and Part D:
- Current Medicare premiums require 9.8 percent of a new retiree's Social Security benefit.
- By 2030, new retirees would have to lose more than one-third (34.7 percent) of their Social Security benefit to Medicare premiums.
- Finally, at the close of the Trustees 75-year projection period, new retirees would be forgoing almost two-thirds (63.6 percent) of their Social Security benefit to pay their Medicare premiums.

“Premiums would be lower if payroll tax hikes cover the additional deficit in Hospital Insurance (Part A).”
Raising Payroll Taxes. Under this funding option, payroll tax rates would not rise as high as under the second reform option, which balanced Medicare's debt with payroll taxes alone. But the tax level would still rise substantially:
The payroll tax rate would rise from its current 2.9 percent level to 6 percent by 2030, more than double the current rate.
By 2080, the rate would swell to about 11.6 percent – four times the current rate.
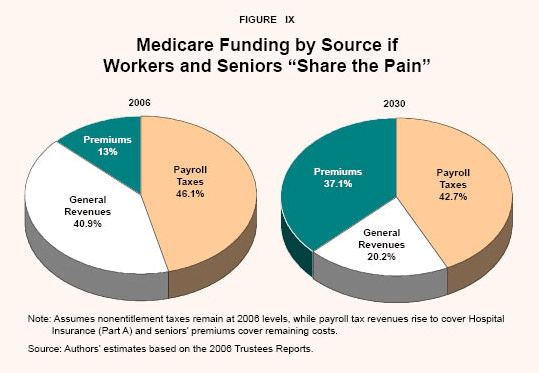
Sharing the Pain. If Medicare's projected shortfalls are shared by workers through higher payroll taxes and retirees through higher premiums, the result is more balanced than under the other two options. As Figure IX shows:
In 2006, payroll taxes accounted for about 46 percent of all Medicare spending, seniors' premiums accounted for 13 percent and general revenues covered about 41 percent of the total.
By 2030, under this option, senior premiums as a share of the total would almost triple to cover about 37 percent of Medicare's spending, while payroll taxes would shrink somewhat to 42.7 percent and general revenues would decline to 20.2 percent of the total.
Can Health Care Rationing Solve the Problem?
If Medicare's funding problems cannot realistically be solved by finding new sources of funds (either from elderly beneficiaries or taxpayers), an alternative is to get off the projected spending path. On the demand side, that means someone must choose between health care and other uses of money. That is, someone must decide that the benefits of the next MRI scan or the next knee replacement are not worth the costs. Such decisions could be made by the seniors themselves (see the next section), by government or by private insurers operating under government rationing rules.
Rationing Health Care with Global Budgets. A common technique in other developed countries is to impose a global budget on health care providers. Sometimes a general spending limit is accompanied by special limits on the purchase of technology. Recent studies by the National Center for Policy Analysis 11 and the Brookings Institution 12 examine how these spending limits affect patients. The Brookings study, for example, concludes that Britain would have to increase its spending by one-third to match the level of patient care available in the United States. 13
To estimate the effects of rationing, assume that each year's cohort of newly eligible baby boomer beneficiaries will be limited in their access to care in the following way. Initial Social Security benefits are determined by indexing a worker's past wages in line with wage growth over time for the economy as a whole. However, once a beneficiary begins receiving payments, Social Security benefits are indexed only for inflation. We examine a similar method for Medicare. Upon reaching age 65, beneficiaries would receive a health plan that covers projected lifetime Medicare costs as they exist in the year they retire. This benefit package will be indexed for inflation only. Thus this constraint would not allow Medicare spending to grow with advances in medical science or with higher incomes. Seniors will very likely want to spend more than the inflation-indexed Medicare benefit package. Such additional spending, however, must be paid from the seniors' own resources.
“Just as is done with Social Security, Medicare spending could be held to the rate of inflation once people are retired.”
Presumably, this policy will be announced in advance so that each generation of retirees will be able to plan and adjust to new Medicare budget caps. Beneficiaries will be able to buy additional care – not provided by Medicare – much as the British do under the National Health Service. This reform is unquestionably harsh, but it is structured to identify by how much such a reform would reduce Medicare's general revenue requirements. Estimating the effect of this type of reform in two ways shows that such constraints on spending growth can reduce Medicare's unfunded liability by 20 percent to 40 percent. It is important to note that under this reform Medicare benefits grow for each new group of retirees, but at a less rapid rate than is currently projected. 14
Why don't spending constraints accomplish more? The reason: 48 percent of the projected growth in Medicare as a share of GDP by 2050 is due to population growth and aging, while 52 percent is due to per capita spending growth in excess of per capita GDP growth. Therefore, reforms which limit reimbursements – even in a best-case scenario – can only affect part of the expected growth in Medicare spending.
[page]Letting Seniors Make Their Own Rationing Decisions
“With a $5,000 deductible, seniors would reduce their spending by as much as one-third.”
An alternative to having Medicare limit health options for the elderly is to redesign the insurance package and have retirees themselves choose between health care and other uses of money. The Medicare projections made by the Trustees are based on a past that is greatly affected by the fact that Medicare beneficiaries have limited incentives to care what health care costs. In particular, the prevalence of medigap (private supplemental) insurance among the Medicare population essentially removes all the deductibles and copays that are Medicare's primary cost-control mechanisms. One simple reform, then, would be to replace first-dollar insurance coverage with Health Savings Accounts (HSAs) combined with catastrophic coverage.
Redesigning Medicare. A possible design would work like this: Individuals would face a high deductible, applied to all Medicare-covered services. They would have 100 percent third-party insurance coverage for all expenses above the deductible and they would pay for all expenses below the deductible from their own pockets or from an individually owned HSA. Note: Although this is a conventional design for HSA products, it is not necessarily the best design (especially for the chronically ill). It is used to identify a range of the effects a high-deductible policy might have on the health care spending of retirees using estimates from the RAND Health Insurance Experiment (see below).
Estimated Effects of Health Insurance with High Deductibles. The results of the RAND Health Insurance Experiment provide benchmarks for estimating the effect of replacing traditional, first-dollar coverage with an HSA coupled to a high-deductible policy. To illustrate the effect of this reform, consider replacing current Medicare with a $5,000 deductible with no other copays. The deductible could rise at the rate of per capita Medicare expenditures. 15 Estimating the effects of a high-deductible policy on Medicare spending in two ways provides a range of potential spending reductions.
“There is an alternative way of reducing Medicare's unfunded liability by as much as 40 percent.”
As the range of estimates in Table III shows, a high-deductible policy can potentially reduce total spending on Medicare-covered services by 27 percent to 41 percent. Specifically:
- Senior premiums for Part B and Part D coverage are reduced by 40 percent to 50 percent (in order to maintain the current cost-sharing percentages).
- Senior medigap premiums are eliminated because beneficiaries would pay the deductible amount.
- In total, seniors spend $1,862 to $2,390 less on Medicare-covered services.
- Government Medicare spending can potentially be reduced by $2,785 to $4,427, or 25 percent to 40 percent below baseline projections.
Impact on the Federal Government Finances . Figure X depicts the range of effects resulting from high-deductible policies coupled with HSAs. Assuming the full effect of the reform is immediate, the general revenue transfer is reduced by more than 60 percent with the lower-bound spending estimate and by almost 40 percent with the upper-bound spending estimate. While the reduction over the entire 75-year Trustees projection period remains very significant, the percentage reduction is less impressive than the initial reduction in the transfer.
In the case of the lower-bound estimate, by 2010, a transfer of 5.5 percent of federal nonentitlement revenues to Medicare will be required; by 2030 it will rise to 18.9 percent of nonentitlement revenues, and by midcentury a transfer of more than 30 percent will be needed. At the close of the 75-year projection period, the lower-bound spending estimate would require a transfer of more than 42 percent of all federal nonentitlement revenues to Medicare. While this terminal year transfer is lower than the 68 percent transfer required under the current Medicare program, the funding burden is still significant.
In the case of the upper-bound spending estimate, by 2010, a transfer of 8.5 percent of federal nonentitlement revenues to Medicare will be required; by 2030 it will rise to almost 25 percent of nonentitlement revenues, and by midcentury the transfer will need to be more than 40 percent. At the close of the 75-year projection period, the transfer using the upper-bound spending estimate would be about 53 percent of all federal nonentitlement revenues.
“Medicare could cover costs above a high deductible and seniors could use Health Savings Accounts for expenses below the deductible.”
Roth-Type HSAs. Currently, people under age 65 have access to HSA plans through an employer or in the individual insurance market. Deposits to HSAs are made with pretax dollars and accounts grow tax-free. From their HSA, people can make tax-free purchases of health care (just as their employer third-party insurance payments are tax-free). However, withdrawals for non-health purposes face ordinary income taxes and a 10 percent penalty as well if the withdrawal occurs before age 65.
The proposal for Medicare beneficiaries is similar, but with important design differences. Specifically, a Medicare beneficiary's deposits to an HSA account should be with after-tax dollars and withdrawals for nonhealth purposes would be tax-free. Such an account would be similar to a Roth IRA in terms of taxation. 16
“With a Roth-type HSA, seniors could withdraw funds for any purpose tax free.”
A Roth-type account is attractive for three reasons. First, most senior health spending is already made with after-tax dollars. Out-of-pocket spending and medigap premiums not paid by an employer are clearly after-tax. Payroll tax dollars for Part A coverage have already been subjected to the income tax. And Part B premiums are deducted from Social Security benefits that are subjected to income taxation through the Social Security benefits tax. Second, a Roth account allows the beneficiary to make unbiased choices between health care and other uses of money. With a regular HSA, a dollar withdrawn for nonhealth purposes faces a 30 percent tax, say, for someone in a 30 percent tax bracket. That means a dollar of health care must trade against 70 cents of other goods. With a Roth account, by contrast, a dollar of health care trades against a dollar's worth of other goods and services. As a result, people will not spend a dollar on health care unless they get a dollar's worth of value. Finally, the RAND experimental results can be applied to a Roth-type account in straightforward way.
As discussed below, deposits to the HSAs could be made by seniors themselves or, during a transition phase, by Medicare. Unspent HSA monies would revert to the individual at the close of each year or could be rolled over to the next year.
“A high-deductible policy would require lower general revenue transfers compared to current-system projections.”
A Phased-In Approach. These results assume an immediate shift to high-deductible policies for all seniors receiving Medicare benefits. 17 Of course, a higher deductible could be phased in gradually in any number of ways, which would delay the projected spending reductions to later years. One approach would make the federal government assume some of the cost below the deductible in order to at least initially make beneficiaries as well-off as under the current arrangement. If the program were redesigned in this way, with an HSA and a $5,000 deductible, how much would the government have to deposit in HSAs to make beneficiaries indifferent to the change? 18 One way to address this question is to consider how government spending on behalf of beneficiaries (the net Medicare benefit) and spending by beneficiaries themselves change with the two estimates presented in Table III.
In 2007, the average net Medicare benefit is $9,500, and seniors spend an average of $1,605 on Medicare premiums and $1,911 on medigap insurance. 19 With a $5,000 deductible, the calculated upper-bound estimate for total Medicare spending would save the government $2,144 per beneficiary and, at the lower-bound, save the government $3,635.
Seniors currently spend $3,500 out of pocket on medigap insurance on average. These funds could be deposited in HSAs, leaving approximately $1,500 up to the $5,000 deductible. During a phase-in of the reform, the government could deposit $1,500 on average in each beneficiary's HSA.
Of course, a $1,500 deposit to every senior's HSA would reduce the potential savings to the government.
Ultimately, the government contribution to the HSA must be phased out if the savings depicted in this study are to materialize. And there are several ways to accomplish this. The HSA deposits could, for example, be gradually reduced for all retirees or only reduced for new retirees. By contrast, the HSA contributions could remain for people who are older, sicker or poorer, while falling for everyone else.
“The government could initially deposit about $1,500 to each beneficiary's Health Savings Account.”
For example, currently, Medicaid implicitly provides the copays for Medicare Part B and Part D for the lowest earners. Thus, one option to phase in the reform is to make the government's HSA contribution inversely related to the beneficiary's Social Security benefit over time. Thus, beneficiaries with low Social Security benefits would receive an HSA contribution equal to the total deductible amount while those with higher Social Security benefits would receive reduced government contributions. This would gradually "means-test" the government contribution to the HSAs. Alternatively, the size of the deductible could gradually be scaled to a worker's lifetime earnings. 20
[page]Conclusion
This paper illustrates the growing reality that serious consideration of Medicare reform is on the short-term horizon. It illustrates the implications of paying for Medicare's funding shortfalls through increased general taxation, increased payroll taxes, increased premium payments from retirees and a combination of increased payroll taxes and increased premiums: None of the options appear attractive. But these funding options illustrate the need for fundamental rethinking of how Medicare is delivered to retirees.
“The government or seniors themselves must ration health care.”
The implications of rationing care were also outlined. Rationing raises the specter of waiting lines, denial of care, and the like. A type of rationing that limits the growth rate of the amount transferred to retirees was discussed. This is really a kind of rationing that makes the Medicare transfer a defined benefit with a defined rate of growth. If retirees want more health care than they can purchase with the "rationed" defined benefit, they would be free to pay the additional cost.
Another type of reform was also discussed. It would make Medicare beneficiaries "ration" their own consumption of health care by using prices to more fully reflect the cost of the health care they consume. Such rationing occurs in every market. Cars, appliances, services, energy, entertainment and food are all rationed through the price system. Consumers weigh the pros and cons of each purchase by evaluating the relative prices of each product. The effects of moving Medicare toward a high-deductible policy in which spending below the deductible is paid for through a Health Savings Account were also illustrated. This kind of reform holds great promise. Insurance can still be provided for catastrophic events, but the market and the price system play increasing roles over time. Importantly, moving to a Medicare program in which workers prepay part of their retirement health care will produce numerous benefits and can be designed in such a way to have broad appeal.
NOTE: Nothing written here should be construed as necessarily reflecting the views of the National Center for Policy Analysis or as an attempt to aid or hinder the passage of any bill before Congress.
[page]Notes
- 2006 Medicare Trustees Report.
- Medicare and Medicaid were created in 1965 at the height of President Johnson's Great Society and War on Poverty. Medicare is a federally funded health care program for seniors and the disabled. Medicaid is a joint federal-state program for the poor and near poor. Although each state operates its own program, the federal government sets the parameters for Medicaid and matches state spending.
- Researchers can track total health care spending since 1929 – and the public and private composition thereof – using National Health Care Expenditure data from the Centers for Medicare and Medicaid Services (CMS).
- See Ronald J. Vogel, "The Tax Treatment of Health Insurance Premiums as a Cause of Overinsurance," in Mark V. Pauly, ed., National Health Insurance: What Now, What Later, What Never? (Washington, D.C.: AEI Press, 1980).
- In doing so, Medicare Part A is technically drawing down the accumulated value of past surpluses credited to a Trust Fund. This practice will continue until the Trust Fund is exhausted by 2018, at which time the program will only be able to pay what it collects in payroll taxes. However, if general revenues are allocated to redeem the trust fund bonds in the years leading up to its exhaustion, Congress is likely to continue to allocate these funds after 2018. The real issue is: What programs and entitlement benefits will have to be cut or what taxes will have to be raised in order to fund the cash flow deficits that have already emerged and will continue to grow indefinitly? To see a more detailed discussion about how the Medicare Trust Fund works, see Thomas R. Saving, "Answering the Myths about Social Security," National Center for Policy Analysis, Brief Analysis No. 509, March 22, 2005.
- Private insurance spending includes both privately purchased medigap (supplemental) and employment-based policies. Also see Table II notes.
- Based on estimates from the "Review of Assumptions and Methods of the Medicare Trustees' Financial Projections" in 2000.
- This figure uses the GDP price deflator to be consistent with the deflator used in producing the previous figure. Based on the 2000 Technical Panel's recommendation, the Trustees adopted the assumption that the long-run real per capita Medicare growth rate would be one percentage point above the growth rate of per capita GDP. With the addition of the projections of Medicare spending into the indefinite horizon in the 2004 Trustees Report, the growth rate assumption was adjusted to assume that after the 75th year of the projection, per capita health care spending would grow at the same rate as per capita GDP. However, for the 2006 Report the Trustees adopted a smoother adjustment path. This path allows for higher growth rates in the early years of the projection with a gradual movement to similar growth in per capita health care spending and per capita GDP.
- Given the financing arrangement for Medicare Part A, projecting its future deficits is simply a matter of measuring the difference between projected expenditures and tax revenues. However, for Medicare Part B and Part D, projecting deficits is not so simple. Since these programs are partially financed through general revenues, they are part of the federal budget, just like NASA or welfare benefits. Thus, in some sense Medicare Part B and Part D can never be in deficit. However, the general revenue transfers required to fully fund Part B and Part D will place increasing demands on the federal budget and, thus, nonentitlement revenues. One way to project Part B and Part D deficits is to measure the difference between projected expenditures and the sum of premiums and general revenue transfers, both fixed at the current share of nonentitlement revenues. Since Medicare Part A is currently funded entirely with payroll taxation, it is not part of a general revenue base budget, and it is reasonable to require that taxation alone be used to fund its future deficits. However, the current level of transfers to Medicare Part B and Part D can be treated as part of a base federal budget. To leave other federal programs unaffected, the share of Medicare transfers that are part of total federal nonentitlement revenues remained at its current level. That is, by letting Medicare transfers grow with the economy by fixing their share of GDP at the 2006 level, other federal programs are also allowed to grow with the economy. Thus, only the growth of Medicare in excess of the growth in the economy will generate an increased tax burden on the population.
- Like the previous option, the share of federal nonentitlement revenues transferred to Medicare in 2006 are assumed to remain constant at their share of GDP when the Part A tax rate is at its current level. Part A revenues are assumed to be as projected in the 2006 Medicare and Social Security Trustees Reports based on a fixed payroll tax rate of 2.9 percent and the revenues allocated to Medicare generated from the taxation of Social Security benefits. In this exercise, increases in Medicare premiums pay the remaining funding requirements again assuming no change in projected spending. As this exercise will show, the implied premium levels would likely cause many retirees to seek alternative insurance coverage and, as a result, currently projected Medicare spending may not be realized under this scenario. Outlining these options simply serves to illustrate the implications of each, using projected spending as the base.
- John C. Goodman, Gerald L. Musgrave and Devon M. Herrick, Lives at Risk: Single-Payer National Health Insurance Around the World (Lanham, Md.: Rowman and Littlefield, 2004).
- Henry J. Aaron, William B. Schwartz and Melissa Cox, Can We Say No? The Challenge of Rationing Health Care (Washington, D.C.: Brookings Institution Press, 2005).
- Ibid., page 106.
- For additional details see Andrew J. Rettenmaier and Thomas R. Saving, The Diagnosis and Treatment of Medicare (Washington, D.C.: AEI Press, 2007).
- See the discussion in Mark V. Pauly and John C. Goodman, "Tax Credits For Health Insurance and Medical Savings Accounts," Health Affairs , Vol. 14, No. 1, Spring 1995, pages 126-39.
- Alternatively, the deductible could be pegged to a particular percentile in the distribution of total spending.
- We assume that disabled Medicare beneficiaries remain in the conventional program. We have not attempted to identify the effects of a high-deductible policy on the rate of growth in health care spending. The RAND Health Experiment results are essentially demand-side level effects. A high deductible for all aged Medicare beneficiaries would also induce supply-side responses among providers as they compete for spending below the deductible amount. Both the demand- and supply-side responses would be expected to lower the rate of growth in health care spending.
- Of course the precise amount depends on the type of beneficiary in terms of their incomes, current health risks, location and whether they currently have some form of private supplemental insurance.
- These are estimated across all beneficiaries and thus include beneficiaries with and without medigap insurance (see Table II).
- A complete HSA proposal includes a prepayment component which allows the government transfer to the HSA to be phased-out for all workers while at the same time producing deductibles that are scaled to a worker's lifetime earnings.
About the Authors
Dr. Andrew J. Rettenmaier is the Executive Associate Director at the Private Enterprise Research Center at Texas A&M University. His primary research areas are labor economics and public policy economics with an emphasis on Medicare and Social Security. Dr. Rettenmaier and the Center's Director, Thomas R. Saving, presented their Medicare reform proposal to U.S. Senate Subcommittees and to the National Bipartisan Commission on the Future of Medicare. Their proposal has also been featured in the Wall Street Journal, New England Journal of Medicine, Houston Chronicle and Dallas Morning News . Dr. Rettenmaier is the co-principal investigator on several research grants and also serves as the editor of the Center's two newsletters, PERCspectives on Policy and PERCspectives . He is coauthor of a book on Medicare, The Economics of Medicare Reform (Kalamazoo, Mich.: W.E. Upjohn Institute for Employment Research, 2000) and an editor of Medicare Reform: Issues and Answers (University of Chicago Press, 1999). He is also coauthor of Diagnosis and Treatment of Medicare (Washington, D.C.: American Enterprise Institute Press, 2007). Dr. Rettenmaier is a senior fellow with the National Center for Policy Analysis.
Dr. Thomas R. Saving is the Director of the Private Enterprise Research Center at Texas A&M University. A University Distinguished Professor of Economics at Texas A&M, he also holds the Jeff Montgomery Professorship in Economics. Dr. Saving is a trustee of the Social Security and Medicare Trust Funds. His research has covered the areas of antitrust and monetary economics, health economics, the theory of the banking firm and the general theory of the firm and markets. He has served as a referee, or as a member of the editorial board, of several major U.S. economics journals and is currently an editor of Economic Inquiry . Dr. Saving has authored many articles and two influential books on monetary theory. He has been president of both the Western Economics Association and the Southern Economics Association. After receiving his Ph.D. in economics in 1960 from the University of Chicago, Dr. Saving served on the faculties of the University of Washington and Michigan State University, moving to Texas A&M in 1968. Dr. Saving served as chairman of the Department of Economics at Texas A&M from 1985-1991. Dr. Saving is a senior fellow with the National Center for Policy Analysis.