Does it pay to work more hours in order to earn more income? The answer depends on what one earns after taxes. Virtually all American households are confronted with high to very high marginal tax rates when they increase the number of hours they work in the current year or in future years. Much of the system’s highest effective marginal taxation comes courtesy of government transfer programs, particularly Medicaid. In fact, penalties for working are astronomical for some households, particularly lower-income families. This study considers the entire panoply of taxes and transfers in measuring the total marginal effective tax rates facing American households with different levels of pre-tax earnings.
Determining the effective marginal tax on working additional hours is difficult because of the complexity of the tax code and the interaction of different government tax and transfer programs (such as food stamps) that are limited to households below certain income and asset ceilings. As a result, many Americans face higher marginal tax rates than they think. Earning an additional dollar can put a family over an income limit and cost thousands of dollars in lost benefits.
In this study, two types of marginal tax rates are calculated: the rate for working additional hours in the current year, and the rate for working additional hours in all future years. To calculate the effective marginal tax on working, this study uses financial planning software that determines tax and transfer payments at each stage of a person’s life, based in part on economic choices they make in prior periods. The model assumes people try to even out consumption over their lifetimes.
The results: The fiscal-tax system is regressive. Due to the loss of benefits as household incomes increase, particularly among lower-income households, effective marginal tax rates are generally and substantially higher for them than for high-income households.
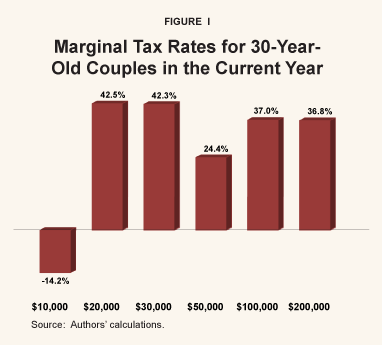
- For 30-year-old couples earning $20,000 the marginal tax rate on an additional dollar earned is 42.5 percent; yet those earning $50,000 a year face a marginal tax rate of only 24.4 percent.
- At age 45, couples earning $30,000 a year face a higher marginal tax rate (41.9 percent) than do those earning $200,000 a year (35.9 percent).
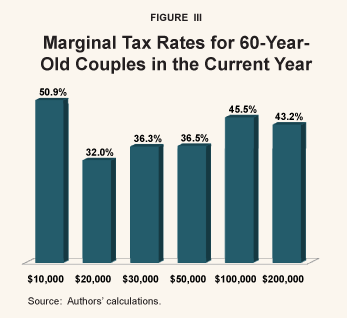
- At age 60, couples earning $10,000 a year faces a marginal tax rate of 50.9 percent, compared to a 43.2 percent marginal tax rate for those earning $200,000!
Moreover, single-parent households who qualify for more benefit programs than do couples face astonishingly high marginal tax rates beginning at lower incomes. For example: - At age 30, a single parent earning $10,000 a year faces a 72.3 percent marginal tax rate on an additional dollar earned due to their loss of welfare benefits; this rate is substantially higher than the 36.9 percent tax rate on the single parent earning $200,000.
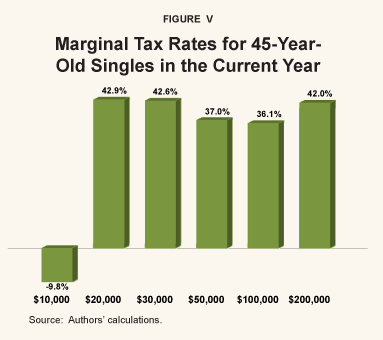
- At 45 years of age, a single parent earning $20,000 faces a marginal tax rate of 42.9 percent; higher than a single parent earning $200,000.
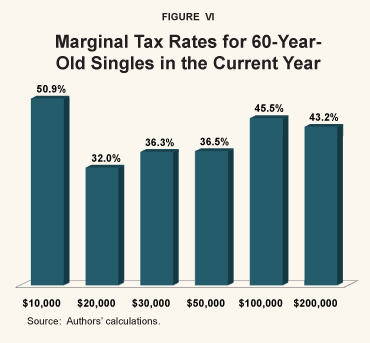
- A 60-year-old single parent earning $10,000 a year faces a 50.9 percent marginal tax rate, while those earning $200,000 face a rate of 43.2 percent.
For 30-year old couples who work additional hours over their lifetimes, the marginal tax rates are generally similar to those reported for them in the current year, with a few exceptions. Couples earning $50,000 will pay a 32.3 percent marginal tax rate on an additional dollar earned over their lifetimes, compared to a 24.4 percent marginal tax rate in the current year.
For 30-year old singles, however, life-cycle and current-year marginal rates vary widely for those earning less than $125,000 a year. For example, singles with annual incomes of $10,000 a year face a life-cycle marginal tax rate of only 0.8 percent on an additional dollar earned annually, compared to a substantial 72.3 percent in the current year.
The U.S. fiscal system penalizes lower-income households that should be given incentives to work more hours for additional income. Policymakers should consider a major overhaul of the tax system to avoid penalizing those who make an effort to move up the income ladder. That overhaul, however, should steer clear of proposing additional programs involving means-tested tax subsidies, as these can raise marginal tax rates even further for low- and middle-income families.
[page]"Working additional hours can cost a family thousands of dollars in benefits."
Does it pay to work more hours in order to earn more income? The answer depends on what one earns after taxes. A worker knows his pretax wage, but determining his post-tax wage can be quite difficult thanks to various tax and transfer programs. As a result, many Americans face higher marginal tax rates than they think. This study considers the entire panoply of taxes and transfers in measuring the total marginal effective tax rates facing American households with different levels of pretax earnings. The findings are striking. Virtually all American households are confronted with high to very high marginal tax rates when they increase either the number of hours they work in the current year or the number of hours they work in each future year. Further, due to the loss of benefits as household incomes rise, marginal tax rates are generally and substantially higher for lower-income households than for high-income households. Much of this regressive taxation comes courtesy of means-tested government transfer programs, particularly Medicaid. Indeed, for many households, small amounts of additional earnings can mean the loss of thousands of dollars in benefits.
[page]The effective marginal tax rate on labor is the sum of taxes paid plus any reduction in government benefits when an additional dollar of income is earned. But what one earns today can affect not just the net taxes one pays today, but also the net taxes one pays tomorrow. Hence, determining today’s marginal tax rate requires taking into account how working additional hours today affects all current and future tax payments as well as all current and future benefits.
There are a host of different taxes and benefits that must be considered. The list of taxes includes federal and state personal income taxes, federal and state corporate income taxes, the federal payroll (FICA) tax, state sales taxes and federal excise taxes. The benefits include Social Security, Temporary Assistance to Needy Families, Supplemental Security Income, Medicaid, Medicare, food stamps, nutrition assistance for women, infants and children (WIC), housing assistance and energy assistance. To properly measure marginal taxes, one must determine how each of these taxes and transfers is calculated, how they interact, and how their amounts change through time.
This study uses ESPlanner™, a personal financial planning software program developed and marketed to the public by Economic Security Planning, Inc., to analyze the marginal tax levied on workers with different expected lifetime earnings. This software program determines a household’s highest sustainable living standard and the saving and insurance needed to sustain it. In the process, the program makes highly detailed, year-by-year federal and state income tax and Social Security benefit calculations.2
"Effective marginal tax rates include taxes and lost government benefits."
The gain from extra work is measured in terms of its impact on current consumption. Thus, if a worker earns an extra $100 this year, permitting this year’s consumption to rise, at most, by $50, the worker faces a 50 percent effective marginal tax rate on his or her labor supply. The term “effective” refers to marginal taxes paid net of marginal transfer payments received.
Of course, working and earning more in the current year is just one potential choice when it comes to expanding a worker’s labor supply. Some workers may be in jobs in which the hours they work are preset by their employer and can’t be changed. For such workers, the only way to adjust their annual hours worked is to switch jobs.
In this study, two types of marginal tax rates are calculated: 1) the rate for working additional hours in the current year, and 2) the rate for working additional hours in all future years. The second of these labor supply changes is referred to as an increase in life-cycle labor supply. To measure the net tax rate on life-cycle labor supply, this study compares the change in the present value of lifetime income — before any taxes and transfer payments arising from a permanent increase in annual hours — to the change in the present value of lifetime spending permitted by this additional labor supply. To simplify, it is assumed that workers’ real wages per hour remain fixed over their lives.
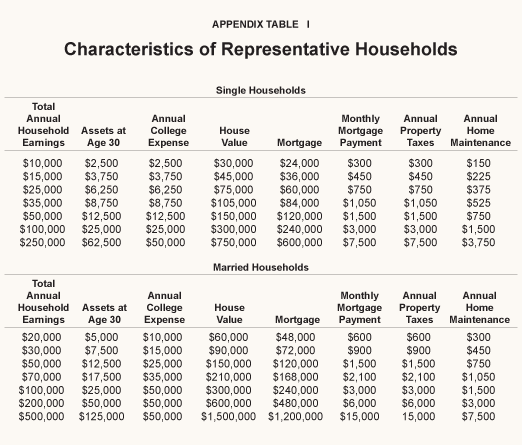
Consistent with economic theory as well as actual behavior, the simulations used in this study assume that, other things equal, people will try to maintain their standard of living — or smooth their consumption — over their lifetimes, even though their wage income fluctuates. For example, a couple starting out with a modest income may borrow to buy a house or to pay education expenses for their children. At middle age, when their children have left the nest and their wages are higher, the couple will accumulate savings and retire their mortgage. During their retirement years, they live on the savings accrued during their working years. [See the Appendix for more information on household characteristics and calculations.] [page]
Since households must meet an income test to qualify for many assistance programs, earning an additional dollar of income can render an individual ineligible for certain benefits. Eligibility requirements for benefit programs vary by state. Calculations in this paper are based on rules for the Commonwealth of Massachusetts in 2005. The non-Social Security benefit programs included are Transitional Aid to Families with Dependent Children, food stamps, Supplemental Security Income, Medicaid and Medicare. The federal income tax’s Earned Income Tax Credit and its Saver’s Credit are incorporated with other tax credits, exemptions and deductions in calculating federal income tax liabilities.
"Earning an additional $100 a month can render a family ineligible for welfare or food stamp benefits."
Transitional Aid to Families with Dependent Children (TAFDC). TAFDC is Massachusetts’ version of the Temporary Assistance to Needy Families (TANF) program, a federal block grant to states that provides cash assistance to low-income pregnant women living alone, or to families with a dependent child. States are allowed some flexibility in determining eligibility and the length of benefit payments. In Massachusetts, benefits are limited to 24 months over a five-year period. TAFDC applicants must pass two income tests: 1) Gross income (including unearned income such as unemployment compensation or interest from a savings account) must not exceed 185 percent of the federal poverty level for a household, and 2) gross income minus certain deductions (such as dependent care deductions) must not exceed 100 percent of the poverty level. The federal poverty level is the income required to purchase basic necessities such as food and shelter. The poverty level varies by family size and is adjusted for inflation. For example:
- If a family of three (adult with two children) has countable monthly income of $600, they will receive the difference between the maximum monthly welfare benefit and their income — $33 a month.4
- However, if the family earns an additional $100 from working additional hours, they will lose the $33 benefit, making their marginal tax rate on $100 at least 33 percent.
Food Stamp Program. The federal Food Stamp Program requires applicants to meet an income test. Their income cannot exceed 200 percent of the federal poverty level.5 Households must satisfy both state and federal requirements to qualify for food stamps. Food stamp payments are determined by subtracting 30 percent of the household’s net monthly income (gross income after deductions) from the maximum monthly benefit for a particular family size. For example, suppose a single woman with one child under the age of 19 is eligible for a maximum monthly benefit of $298.
- If her monthly net income is $875, she is eligible to receive about $35 a month in food stamps.
- However, if she earns an additional $100 from working more hours, she loses her food stamp benefit.
Supplemental Security Income (SSI). SSI is a federal assistance program for low-income individuals age 65 or older, or the disabled of any age. SSI eligibility is subject to income and asset limits. After deductions, the monthly income limit (including unearned income such as unemployment benefits) is $708 for a single person and $1,071 for a couple.6 The income limit is equal to the maximum benefit payment for a household, and benefits are determined by subtracting countable income from this maximum benefit level.7 Therefore, an additional dollar of income causes the household to lose a dollar in benefits.
Low-Income Home Energy Assistance Program (LIHEAP). LIHEAP is a block grant program of the federal government that allocates funds among the states to operate various home energy assistance programs for needy households. The funds may be used for the purposes of home heating and cooling assistance, energy-crisis intervention, low-cost weatherization or other energy-related home repairs.
Households are eligible for LIHEAP if their incomes are no greater than 150 percent of the poverty level or 60 percent of the state median income. The states have flexibility in setting their income eligibility at or below this maximum standard. In Massachusetts, the average benefit per recipient is $480.
Emergency Aid to Elders, Disabled and Children (EAEDC).8 EAEDC is a Massachusetts program that provides cash assistance in addition to medical benefits.9 EAEDC benefits are available to the elderly, the disabled and families with needy children who do not receive or who are waiting to receive other benefits, such as SSI. EAEDC is also available to those who do not qualify for TAFDC due to family restrictions.10 A family of four whose monthly income does not exceed $578.20 will receive the difference between their countable income and the income limit.
"Earning an additional $1 can eliminate Medicaid eligibility."
Medicaid. Medicaid is a joint federal-state program that provides medical care to the poor. Each state establishes its own eligibility standards and general rules, but they are required to cover those with negligible incomes. Under the MassHealth Standard Program, coverage differs according to the characteristics of household members and monthly income before taxes and deductions. Households consisting of a pregnant woman and infant are covered if income does not exceed 200 percent of the federal poverty level; households with non-infant children less than 19 years old are eligible at 150 percent of poverty; and households that include parents and their children under age 19 qualify at 133 percent of poverty.
For example, consider a two-parent family that earns $25,736 per year in labor income and has two dependent children. In Massachusetts, this family is eligible to receive nearly $14,000 in transfers, most of which come from Medicaid. Earning an additional dollar, or indeed, an extra penny, causes the family to lose Medicaid eligibility.
"Most low-income families can’t get a tax credit that rewards saving."
Saver’s Credit. The Saver’s Credit is a federal program intended to help low-income people save. But because of the complexity of the tax code and interactions with other benefit programs, few people actually qualify for the Saver’s Credit. The program allows single households with adjusted gross incomes of less than $25,000 and married households with adjusted gross incomes of less than $50,000 to receive a match of up to 50 cents from the federal government for every dollar they contribute to a retirement plan, such as an IRA, 401(k), 403(b), SIMPLE, SEP or 457 plan.11
The Saver’s Credit is not refundable, and is only available to households with a positive tax liability. Consider a 30-year-old couple with two children, earning a total household income of $25,000 a year. When filing their 2005 tax return:
- They qualify for the standard personal exemption (married, filing jointly), plus child tax credits.
- As a result, they will owe no federal taxes, but will also be ineligible for the Saver’s Credit.
- Even those with a minimal tax liability will benefit little from the Saver’s Credit in comparison to high-income couples who benefit substantially from tax-deferred savings plans.
Earned Income Tax Credit. The Earned Income Tax Credit (EITC) is a refundable credit for low-income individuals and families that have some wage income. “Refundable” means they receive the credit when they file tax returns regardless of whether or not they owe taxes. In 2005, two-child couples with adjusted gross incomes of up to $37,263 and singles with adjusted gross incomes of up to $35,263 qualified for the EITC.
Medicare. Medicare is a federal health insurance program for the elderly and disabled. It incorporates two parts: Hospital Insurance (HI), also known as “Part A,” and Supplementary Medical insurance (SMI), known as “Part B.” Hospital Insurance is generally provided automatically to individuals age 65 and over who are entitled to Social Security benefits. Part A helps pay for care in hospitals, skilled nursing facilities, hospice and some home health care.
Enrolling in SMI is optional; part B helps pay for doctors, outpatient hospital care, clinical laboratory tests, durable medical equipment, most supplies and some other services not covered by Part A.
Medicare Part A is primarily financed through a mandatory 2.9 percent payroll tax. Part B is financed in part by participant premium payments of $78.20 per month regardless of benefits received. It is assumed that at age 65 both husband and wife enroll in both Part A and Part B.
[page]"The effective tax on low-income couples employed full-time starts at a high level."
ESPlanner™ software is used to analyze how the various programs discussed above, in combination with federal and state income tax schedules and the payroll (Federal Insurance Contributions Act, or FICA) tax, determine overall work incentives. This analysis considers representative single and married-couple households at various ages and income levels. Both household types are assumed to have two children born when the parents are ages 27 and 29. A key finding is that marginal tax rates are extraordinarily high for low-income households — in most cases, higher than for rich households.
Couples with Children. Marginal tax rates for couples working extra hours in the current year are substantial at relatively low-income levels. For instance:
- For 30-year-old couples, the highest marginal tax rate is 42.5 percent for a couple earning only $20,000 a year, while those earning $50,000 a year face only a 24.4 percent marginal tax rate. [See Figure I.]
- For 45-year-old couples, marginal tax rates reach 41.8 percent for those earning $30,000 a year, due to the “clawback” of benefits; this rate is even higher than for those earning $200,000 a year (with a marginal tax rate of 35.9 percent). [See Figure II.]
- For 60-year-old couples, the highest marginal tax rate is for those earning only $10,000 a year (50.9 percent); compared to 43.2 percent for the couple earning $200,000! [See Figure III.]
"Marginal taxes are higher on a 60-year-old couple earning $10,000 than on a couple earning $200,000!"
The reason 60-year-old couples face such an extraordinarily high tax rate at the lowest income level is that since they no longer have young children in the house, their earnings exceed the EITC cutoff, and they lose benefits in other programs, such as food stamps.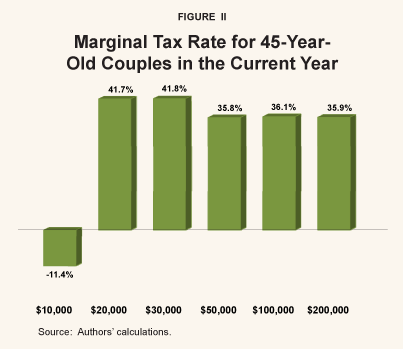
"Low-income single-parent households face higher marginal tax rates than do couples."
Singles with Children. Single-parent households face higher marginal tax rates at lower income levels than do couples since they qualify for more benefit programs and thus have more to lose when they earn an additional dollar. For example:
- A 30-year-old single parent earning $10,000 a year faces a 72.3 percent marginal tax rate on an additional dollar earned because the household loses TAFDC benefits; this tax rate is substantially higher than the 36.9 percent tax rate on the $200,000 income earner. [See Figure IV.]
- A 45-year-old single parent earning only $20,000 a year faces a marginal tax rate of 42.9 percent, a slightly higher rate than the single earning $200,000 a year. [See Figure V.]
- Among 60-year-old singles, whose children have left home, the highest marginal tax rate of 50.9 percent is paid by those earning only $10,000 a year, compared to the 43.2 percent rate for the single earning $200,000 a year! [See Figure VI.]
Among all three age groups, singles with low to moderate incomes are hit with substantially higher tax rates than higher-income households. In all three age groups, the highest marginal tax rates are paid by those earning $20,000 a year or less.
Age, as well as income, affects marginal tax rates. With the exception of the lowest-income earners, middle-aged households face significant taxes on extra hours, in some cases more than younger households. This is because their accumulated savings over the years disqualify them for some benefits that require asset tests.
"Low-income single parents whose children have left home face a 51 percent marginal tax rate!"
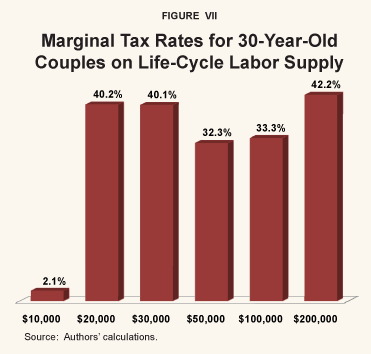
Marginal Tax Rates on Life-Cycle Labor Supply. Suppose that young households work a higher number of hours for additional pay each year over their lifetimes. For 30-year-old couples, life-cycle marginal tax rates are generally similar to the marginal tax rates reported for them in the current year. The main differences occur at income levels of $10,000 and $50,000, where lifetime marginal taxes are significantly higher than those in the current year. For instance [see Figure VII]: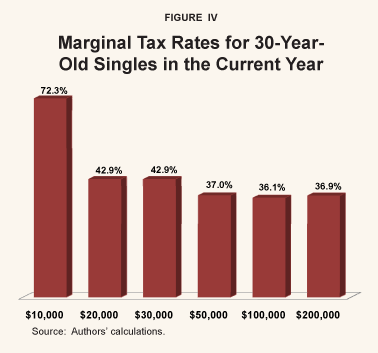
- Couples earning $10,000 annually will pay a 2.1 percent marginal tax on an additional dollar earned; while this seems negligible, it is much higher than the negative tax liability they would have working additional hours in just the current year.
- Couples with annual incomes of $50,000 will pay 32.3 percent in taxes on an additional dollar earned, substantially more than the 24.4 percent marginal tax they would have in the current year.
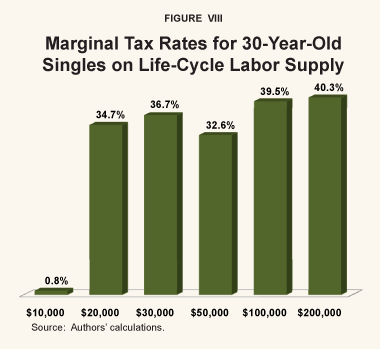
For 30-year-old single-parent households, [see Figure VIII] life-cycle and current-year marginal rates are very different for earnings below $125,000, but quite similar at that level of earnings and above.
"For most 30-year-old singles, marginal taxes on a lifetime of additional work are similar to current year tax rates."
- Those with annual incomes of $10,000 will face a marginal tax of only 0.8 percent per additional dollar earned (compared with 72.3 percent in the current year).
- Single parents with higher annual incomes of $20,000 to $30,000 will pay a 34.7 percent to 36.7 percent marginal tax on an additional dollar earned (compared with 42.9 percent for both in the current year).
- Single parents with annual incomes of $50,000 will pay a 32.6 percent marginal tax on an additional dollar earned (compared with 37 percent in the current year
- However, at an income level of $125,000, marginal tax rates in the current year and over the life-cycle are very similar: 36.2 percent and 37.3 percent, respectively.
"For couples earning $10,000 and $50,000, lifetime tax rates on additional work are significantly higher than in the current year."
Lower-income households will typically face lower marginal tax rates over their life-cycle than during the current year. Part of the reason is that low-income households eligible for Medicaid and TAFDC benefits in the current year will not receive these benefits throughout their lives because of changes in their household demographics and levels of asset income.
|
|
|
|
|
|
"High marginal taxes penalize the efforts of low-income workers to move up the economic ladder."
The United States’ tax-transfer system confronts the vast majority of American households with high effective marginal tax rates on labor supply. The pattern of net marginal tax rates with respect to age, marital status and earnings is all over the map. Factoring in the value of transfer benefits demonstrates that the United States tax system is anything but progressive. For workers who take steps to increase their income through working overtime, or through furthering their education in order to obtain a higher-paying job, the incentives to do so are dismal. Policymakers should consider a major overhaul of the tax system to avoid penalizing those who make an effort to move up the income ladder. That overhaul, however, should steer clear of proposing additional programs involving means-tested tax subsidies, as these can raise marginal tax rates even further for low- and middle-income families.
NOTE: Nothing written here should be construed as necessarily reflecting the views of the National Center for Policy Analysis or as an attempt to aid or hinder the passage of any bill before Congress.
[page]- This study is based on Laurence J. Kotlikoff and David Rapson, “Does it Pay, at the Margin, to Work and Save? – Measuring Effective Marginal Taxes on Americans’ Labor Supply and Saving,” National Bureau of Economic Research, Working Paper No. 12533, December 2006.
-
In determining Social Security benefits the program takes full account of the earnings test, early retirement reduction factors, the delayed retirement credit, the recomputation of benefits, the family benefit maximum, the phase-in to the system’s ultimate age-67 normal retirement age, as well as offset and windfall elimination provisions. ESPlanner’s survivor tax and benefit calculations for surviving wives (husbands) are made separately for each possible date of death of the husband (wife). That is, ESPlanner considers separately each date the husband (wife) might die and calculates the taxes and benefits a surviving wife (husband) and her (his) children would receive each year thereafter. Moreover, in calculating survivor-state specific retirement, ESPlanner takes account of all the benefit adjustment factors.
-
Individual workers and couples accrue higher Social Security benefit levels from increases in hours worked and may pay higher taxes in retirement as a result. Any increase in the income they expect to receive in retirement affects their preretirement savings and consumption patterns, due to consumption smoothing. ESPlanner accounts for the effects of their net Social Security benefits and other savings on lifetime consumption. The level of benefits they receive and taxes they pay will also affect their propensity to work in retirement. However, none of the individuals or couples in the simulations are receiving Social Security benefits. In this study, the focus is on additional taxes paid and benefits lost per each additional dollar of labor income. For a detailed discussion of the effects of Social Security on lifetime saving and consumption patterns, see Laurence J. Kotlikoff, Ben Marx and Pietro Rizza, “How Much Do Americans Depend on Social Security?” National Center for Policy Analysis, Policy Report No. 301, August 2007.
-
“Countable” income is any income received by a potential program enrollee that is used to determine eligibility for benefits. It can include wage income, child support, unemployment benefits, and lump sum payments. Countable income requirements can vary by program.
-
Jocelyn Bauduy and Christine Somogyi, “Food Stamps: Financial Eligibility Requirements,” MassResources.org. Available at http://www.massresources.org/pages.cfm?contentID=12&pageID=3 &Subpages=yes&dynamicID=418. All other households not mentioned in the above text must meet an asset limit of $2,000. Households with a disabled person or a person age 60 or older must meet an asset limit of $3,000.
-
“State Assistance Programs for SSI Recipients, January 2005: Massachusetts,” Social Security Administration, September 2005, Table 1. Available at http://www.ssa.gov/policy/docs/progdesc/ssi_st_asst/2005/ma.html
-
Jocelyn Bauduy and Christine Somogyi, “Supplemental Security Income: Financial Eligibility Requirements,” MassResources.org, February 16, 2007. Available at http://www.massresources.org/pages.cfm?contentID=18&pageID=4%20&subpages=yes&SecondLeveldynamicID=359&DynamicID=357.
-
Jocelyn Bauduy and Christine Somogyi, “Emergency Aid to Elders, Disabled and Children (EAEDC): An Overview,” MassResources.org, January 10, 2007. Available at http://www.massresources.org/pages.cfm?contentID=16&pageID=4&Subpages=yes.
-
Medical benefits are provided by MassHealth, the state health insurance program.
-
Caregivers in disabled households are eligible for EAEDC but not for TAFDC.
-
“Retirement: Saver’s Credit,” University of Washington, Human Resources, undated. Available at http://www.cac.washington.edu/admin/hr/benefits/retirement/vip/saver-credit.html.
[page]
Laurence J. Kotlikoff, a senior fellow with the National Center for Policy Analysis, is a professor of economics at Boston University, research associate of the National Bureau of Economic Research, fellow of the Econometric Society, a member of the Executive Committee of the American Economic Association and president of Economic Security Planning, Inc., a company specializing in financial planning software. Prof. Kotlikoff received his Bachelor of Arts degree in economics from the University of Pennsylvania in 1973 and his Doctor of Philosophy degree in economics from Harvard University in 1977. From 1977 through 1983 he served on the faculties of economics of the University of California–Los Angeles and Yale University. In 1981-1982 Prof. Kotlikoff was a senior economist with the President’s Council of Economic Advisers. Prof. Kotlikoff is coauthor (with Scott Burns) of The Coming Generational Storm; coauthor (with Alan Auerbach) of Macroeconomics: An Integrated Approach and Dynamic Fiscal Policy; author of Generational Accounting and What Determines Savings?; coauthor (with Daniel Smith) of Pensions in the American Economy; and coauthor (with David Wise) of The Wage Carrot and the Pension Stick. In addition, he has published extensively in professional journals, newspapers and magazines.
David S. Rapson is a doctoral candidate in economics at Boston University where he holds a Dean’s Fellowship. He received a Bachelor of Arts degree in economics from Dartmouth College in 1999 and a Master of Arts degree in economics from Queen’s University in 2003. Rapson’s research interests include public finance, environmental economics and applied industrial organization. Before returning to school for graduate studies he worked in Boston for three years as a strategy consultant.