The well-documented rise in economic inequality in the United States over the last two decades is somewhat misleading. Almost all Americans, whether considered “rich” or “poor,” are better off economically today than in previous times. Furthermore, due to the high degree of income mobility in the United States, most people move between income groups throughout their life.
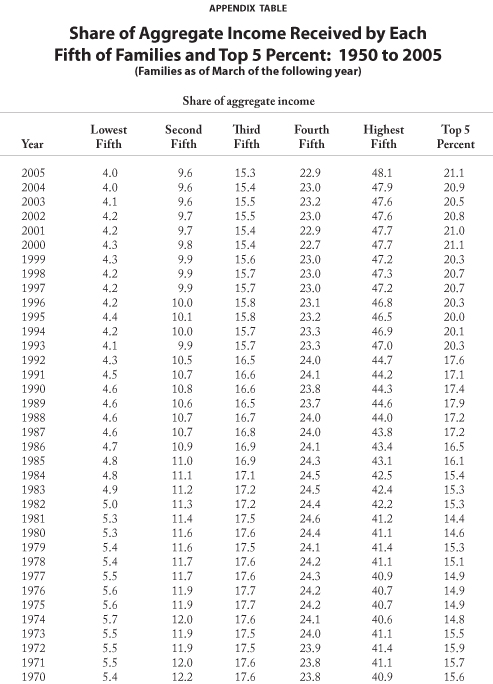
The gap between the top and bottom fifths of families measured by income (called quintiles) has increased substantially since about 1970. The bottom quintile received 5.4 percent of all the money income in 1970, falling to 4 percent in 2005. Meanwhile, the share of income going to the top quintile rose from 40.9 percent in 1970 to 48.1 percent in 2005. However, total income grew over that time, and the real income of every income group rose.
Furthermore, household income varies substantially for several reasons that are often ignored, including: 1) differences in the number of family members who work, 2) differences in the amount of work and 3) differences in age.
- High-income households are not likely to consist of one person earning a very high income (as is often assumed); rather, they are likely to have two or more income earners:
- In 2006, a whopping 81.4 percent of families in the top income quintile had two or more people working, and only 2.2 percent had no one working.
- By contrast, only 12.6 percent of families in the bottom quintile had two or more people working; 39.2 percent had no one working.
- The average number of earners per family for the top group was 2.16, almost three times the 0.76 average for the bottom.
- Census data show a large difference in full-time work and in the number of weeks worked in a year.
- Less than one-third of families in the lowest quintile had a head of household working full-time; in the top quintile, more than three-fourths of families did.
- Thus, average families in the top group have many more weeks of work than those in the bottom and, in the late 1970s, the 12-to-1 total income ratio shrunk to only 2-to-1 per week of work, according to one analysis.
- Workers tend to start out at a low income, increase their earnings with experience, and then have lower incomes late in their careers or in retirement. For example, peak earnings typically occur in the 35-to-54 age group. However:
- In the bottom income quintile, only one-third of households are headed by someone 35 to 54; whereas, in the top quintile, more than half of household heads are in that age range.
- The bottom group also has a much larger proportion of household heads more than 75 years of age — 11.5 percent versus 2.3 percent for the top group.
- The bottom also has more young heads of households ages 15 to 24 — 10 percent versus 1.1 percent for the top.
Many redistribution advocates fail to see that raising marginal tax rates on higher incomes would, in fact, increase measured inequality. The reason is that an increase in the marginal tax rate would discourage work. This reduction in the supply of labor would drive up the before-tax pay of the highest earners. All other things equal, their after-tax pay would decrease and after-tax inequality would fall — but (before-tax) measured inequality would rise.
The income distribution should be judged not by how equal it is, but by how people obtained what they have. Inequality due to government-granted privileges, in the form of subsidies, quotas and so forth, is arbitrary and unfair, while inequality due to income earned through work and investment is just.
[page]The rise in economic inequality in the United States over the last two decades is well-documented by economists. The attention researchers give this subject and the results they have found should be expected for two reasons.
First, in U.S. society there is generally a strong egalitarian ethic. Differences in income are widely suspect unless strongly justified, and accepted justifications are fairly narrow. Economists share this egalitarian ethic as much as the general public, if not more so. Moreover, they focus much more consistently than the general public on the desirability of equality. This egalitarian ethic among economists is not new. In their famous critique of rent control, the late Milton Friedman and George Stigler wrote:
For those, like us, who would like even more equality than there is at present, not just for housing but for all products, it is surely better to attack directly existing inequalities in income and wealth at their source than to ration each of the hundreds of commodities and services that compose our standard of living.2
Second, economic inequality has been extensively documented because economists today have much greater access to a larger amount of data, as well as more tools to empirically analyze the data, than just a few decades ago. Yet despite their sharpened tools, many economists have drawn incorrect empirical conclusions. Fortunately, other economists have corrected them.
In this study, I make five main points about inequality:
- Although income inequality has increased, it has not increased as much as some economists claim.
- Even though inequality has increased, almost all Americans have become better off economically.
- Household income varies substantially for three reasons that are often ignored: (i) differences in household size and especially in numbers of workers, (ii) differences in skill levels among people, and (iii), related to both of the above, differences in age.
- Income mobility substantially mitigates inequality, and income mobility in the U.S. economy is quite high.
- The majority of economists judge how just an income distribution is only by how equal it is; they don’t ask how people obtained what they have. This disregards the fact that, by and large, those with higher incomes have earned them.
Income inequality of families in the United States has increased substantially since about 1970. [See Appendix Table for detailed numbers.] For instance:
- In 1970, families in the lowest income quintile (fifth) received 5.4 percent of all the money income — falling to 5.3 percent in 1980, 4.6 percent in 1990, 4.3 percent in 2000 and 4.0 percent in 2005.
- The share of income going to the top quintile of families, by contrast, rose from 40.9 percent in 1970 to 41.1 percent in 1980, 44.3 percent in 1990, 47.4 percent in 2000 and 48.1 percent in 2005.3
These data clearly indicate increasing inequality, but they do not give the reasons for the increase. Nor do they show that “the rich got richer and the poor got poorer.” This conclusion doesn’t follow for three reasons.
“Inequality has increased, but all income groups are better off.”
First, the terms “rich” and “poor” relate to wealth, not income. A family can have a low income and high wealth, as do many families headed by a retiree. Indeed, the second-wealthiest group of families consists of those headed by someone who is 65 or older.4 On the other end, a family can have high income and little wealth, as do many families with a household head who is young and highly paid.
Second, if the shrinking percentage of total income of the lowest quintile were part of a growing income pie — which the Census data confirm it is — low-income earners could still be better off than they were previously with a slightly larger piece of a smaller income pie.
Third, the data are a series of snapshots of people in the various quintiles. There is substantial mobility among quintiles. This means that poor people, even measured by income and not wealth, could be better off because they moved to a higher quintile.
[page]Before discussing the increase in income inequality, it is important to understand some of the major factors behind whatever level of income inequality actually exists. When noneconomists think about income inequality, they tend to picture families in all income quintiles looking pretty much alike except for income and ethnicity. They think one or both parents in lower-quintile families work just as many hours as parents in high-income families, if not more. They assume the only difference is that low-income parents work for very low wages. But this picture is false for a number of reasons.
“The number of family members working makes a big difference in its income level.”
Number of Workers. High-income households are not likely to consist of one person earning a very high income (as is often assumed); rather, they are likely to have two or more income earners. Consider the income numbers for 2006, reported by the Census Bureau [see Figure I]:
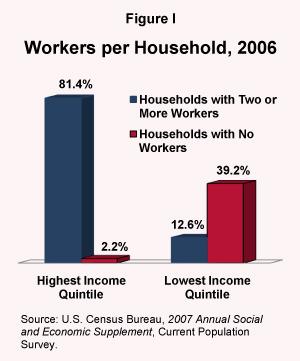
- A whopping 81.4 percent of families in the top quintile have two or more people working, and only 2.2 percent have no one working.
- By contrast, only 12.6 percent of families in the bottom quintile have two or more people working; 39.2 percent have no one working.
- The average number of earners per family for the top quintile is 2.16, almost three times the 0.76 average for the bottom quintile.5
Amount of Work. Census data also show a large difference in full-time work. Of the 15.69 million families in the bottom quintile, less than one-third (5.36 million) have a head of household (the Census Bureau now calls them “householders”) working full-time; in the top quintile, more than three-fourths (12.38 million) of families do.
Furthermore, the 12-to-1 ratio of total income of the highest-income quintile to the lowest-income quintile shrinks considerably when their income per week of work is compared. Commenting on late 1970s data, economist Alan Blinder pointed out:
“[T]he richest [by which Blinder means ‘highest-income’] fifth of families supplied over 30 percent of the total weeks worked in the economy…while the poorest [by which Blinder means ‘lowest-income’] fifth supplied only 7.5 percent. Thus, on a per-week-of-work basis, the income ratio of rich and poor was only 2-to-1. This certainly does not seem like an unreasonable degree of inequality.”6
Age. TheCensus data reveal something else many people find surprising: the correlation between income and age [see Figure II].7 There is a life cycle to income. Workers, whether high-school dropouts, high-school graduates or college graduates, tend to start out at a low income, increase their income with experience, and then have lower incomes late in their careers or in retirement.
“Workers’ incomes rise with age and experience.”
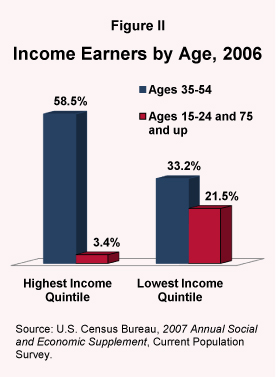
In the lowest quintile, for example, only 33.2 percent of households are headed by someone in the age group from 35 to 54; peak earnings typically occur within this age range. In the highest quintile, by contrast, 58.5 percent of household heads are between the ages of 35 and 54. As would be expected also, the lowest quintile has a much larger proportion of elderly household heads more than 75 years of age — 11.5 percent versus 2.3 percent for the top quintile. The lowest quintile also has more young heads of households ages 15 to 24 — 10 percent versus 1.1 percent for the top quintile.
Immigration. In 1999, 16.8 percent of the foreign-born population was poor, versus 11.2 percent of native-born Americans.8 A higher immigration rate increases inequality; however, it can do so without making a single person worse off. This is because immigrants, although poor by U.S. standards, are likely still better off than they were previously. In addition, adding these immigrants does not directly change the economic status of Americans. The point is that increased immigration can make the data on inequality look far worse than the reality.
[page]If we cannot infer from the data on increasing inequality that the rich are getting richer while the poor are getting poorer, what is true?
Those who get their information from New York Times columnist and economist Paul Krugman can be forgiven for concluding that the poor — and everyone else below the top 10 percent — are worse off. But Krugman cannot be forgiven because it is not true. In a 2004 Nation article, Krugman wrote:
According to estimates by the economists Thomas Piketty and Emmanuel Saez — confirmed by data from the Congressional Budget Office —between 1973 and 2000 the average real income of the bottom 90 percent of American taxpayers actually fell by 7 percent.9
But as economist Alan Reynolds has shown, Krugman’s statement is wrong for two reasons.10 First, Congressional Budget Office (CBO) estimates go back only to 1979. Second, the CBO data show that from 1979 to 2000, average after-tax income in each quintile of the household income distribution rose. 11 In 2003 dollars, for the lowest quintile it rose from $13,500 to $14,600; for the second-lowest quintile it rose from $27,300 to $30,900; for the middle quintile it rose from $38,900 to $44,700; for the second-highest quintile it rose from $50,900 to $63,300; and for the top quintile it rose from $89,700 to $151,100.
“The after-tax income of every income group rose from 1979 to 2000.”
Thus, in order for Krugman’s claim to hold true (the CBO reference aside), the average income of the bottom 90 percent would have had to have fallen drastically between 1973 and 1979 to more than offset the later increase. Reynolds uses U.S. Census data to show that no such thing happened.
As for the Piketty-Saez study that Krugman and many others have cited, Reynolds points out just how implausible their data are as a measure of family income. Piketty and Saez write that in 2000, “the median income, as well as the average income for the bottom 90 percent of tax units is quite low, around $25,000.”12 Note the use of the term “tax units.” “Tax units” are not the same as families. A single family, for example, could have two tax units: a husband and wife filing jointly, and a child filing on his own. But that has not stopped Krugman and others from writing as if “tax unit” and “family” are synonymous. Reynolds points out that if tax units were the same as families, highly implausible implications would follow. For instance, given the meaning of the word “median,” for Krugman’s claim to be true, 45 percent of families (half of 90 percent) would have had to make less than $25,000 in 2000. However:
- U.S. Census data show that the median family income for 2000 was $50,732, which means that 50 percent of U.S. families made more than $50,732.
- If half of all families made more than $50,000, and half of the “bottom 90 percent” made less than $25,000, the remaining 5 percent of the families not accounted for (100 percent minus 50 percent minus 45 percent) would have had incomes above $25,000 but below $50,732.
It is implausible that the income distribution would be so skewed. The problem is the association of "tax unit" with family.
Furthermore, the way Krugman and others have relied on the Piketty-Saez data on family welfare is completely at odds with their criticism of using tax data to estimate income mobility. In 1992, the U.S. Treasury published a study which showed that taxpayers in one income quintile in 1979 were highly likely to have moved to another income quintile by 1988. In other words, there has been substantial income mobility. But, in 2002, Krugman wrote:
The restriction to individuals who paid taxes in all years immediately introduced a strong bias toward including only the economically successful; only about half of families paid income taxes in all ten years. This bias toward the successful was apparent in the fact that by the end of the sample period the group contained very few poor people and a lot of affluent ones: indeed, only 7 percent of the sample were in the bottom quintile by the sample's end, while 28 percent were in the top quintile.13
This is an important criticism. But caution applies to Krugman’s use of data on taxpayers over time. Just as one cannot use taxpayer data to infer families’ income mobility, one cannot use “tax unit” data to estimate how well families in various income classes have done.
One other point is important also. Truth be told, we really have no idea what the true income is of the highest-income people because so much of it is in the form of capital gains. An increase in the price of an asset is income to the owner. Capital gains are reported only when taxpayers sell their assets. If they don’t sell their assets, they could have a huge income and we would not know it by looking at published government data. Someone could have a zero reported income but a true income of $1 million if his assets appreciated by $1 million in a particular year.
Economic Growth. One factor noted by Reynolds that causes increasing inequality is simply economic growth. When the rate of economic growth is high, workers see large real increases in income. But in 2001, 72.6 percent of the money income received by the bottom quintile was in the form of government transfer payments, excluding all noncash transfers such as Medicaid.14 In boom times, people in the bottom quintile do not get large increases in real income because much of their income is transfers from government. The bottom quintile stay in place or move up slightly while all other quintiles do better due to higher pay and more work. But this simply reflects a booming economy, not that the lowest quintile is doing worse.
Of course, if high economic growth is accompanied by inflation, even moderate inflation, many people in the bottom quintile could do worse because welfare payments are not indexed for inflation but adjusted only with a lag. (This group would not include Social Security recipients because their benefits are indexed to inflation.) But it is important to attribute the worsening condition to its real cause — inflation — not to economic growth, and certainly not to the “ill-gotten” gains of those with higher incomes.
“The top fifth has a lot of income from capital gains, while the bottom fifth has government transfers.”
Ignoring Consumption. The issue of inflation brings us to another point: The Consumer Price Index (CPI) has exaggerated inflation for at least a few decades. Economist Michael Boskin estimates that the CPI overstates inflation by 0.8 to 0.9 percentage points annually due to three factors: 1) failure to account for substitution among goods, 2) failure to account for substitution among retail outlets — the so-called “Wal-Mart effect,” and 3) failure to account for new products.15 This overestimate does not “add up” over time — it “compounds up.” Thus, over 20 years, a constant 0.9-percentage-point bias overstates the increase in the cost of living by 19.6 percent. Over 32 years, it overstates the increase in the cost of living by 33.2 percent.
Moreover, before the Bureau of Labor Statistics made adjustments in the late 1990s, the CPI exaggerated inflation by more than 0.9 percentage points annually. This means that even when “inflation-adjusted” incomes tend to be stagnant, they have actually risen. One way to see this is to look at what people have — the kinds of clothing and shoes they have, the kinds of appliances they have, the kinds of cars they drive, and so forth. Michael Cox and Richard Alm found that on virtually all of these dimensions, the life of virtually everyone in the United States improved between the early 1970s and the mid-1990s.16
[page]Interestingly, because of the way incomes are often measured, many of the policies that various redistribution advocates propose would, in fact, increase measured inequality. These policies include: 1) increasing marginal tax rates on high incomes and/or 2) increasing the Earned Income Tax Credit.
The first policy — increasing marginal tax rates — would increase measured inequality as long as the supply curve of high income earning labor is even slightly upward-sloping. The reason is that an increase in the marginal tax rate would discourage work. This reduction in the supply of labor would drive up the before-tax pay of the highest earners. All other things equal, their after-tax pay would decrease and after-tax inequality would fall — but measured inequality would rise. One can easily imagine advocates of such a policy promoting even higher marginal tax rates on high earners on the grounds of “we didn’t increase taxes enough to have an effect.” Of course, the ironic result would be a further increase in measured inequality.
The second policy, increasing the Earned Income Tax Credit (EITC) by raising the upper end of the income range over which people qualify, could have a similar effect to increasing marginal tax rates. Those at the new upper end would likely cut their work hours — and, therefore, their pay — to get the marginal subsidy for not working. Assuming this effect were not enough to cause a noticeable effect on wage rates, before-tax incomes of the newly qualifying EITC recipients would fall. Of course, they would be better off in income terms, but if the measure of income does not include the tax credit, measured inequality would increase. Just as in the case of increases in marginal tax rates, one can imagine advocates of an EITC increase calling for further increases on the grounds that the previous increases were not large enough.
[page]The idea that income inequality measures anything important is undercut to the extent people shift frequently from one quintile to another. And in the United States, as in many other relatively free countries, income mobility is substantial.
To repeat: income mobility is substantial. Why does that need to be emphasized? Because of a spate of articles three years ago in the New York Times and the Wall Street Journal that, to careless readers, communicated the opposite.
“Increasing taxes on additional income can raise measured inequality.”
“As Rich-Poor Gap Widens in the U.S., Class Mobility Stalls,” read the headline on page one of the May 13, 2005, Wall Street Journal. Viewing such a headline, one would think it means that the income mobility of Americans is no longer as great as it was. That is what many tend to think upon seeing the verb “stalls.” If it were really true that it had become more difficult for Americans to move from one income group to another, there would be cause for alarm. It would certainly justify a front-page article in the Wall Street Journal. But it is not true. Moreover, amazingly, the Journal’s very own article never claimed that income mobility was falling.
Thus, an article with a dramatic headline about income mobility having “stalled” doesn’t claim that income mobility has in fact fallen. In the third paragraph, when the article’s author, David Wessel, finally gets to the important facts, he writes:
As the gap between rich and poor has widened since 1970, the odds that a child born in poverty will climb to wealth — or a rich child will fall into the middle class — remain stuck. Despite the spread of affirmative action, the expansion of community colleges and the other social change designed to give people of all classes a shot at success, Americans are no more or less likely to rise above, or fall below their parents’ economic class than they were 35 years ago.
In other words, income mobility has not changed over the last 35 years. It turns out that the Journal used the word “stall” to mean “remain constant.” Just imagine what headlines would look like if the newspaper’s editors had the same news sense when writing about other things that didn’t happen or that continued on normally. For example: “California goes another month without earthquake;” “War between France and U.K. nowhere on the horizon;” “Women continue to get pregnant.”
In misleading readers about income mobility, Wessel was not alone. Just two days later, the New York Times carried an article similar in tone: “Class in America: Shadowy Lines that Still Divide.” A careful reading of the article leads one to the conclusion that, if its data are correct, income mobility is unchanged. According to the Times, “mobility seems to have stagnated.” Note the use of the word “stagnated.” It means the same thing as “stalled.” When the article’s authors, Janny Scott and David Leonhardt, get to the facts, they admit:
Some economists consider the findings of the new studies murky; it cannot be definitively shown that mobility has fallen during the last generation, they say, only that it has not risen. The data will probably not be conclusive for years.
Yet throughout their piece, the reporters add lines that undercut the message that income mobility is unchanged. They write, for example, “Conservatives tend to assert that mobility remains quite high, even if it has tailed off a little.” Yet they cite no evidence that mobility has tailed off. Elsewhere they quote Amherst College president Anthony W. Marx as saying, “If economic mobility continues to shut down, not only will we be losing the talent and leadership we need, but we will face a risk of a society of alienation and unhappiness.”
“Many people born in one income class move to another.”
But Marx’s statement assumes that economic mobility has shut down. A careful reporter trying to give his readers accurate information would not have bothered using this statement because it contradicted the truth, or would have at least offset it with a quote or a comment pointing out the statement’s falsity. Scott and Leonhardt did neither.
What is often missing from these arguments is that many young people start out in the bottom or second-lowest income quintile and move up as they acquire skills and are promoted. Yet even free-market economists have ignored this fact. Commenting on the aforementioned 1992 Treasury study, University of Chicago economist Kevin M. Murphy stated, “This isn’t your classic income mobility. This is the guy who works in the college bookstore and has a real job by his early 30’s.” But Murphy is wrong. This is classic income mobility. In other words, age is the main factor that causes people to move from one income category to another.
[page]Economists tend to justify substantial inequality of earnings on the grounds that it is required to give people a strong incentive to be productive. In the extreme case of total equality of earnings, what would be anyone’s incentive to become educated, to take a job on the Alaska Pipeline, to work overtime, or to start a risky business? The pay incentive would be literally zero. Therefore, substantial pay differentials are justified on narrow grounds of efficiency. As economist Finis Welch points out:
Wages play many roles in our economy; along with time worked, they determine labor income, but they also signal relative scarcity and abundance, and with malleable skills, wages provide incentives to render the services that are most highly valued.22
That is what economists tend to say when questioned about the justification for inequality. But is that all? Is there something major left out?
The answer is yes. What is left out is that those who have the highest incomes in a free society by and large earned them. Either they earned their income as wages and salaries, or as interest, dividends and capital gains. In this sense, inequality is justified.
Conversely, concern about income inequality would be justified if a large part of the income inequality came about due to a lack of freedom — in short, in a society of privilege. The term “privilege” is often used today as a synonym for wealth, but the 19th century British definition of a society of privilege is one in which the government grants special status to certain groups or people. For example, slave owners were privileged and slaves were the opposite of privileged. In today’s society, politicians, farmers who grow subsidized crops, labor union members, students whose college costs are subsidized and beneficiaries of government systems of racial quotas are all privileged. If income inequalities come about because of privilege, those income inequalities are wrong.
One rough indicator of privilege is the Census data on U.S. counties with the highest median household incomes. In 2006, five of the top 10 (including the top three) were in or around the Washington, D.C., metropolitan area.23 One reason for this is that government work — working for the government or lobbying it — attracts highly skilled people who would likely do well elsewhere. But much also has to do with the coercive-transfer state — a large government whose major activity is using tax money and regulatory power to benefit some at the expense of others. Moreover, these explanations are not necessarily competing; the transfer state attracts smart people. Indeed, this is one of the main arguments against the transfer state: huge amounts of resources are wasted on investment in transfers.
“Inequality due to government-granted privileges is wrong.”
The income inequalities that result from state transfers are derivative wrongs. They are not the fundamental wrong. The fundamental wrong is the government granting of privilege. If, for example, households whose incomes were raised by government privilege squandered their wealth so that their only source of income were their wages and salaries, and not dividends, interest and capital gains, there would be less inequality but just as much injustice.
[page]Justice and Fairness. Philosophers have two primary ways of judging whether something is fair. One is the end-state view of fairness: the outcome is fair based only on the outcome and not on how it was achieved. The other is a process view of fairness: the outcome’s fairness cannot be judged independently of the process used to get there. To contrast the two types of rules, consider two people, each with $1 million. One made his by coming up with a new product that he sold to customers, and never cheated or lied to any customer or employee. The other designed a clever piece of computer software that stole $1 from the bank accounts of each of one million people. Which of the two made his money justly? Virtually all of us would answer that it was the former. In other words, how the person made the money matters a lot. Yet a straight end-state view would say that how the money was made doesn’t matter at all. What this shows is that the vast majority holds a process view of justice.
“Inequality due to income earned through work and investment is just.”
Are the Means Important? Most economists judge how just or “equitable” an income distribution is by how equal it is; they don’t ask how people obtained what they have. In short, the majority of economists have a purely end-state view of justice. Typical, for example, is economist Joseph Stiglitz, former chairman of President Clinton’s Council of Economic Advisers. In his textbook, Economics of the Public Sector, he writes:
Consider again a simple economy with two individuals, Robinson Crusoe and Friday. Assume initially that Robinson Crusoe has ten oranges, while Friday has only two. This seems inequitable. Assume, therefore, that we play the role of government and attempt to transfer four oranges from Robinson Crusoe to Friday, but in the process one orange gets lost. Hence Robinson Crusoe ends up with six oranges, and Friday with five. We have eliminated most of the inequity, but in the process the total number of oranges available has been diminished. There is a trade-off between efficiency — the total number of oranges available — and equity.25
Notice that Stiglitz does not even bother to tell the reader how Crusoe and Friday obtained what they have. He doesn’t tell because the process is irrelevant to him; all that matters is the end state. He initially hedges by saying it “seems” inequitable rather than it is inequitable, but by the end of the paragraph, the hedge is gone and Stiglitz comes right out and says that inequality is inequitable. Stiglitz is not alone. Many economists move almost seamlessly between the words “equity” and “equality” as if they were interchangeable.
A Possible Dilemma? The propensity for economists to use only an end state view of justice brings up an interesting dilemma. While many economists write about just distributions of income based solely on the degree of inequality, it is unlikely they raise their children that way. They are not indifferent about whether their children earned or stole what they have; it matters greatly to them how the end state is reached because ends in themselves are not enough to justify the means. Thus, on decisions that really matter to them — such as child rearing — it is likely that even economists turn out to believe in the process view. The problem is not that these economists don’t practice what they preach. What they preach — the end-state view of justice — is horrible. What they practice in their child-rearing is quite reasonable. They should preach what they practice.
[page]Stiglitz reflects another mainstream economic viewpoint on income distribution when he writes:
If we don’t like the income distribution generated by the competitive market, we need not abandon the use of the competitive market mechanism. All we need do is redistribute the initial wealth, and then leave the rest to the competitive market.26
Oh, is that all? Stiglitz makes redistribution sound as easy as changing a graph on a blackboard. But, in fact, to “redistribute the initial wealth” in any substantial way would probably lead to a bloody civil war. Those whose main wealth is in their house, for example, would likely fight to keep their wealth. Stiglitz, who is almost certainly a multimillionaire, would probably be one of them.
“Government-enforced equality would require constant intervention to redistribute income.”
Moreover, once people learn that every time the government doesn’t like the income distribution it will intervene to change it, they will be less likely to do things to earn that wealth. And you can be sure that the government will want to intervene frequently because, even if total equality is achieved, the market would upset that pattern. A simple example illustrates how the market does this.27 In New Jersey, a mother gives birth to a large baby who grows up to be bigger than all his classmates. He also is good at basketball and hones his skills in high school and college. When the Orlando Magic basketball team hires him, many people are willing to pay to see him play. Therefore, teams that would like to sell more tickets are willing to pay him to play for them (ask the L.A. Lakers, Miami Heat or Phoenix Suns). Thus does Shaquille O’Neal get rich — and contribute to economic inequality. So do many other less visible people who have an aptitude for business, or any rare skill that is in great demand.
The free market upsets patterns. A government devoted to enforced equality must intervene again and again to prevent inequality. Either it must prevent wealthy people from spending their money the way they want or it must confiscate all income above a modest level. A truly equality-oriented government might even try what the regulators tried in the humorous yet haunting short story, “Harrison Bergeron,” by Kurt Vonnegut.28 In that story, the government offset all inherent advantages of people. Physically powerful men had to wear weights so that they wouldn’t be able to perform better than anyone else. Beautiful women had to wear masks to hide their beauty. Smart people had to wear electric headgear that zapped them whenever they started to think clearly. The point is that if the government truly dislikes the distribution of wealth or income that results from a free market, and if it insists on having to “correct” it, we will end up with a vicious totalitarian government.
[page]The entire focus on income inequality is mistaken. The vast majority of Americans are prosperous because a few million at the top are making a lot of money figuring out how to create new products and new ways to increase productivity. Many pundits and analysts sift through the data to find inequalities in income, which isn’t hard, then try to figure out how to shave some off. They usually suggest new government programs or taxes that are destructive of human freedom and prosperity. Instead they should recognize the many ways that governments hold people down — in the United States and elsewhere — and figure out how to end those oppressive measures. In the long run, that will make virtually all of us more prosperous and, in the short and long runs, will create a more just society.
[page]- A version of this study was presented at a meeting of the Association of Private Enterprise Education in Las Vegas, Nevada, April 7, 2008.
- Milton Friedman and George J. Stigler, “Roofs or Ceilings? The Current Housing Problem,” in Rent Control: A Popular Paradox (Vancouver: Fraser Institute, 1975), pages 90-91.
- U.S. Census Bureau, Housing and Household Economic Statistics Division, December 20, 2005. Available at http://www.census.gov/hhes/www/income/histinc/f02ar.html. Access verified on March 27, 2008. (As an aside, the Census Bureau seems incredibly interested in income data of various races. Its emphasis on race seems more appropriate to South Africa under Apartheid than to the United States. We are a long way from Martin Luther King’s dream of a society where someone is judged, not by the color of his skin but by the content of his character.)
- In 2004, the mean net worth of families headed by someone age 65 to 74 was $690,900, while the mean net worth of the families headed by someone age 55 to 64 was $843,800. See Federal Reserve Board, Survey of Consumer Finances, 1998-2004.
- U.S. Census Bureau, Current Population Survey, 2007 Annual Social and Economic Supplement.
- Alan Blinder in Martin Feldstein, The American Economy in Transition (Chicago: University of Chicago Press, 1980).
- U.S. Census Bureau, Current Population Survey.
- Isabel Sawhill, “Poverty in America,” in David R. Henderson, ed., The Concise Encyclopedia of Economics (Indianapolis: Liberty Fund, 2008).
- Paul Krugman, “The Death of Horatio Alger,” Nation, January 5, 2004.
- For the full argument see: Alan Reynolds, Income and Wealth (Westport, Connecticut: Greenwood Press, 2006), pages 37-39.
- Note that this is households, not families. There is a strong overlap but they are not the same.
- Thomas Piketty and Emmanuel Saez, “Income Inequality in the United States, 1913-1998,” National Bureau of Economic Analysis, Working Paper 8467, September 2001; published in Quarterly Journal of Economics, February 2003.
- Paul Krugman, “The Rich, the Right, and the Facts,” American Prospect, November 30, 2002.
- Reynolds, Income and Wealth, page 28.
- Michael J. Boskin, “Consumer Price Indexes,” in David R. Henderson, ed., The Concise Encyclopedia of Economics (Indianapolis: Liberty Fund, 2008), pages 77-81.
- Michael Cox and Richard Alm, Myths of Rich and Poor (New York: Basic Books, 1999).
- The next few paragraphs on the Wall Street Journal and New York Times articles draw heavily on David R. Henderson, “Income Mobility: Alive and Well,” Freeman, October 2005.
- David Wessel, “As Rich-Poor Gap Widens in the U.S., Class Mobility Stalls” Wall Street Journal, May 13, 2005.
- Note something else interesting in the Wessel quote above. He writes, “Despite the spread of affirmative action, the expansion of community colleges and the other social change designed to give people of all classes a shot at success.” In other words, Wessel assumes that affirmative action and higher subsidies to colleges would increase income mobility but implicitly concludes that they don’t. But nowhere in his lengthy article does this lead him to question the need for, or desirability of, these two government interventions.
- Janny Scott and David Leonhardt, “Class in America: Shadowy Lines that Still Divide.” New York Times, May 15, 2005.
- Sylvia Nasar, “One Study’s Riches, Another’s Rags,” New York Times, June 17, 1992.
- Finis Welch, “In Defense of Inequality,” American Economic Review, Vol. 89, No. 2, May 1999, page 1.
- In order, they were Fairfax County, Virginia, Loudoun County, Virginia, and Howard County, Maryland. Montgomery County, Maryland and Arlington County, Virginia ranked 8 and 9. The median income in Fairfax County was $100,318. Census Bureau, U.S. Department of Commerce, Income, Earnings, and Poverty Data from the 2006 Community Survey, August 2007, Table 3, page 8.
- This section on fairness draws heavily on David R. Henderson, The Joy of Freedom: An Economist’s Odyssey (Upper Saddle River, N.J.: Financial Times Prentice Hall, 2002), pages 157-161.
- Joseph E. Stiglitz, Economics of the Public Sector, 3rd ed. (New York: W.W. Norton, 2000), page 94.
- Stiglitz, Public Sector, page 60.
- The following is my version of a story originally told about Wilt Chamberlain by Robert Nozick in Anarchy, State, and Utopia (New York: Basic Books, 1974).
- Kurt Vonnegut, Welcome to the Monkey House (New York: Dell, 1968).
David R. Henderson is a research fellow with the Hoover Institution. He is also an associate professor of economics at the Naval Postgraduate School in Monterey, California. Dr. Henderson is the editor of The Fortune Encyclopedia of Economics (Warner Books, 1993) and The Concise Encyclopedia of Economics (Indianapolis, Ind.: Liberty Fund, 2008). He is also the author (with Charles L. Hooper) of Making Great Decisions in Business and Life (Chicago Park, CA: Chicago Park Press, 2006) and The Joy of Freedom: An Economist’s Odyssey (Upper Saddle River, N.J.: Financial Times Prentice Hall, 2002), which has been translated into Russian and Chinese. He writes frequently for the Wall Street Journal. Henderson earned his bachelor of science degree in mathematics from the University of Winnipeg in 1970 and his Doctor of Philosophy degree in economics from the University of California, Los Angeles, in 1976.